Graphical forecasting interface

a forecasting interface and graph technology, applied in the field of graph forecasting interfaces, can solve the problems of difficult and cumbersome forecasting tasks, large amount of forecast data input, and complex forecasting research, and achieve the effects of improving forecasting mechanisms, efficient and robust, and convenient collection, storage and display

Inactive Publication Date: 2007-03-22
PREDICTWALLSTREET LLC
View PDF6 Cites 70 Cited by
  • Summary
  • Abstract
  • Description
  • Claims
  • Application Information

AI Technical Summary

Benefits of technology

[0015] The proposed system, method and device can offer, among other advantages, an improved forecasting mechanism. This can be accomplished in an efficient and robust manner compared to other forecasting mechanisms. Advantageously, the proposed system, method and device can gather information from users regarding future performance and optionally but advantageously display past performance on a single graph. The proposed system, method and device can generate and display a composite prediction based on previous user input. By using a graph, a large amount of user information is easily collected, stored and displayed.

Problems solved by technology

Forecasting is often a difficult and cumbersome task.
Typically forecasting involves substantial and complicated research.
The input of a large amount of forecast data is tedious and wastes valuable time and resources.
Given the daunting task of having to input a large number of forecasts individually, forecasting systems usually lack the requisite amount of information necessary to generate an accurate prediction.
As such, current forecasting systems are inadequate.
In addition, forecasting systems are usually not integrated with the research that must be performed.
The lack of an integrated research and forecast tool generates numerous errors and frustration on the part of the user.

Method used


Image

  • Graphical forecasting interface
  • Graphical forecasting interface
  • Graphical forecasting interface

Examples


Embodiment Construction

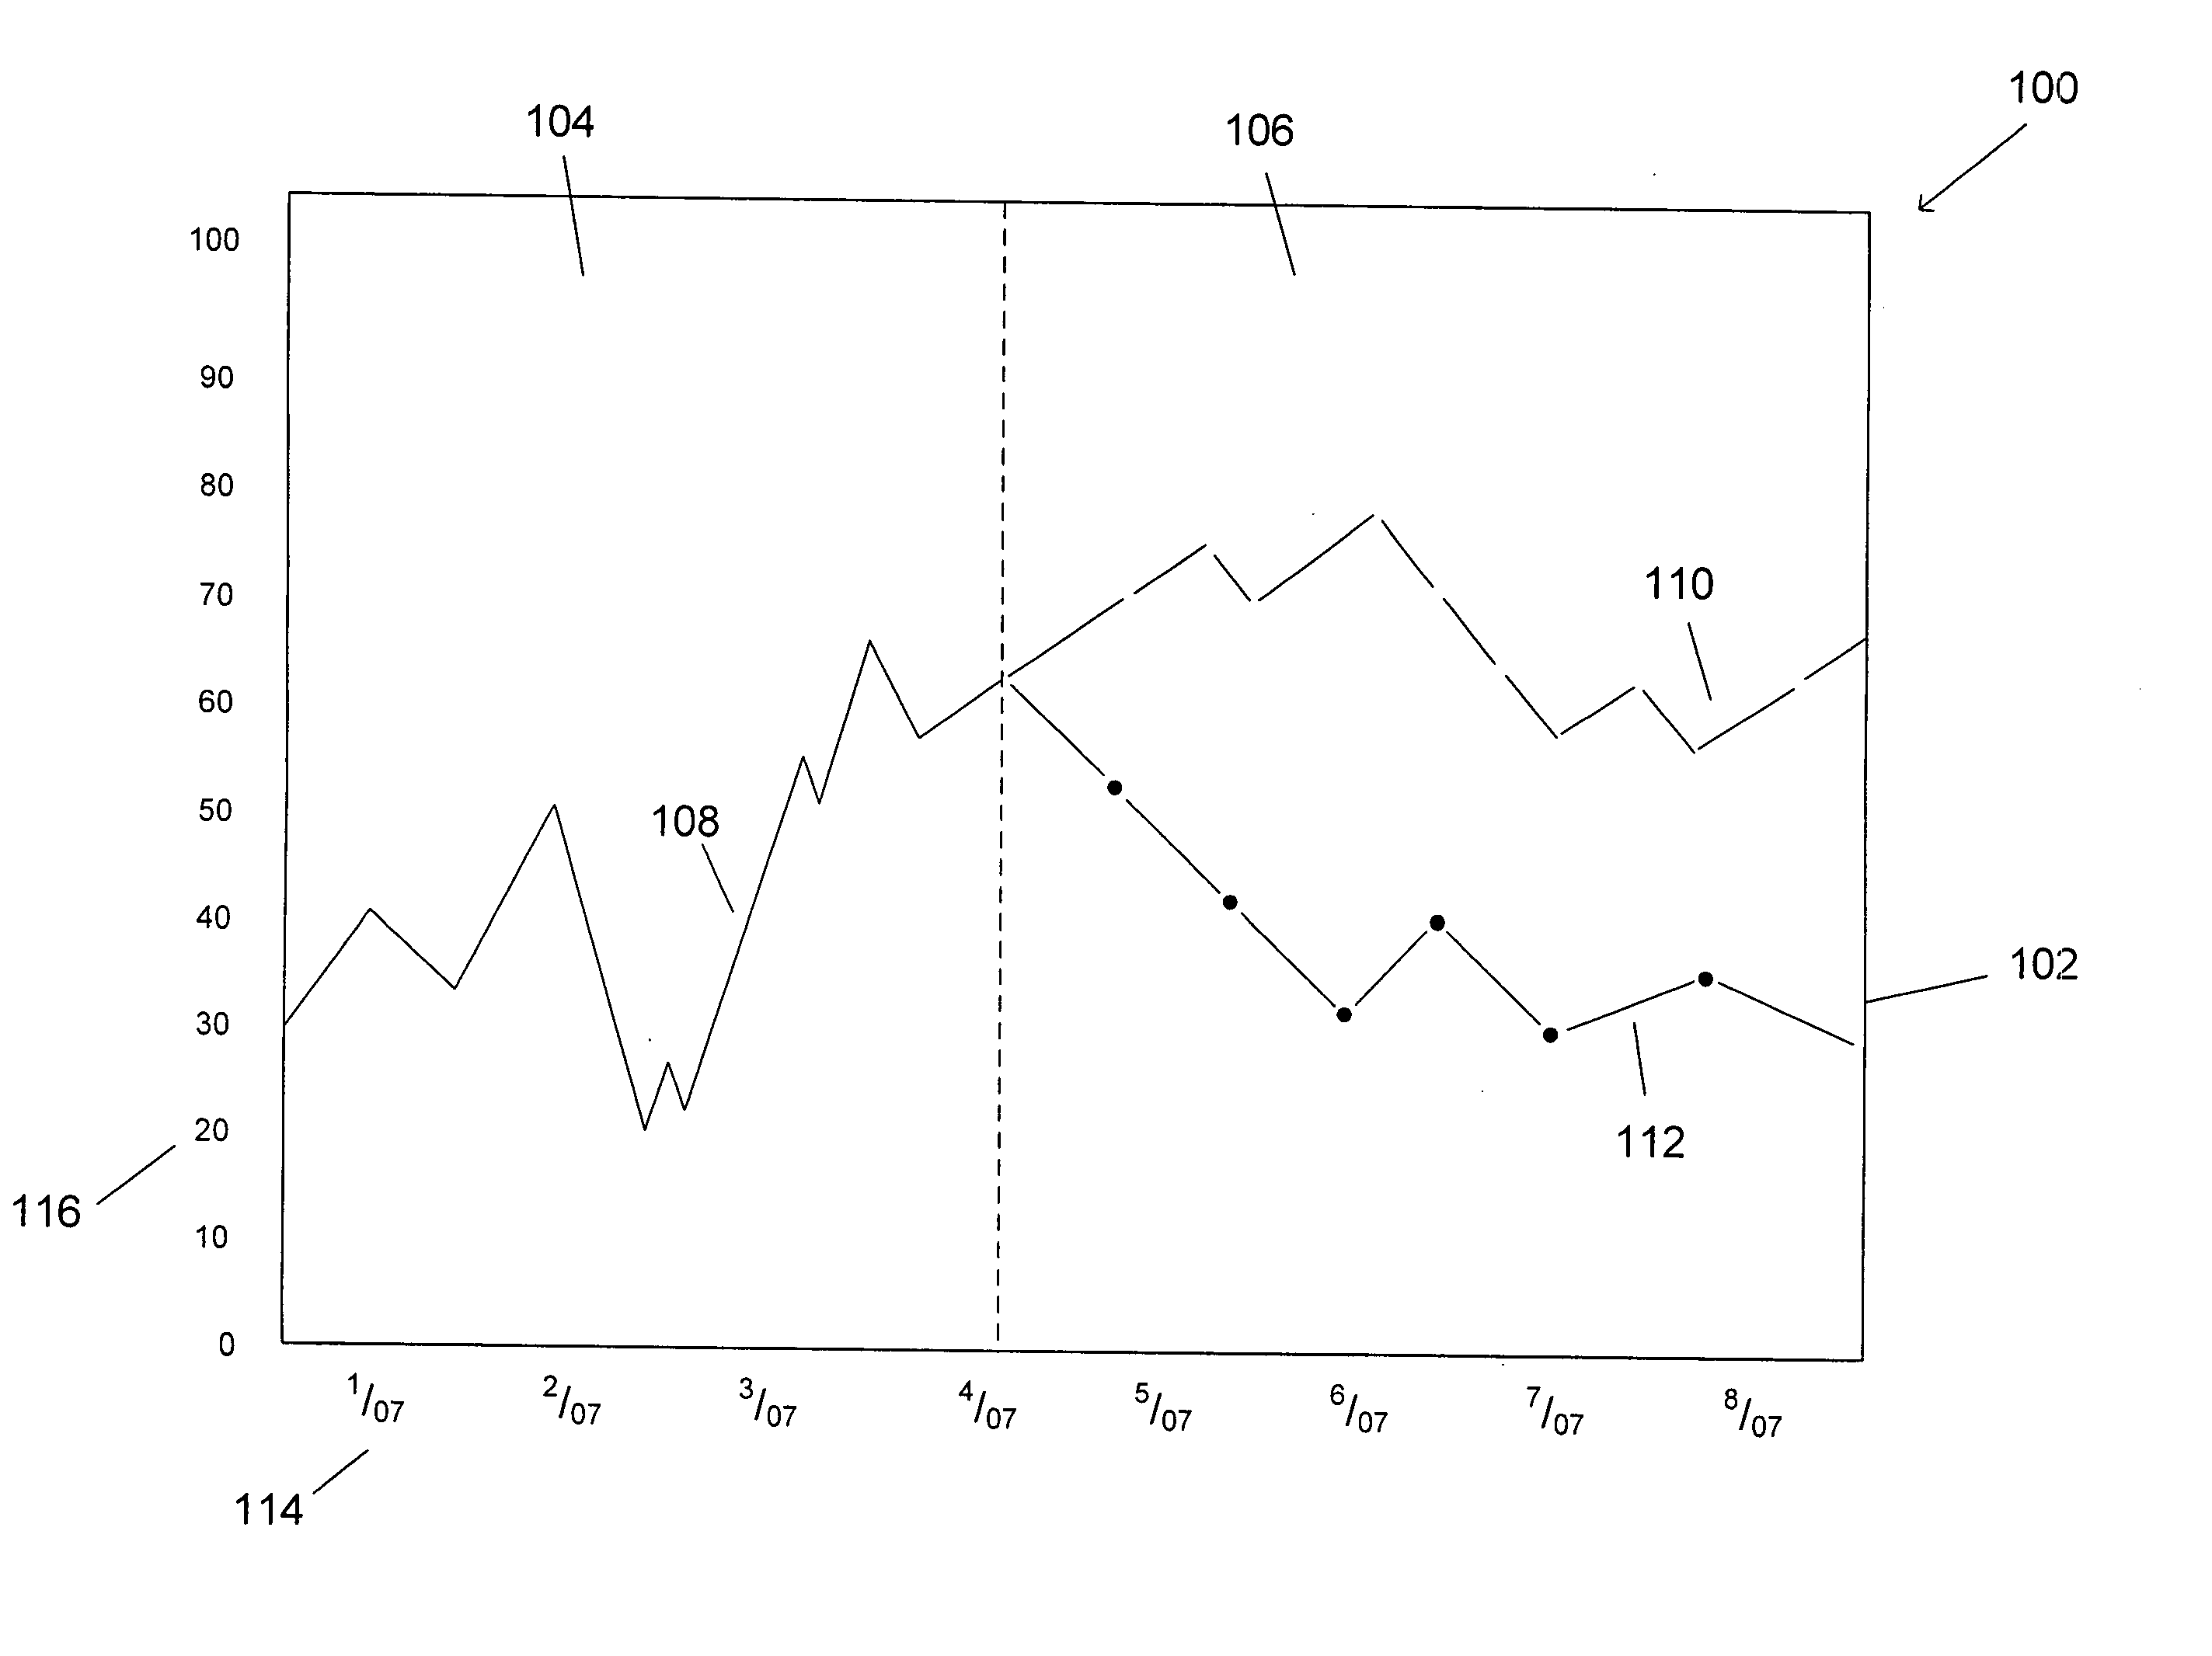
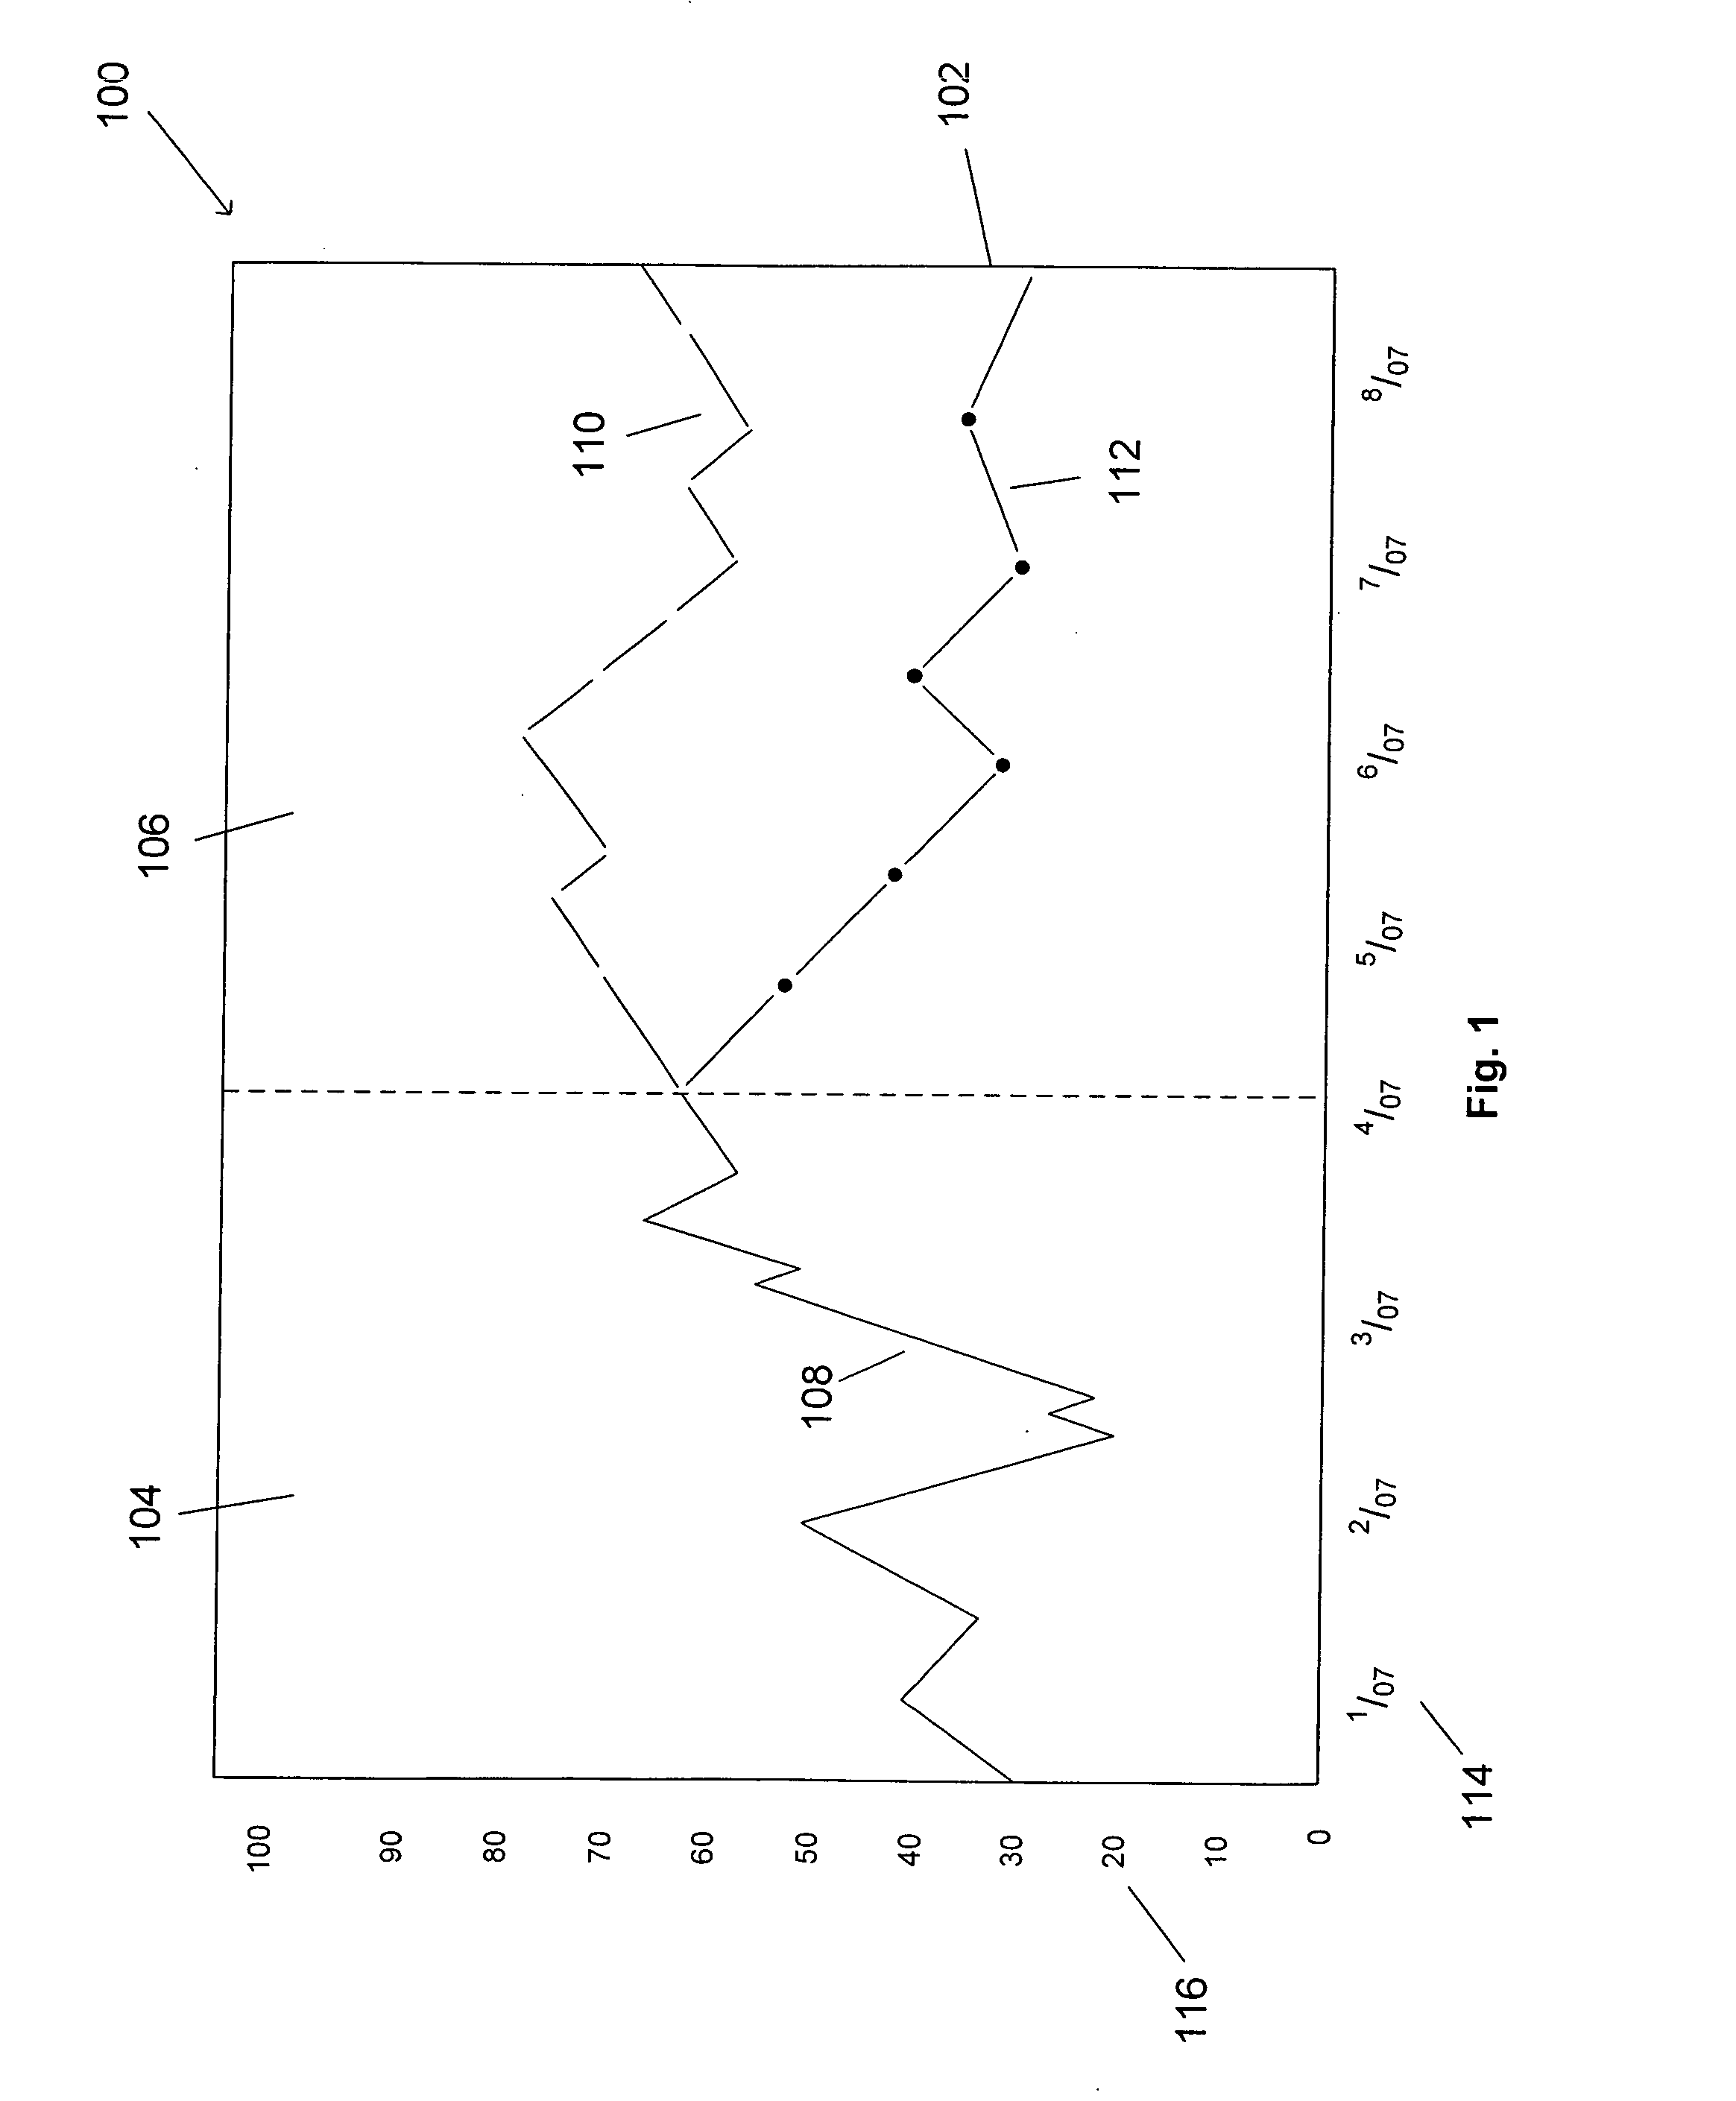
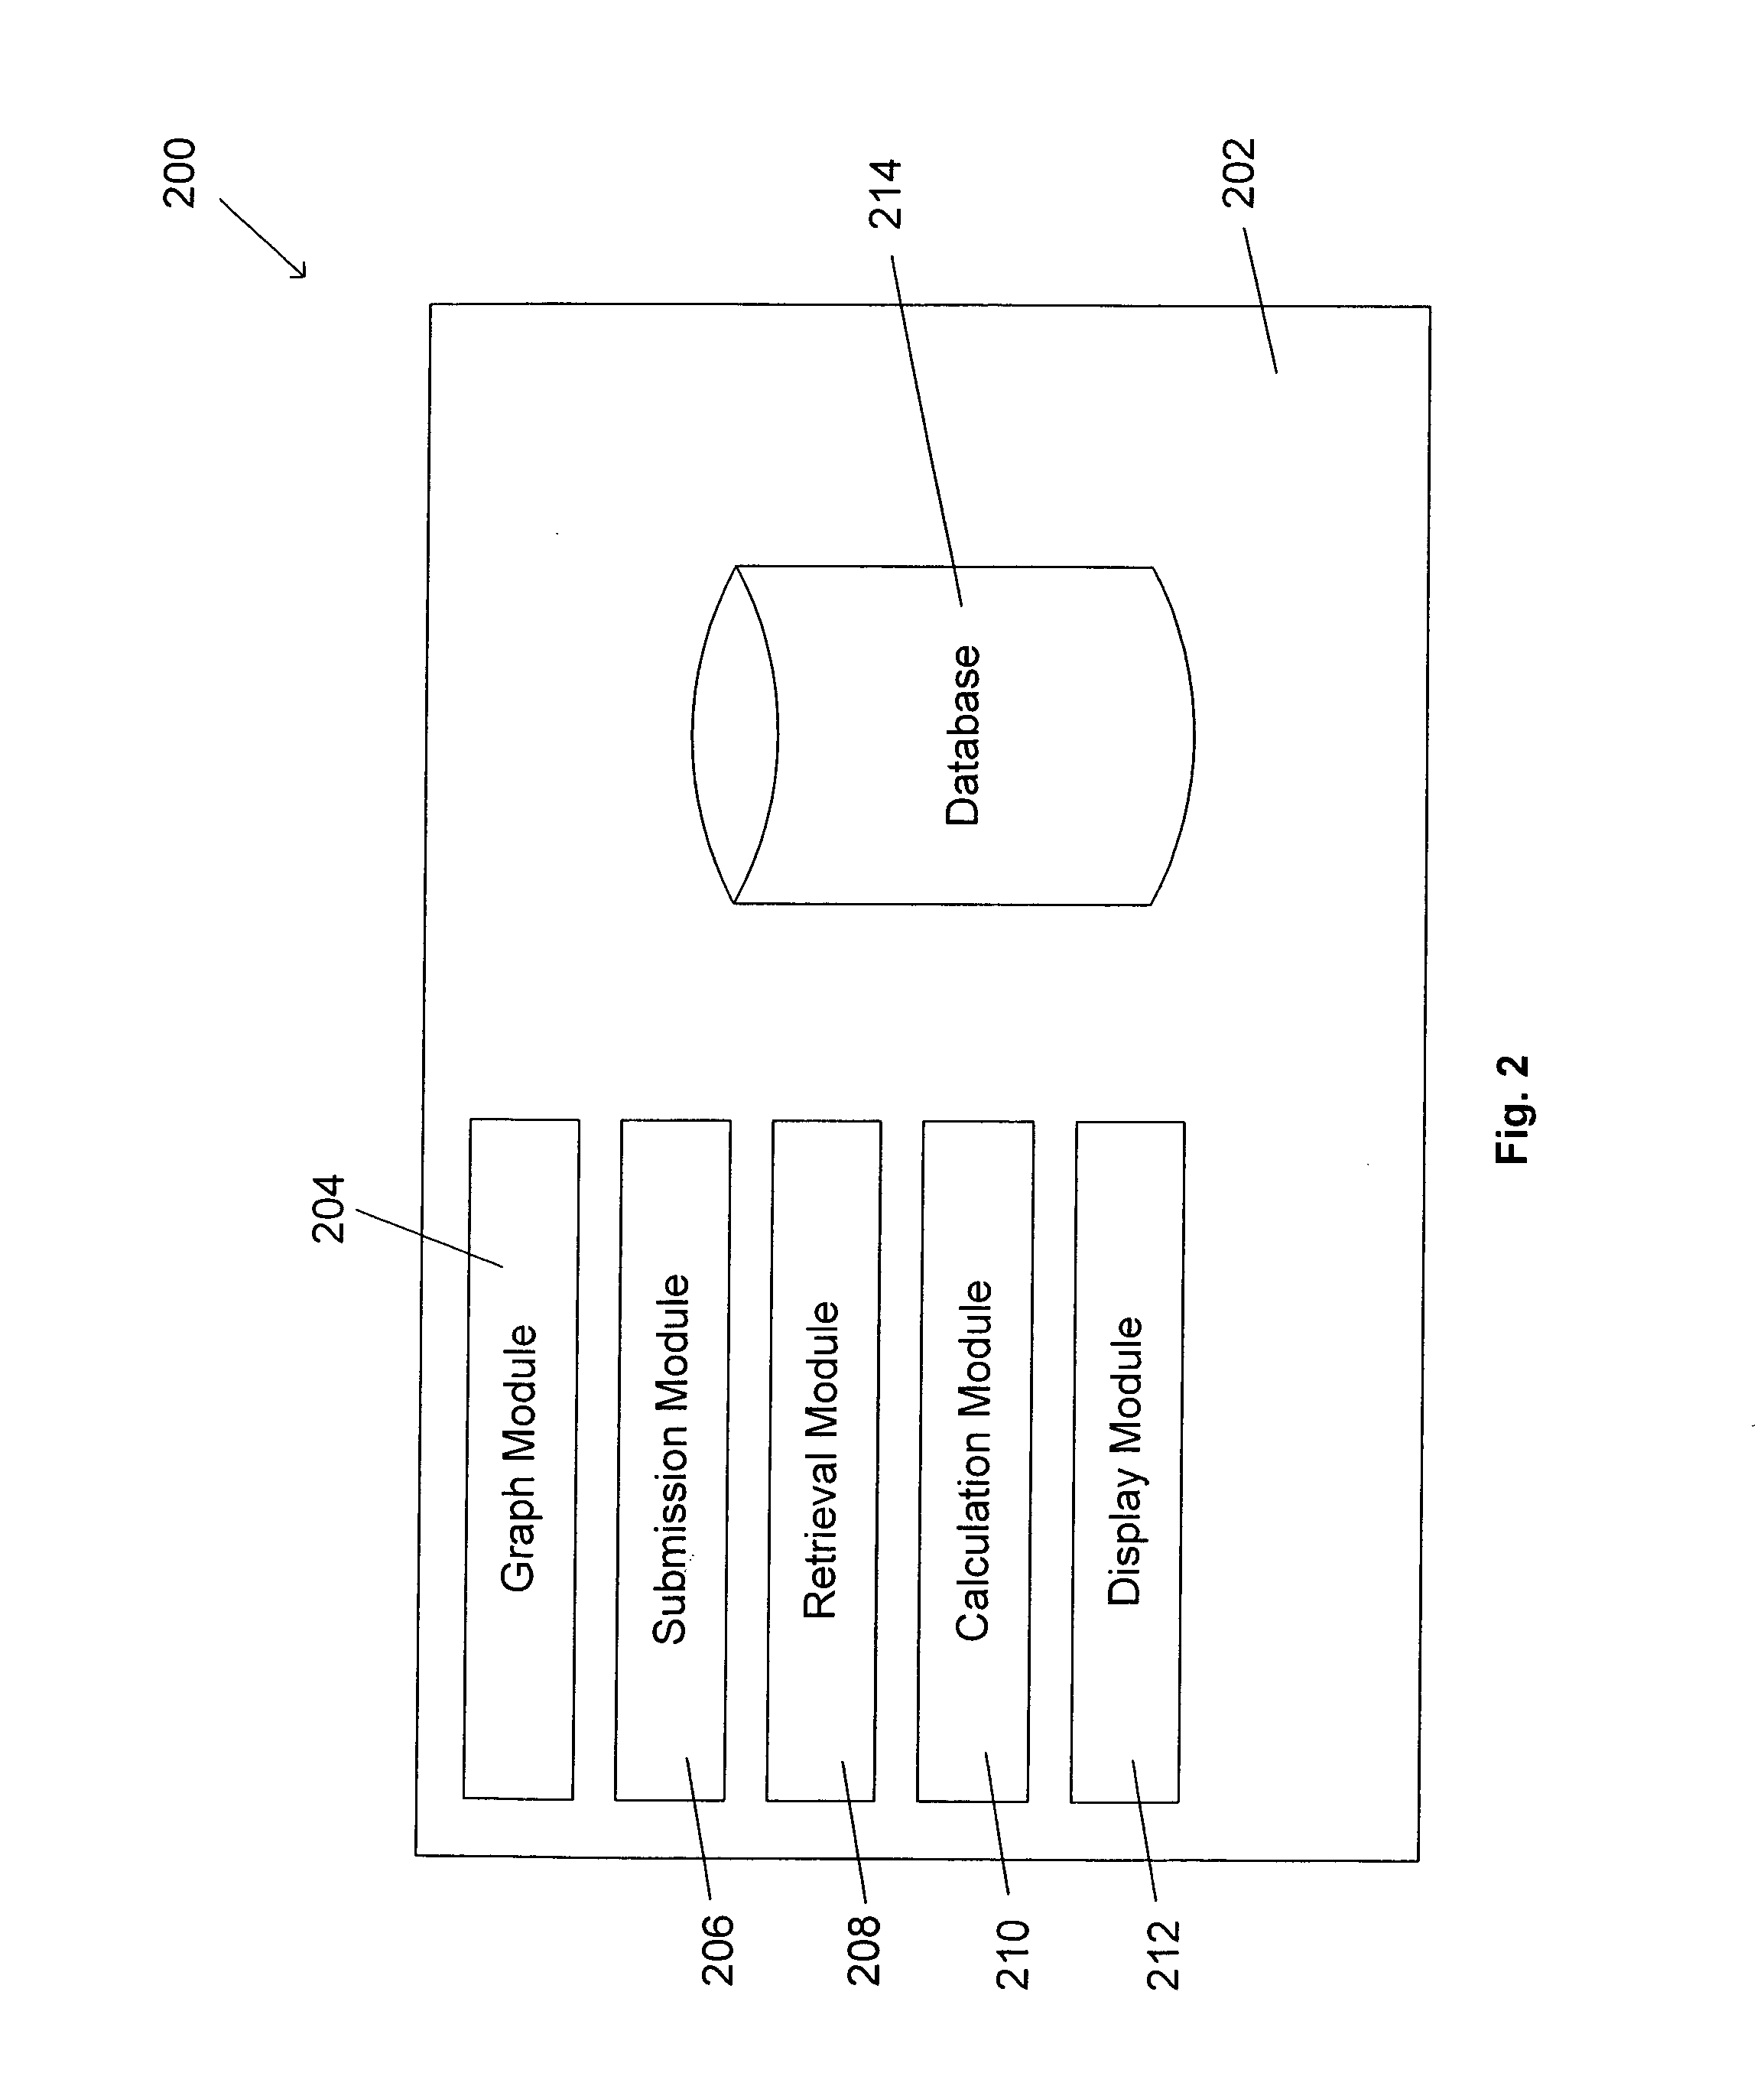
[0040] In the following description, several specific details are presented to provide a thorough understanding of embodiments of the invention. One skilled in the relevant art will recognize, however, that the invention can be practiced without one or more of the specific details, or in combination with other components, and the like. In other instances, well-known implementations or operations are not shown or described in detail to avoid obscuring aspects of various embodiments of the invention. A system, method, device, and computer program for using a graph and graphical interface for both input and output is provided. The graphical interface and the combined input / output nature of the user interface has particularly useful application for the purpose of capturing various types of predictions and forecasts from users relative to future events or conditions. The future prediction or forecast portion primarily pertains to the interactive portion of the graph, while past or histor...


PUM


Abstract

A system, method, apparatus, and technique for gathering and providing information forecasts is disclosed. An example of a system according to the technique includes a graph module having at least and interactive portion and an optional static portion. The interactive portion of the graph can be capable of plotting future data points provided by a user. The static portion of the graph can contain a plot of past data points. The graphical forecasting interface provides a simple mechanism for a user to make one or a plurality of future predictions as to an information item using a graphical input.

Description

CROSS-REFERENCE TO RELATED APPLICATIONS [0001] This application claims the benefit of U.S. Provisional Application No. 60 / 719,704 filed on 22 Sep. 2005, entitled GRAPHICAL FORECASTING INTERFACE by inventors Craig Kaplan and Calen Lopata which application is incorporated herein by reference.FIELD OF THE INVENTION [0002] This invention pertains generally to systems and methods for using a graphical interface for both presenting an output and receiving an input of data, and more particularly to a system and method for providing and using a graphical forecasting interface (GFI) for accepting data predictions and forecasts for a future information or event based on a user interaction with a graph and the underlying database and algorithmic elements associated with the graphical display. BACKGROUND [0003] Forecasting is often a difficult and cumbersome task. Typically forecasting involves substantial and complicated research. After the research is complete, the forecaster must input the f...

Claims


Application Information

Patent Timeline
Patent Type & Authority Applications(United States)
IPC IPC(8): G07G1/00G06F40/00G06F40/189G06F40/191
CPCG06Q10/04G06Q30/0202G06Q10/10
Inventor KAPLAN, CRAIG ANDREWLOPATA, CALEN
Owner PREDICTWALLSTREET LLC
Why Eureka
Try Eureka