Spectroscopic microscopy with image-driven analysis

a spectroscopic microscope and image-driven technology, applied in the field of molecular spectrometry instruments, can solve the problems of reducing the signal-to-noise ratio, time-consuming and tedious, hindering novice users, etc., and achieves the effect of facilitating the identification of these substances

Active Publication Date: 2008-02-28
THERMO ELECTRONICS SCI INSTR LLC
View PDF5 Cites 166 Cited by
  • Summary
  • Abstract
  • Description
  • Claims
  • Application Information

AI Technical Summary

Benefits of technology

[0017]After a region spectrum is collected from a specimen region (such as the region 200c in FIG. 2B), it is then useful to move the specimen stage 102 so that the underlying or adjacent specimen region is within the aperture 112 (e.g., the specimen region of the matrix 200d). A matrix spectrum of the matrix specimen region can then be collected through the aperture 112, preferably while maintaining the same aperture size as that used for the specimen region (as illustrated, for example, by the aperture 204b in FIG. 2B). The matrix spectrum collected from aperture 204b may then be subtracted from the region spectrum collected from aperture 204. Subtracting the matrix spectrum from the region spectrum will yield a corrected region spectrum which should at least substantially represent only the substance(s) of the specimen region, thereby making it easier to identify these substances by use of reference libraries or the like.

Problems solved by technology

A disadvantage of this approach is that each spectrum captured from an area will reflect the presence of whatever substances are present in the area (or at least the presence of those substances that are responsive to the incident light): for instance, if an area includes a particle of particular interest to the user, the captured spectrum from the area will reflect not just the spectrum of the particle, but will also tend to include contributions from the substances surrounding the particle within the area.
The disadvantage of the manual approach is that it is time-consuming and tedious—a user must move the mask to each particle of interest, and size the aperture so that only the desired area is imaged to the detector—and here too results must be carefully interpreted.
Generating the correct settings for the microscope can also be a challenge, since many novice users fail to appreciate that the image of the specimen seen through the microscope's eyepiece(s) or camera may not correspond to the specimen as seen by the spectroscopic detector; thus, simply focusing on a particle or the like within a specimen may not limit the detector's field of view (and thus the spectroscopic readings) to the particle.
Other subtleties also tend to hinder novice users, such as the issue that a smaller aperture setting (smaller detector field of view) tends to decrease the signal-to-noise ratio of the resulting spectral readings simply because the detector captures less light from a smaller field of view.
All of the foregoing issues tend to pose obstacles to effective use of spectroscopic microscopes, particularly to new users.

Method used


Image

  • Spectroscopic microscopy with image-driven analysis
  • Spectroscopic microscopy with image-driven analysis
  • Spectroscopic microscopy with image-driven analysis

Examples


Embodiment Construction

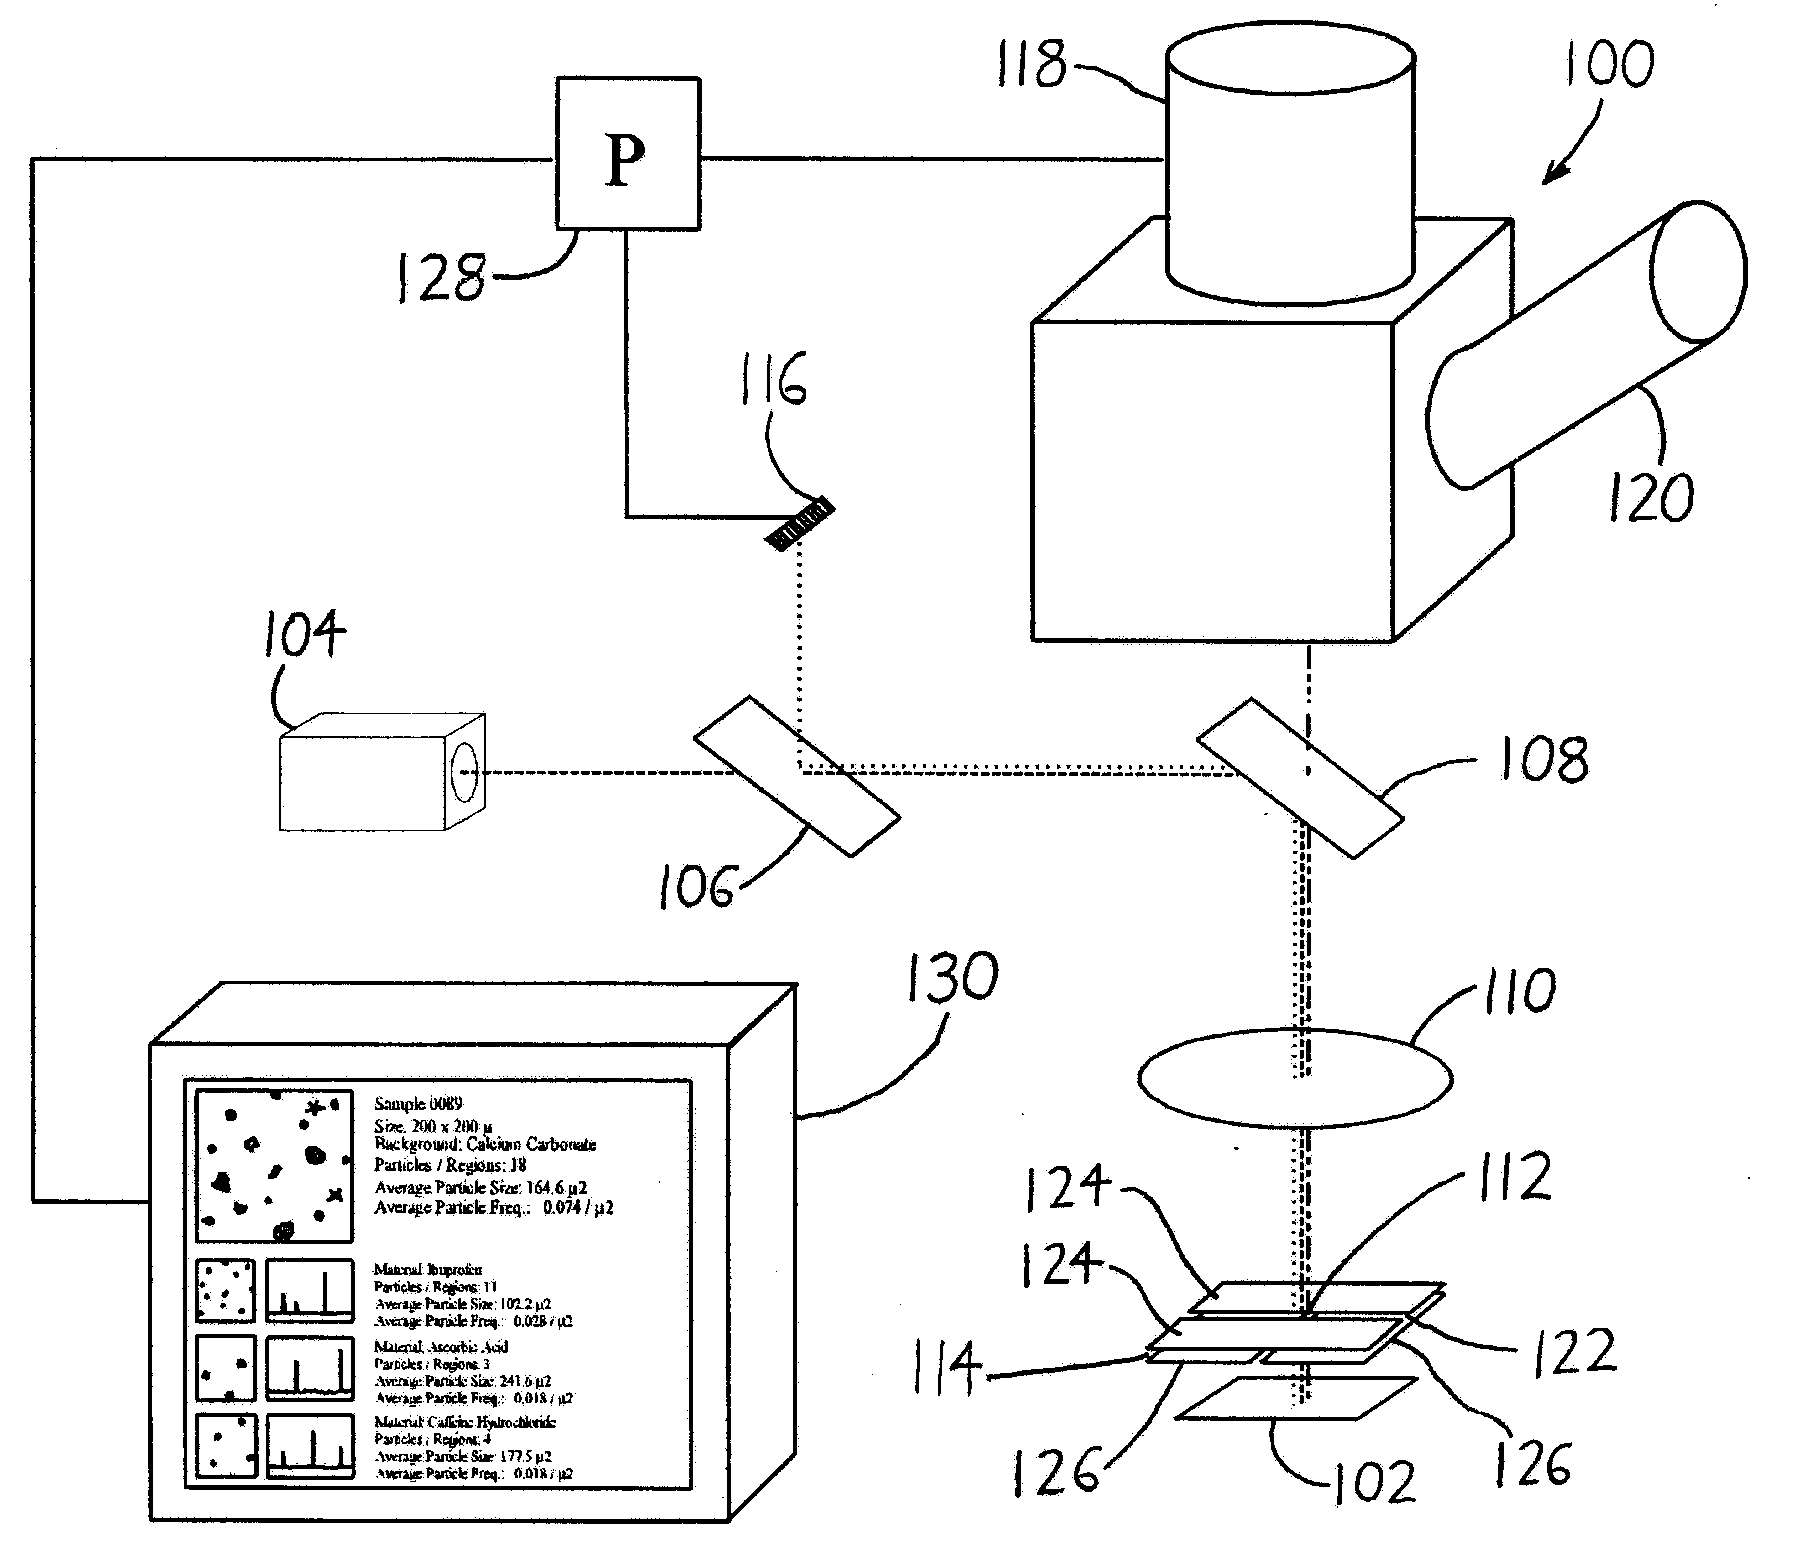
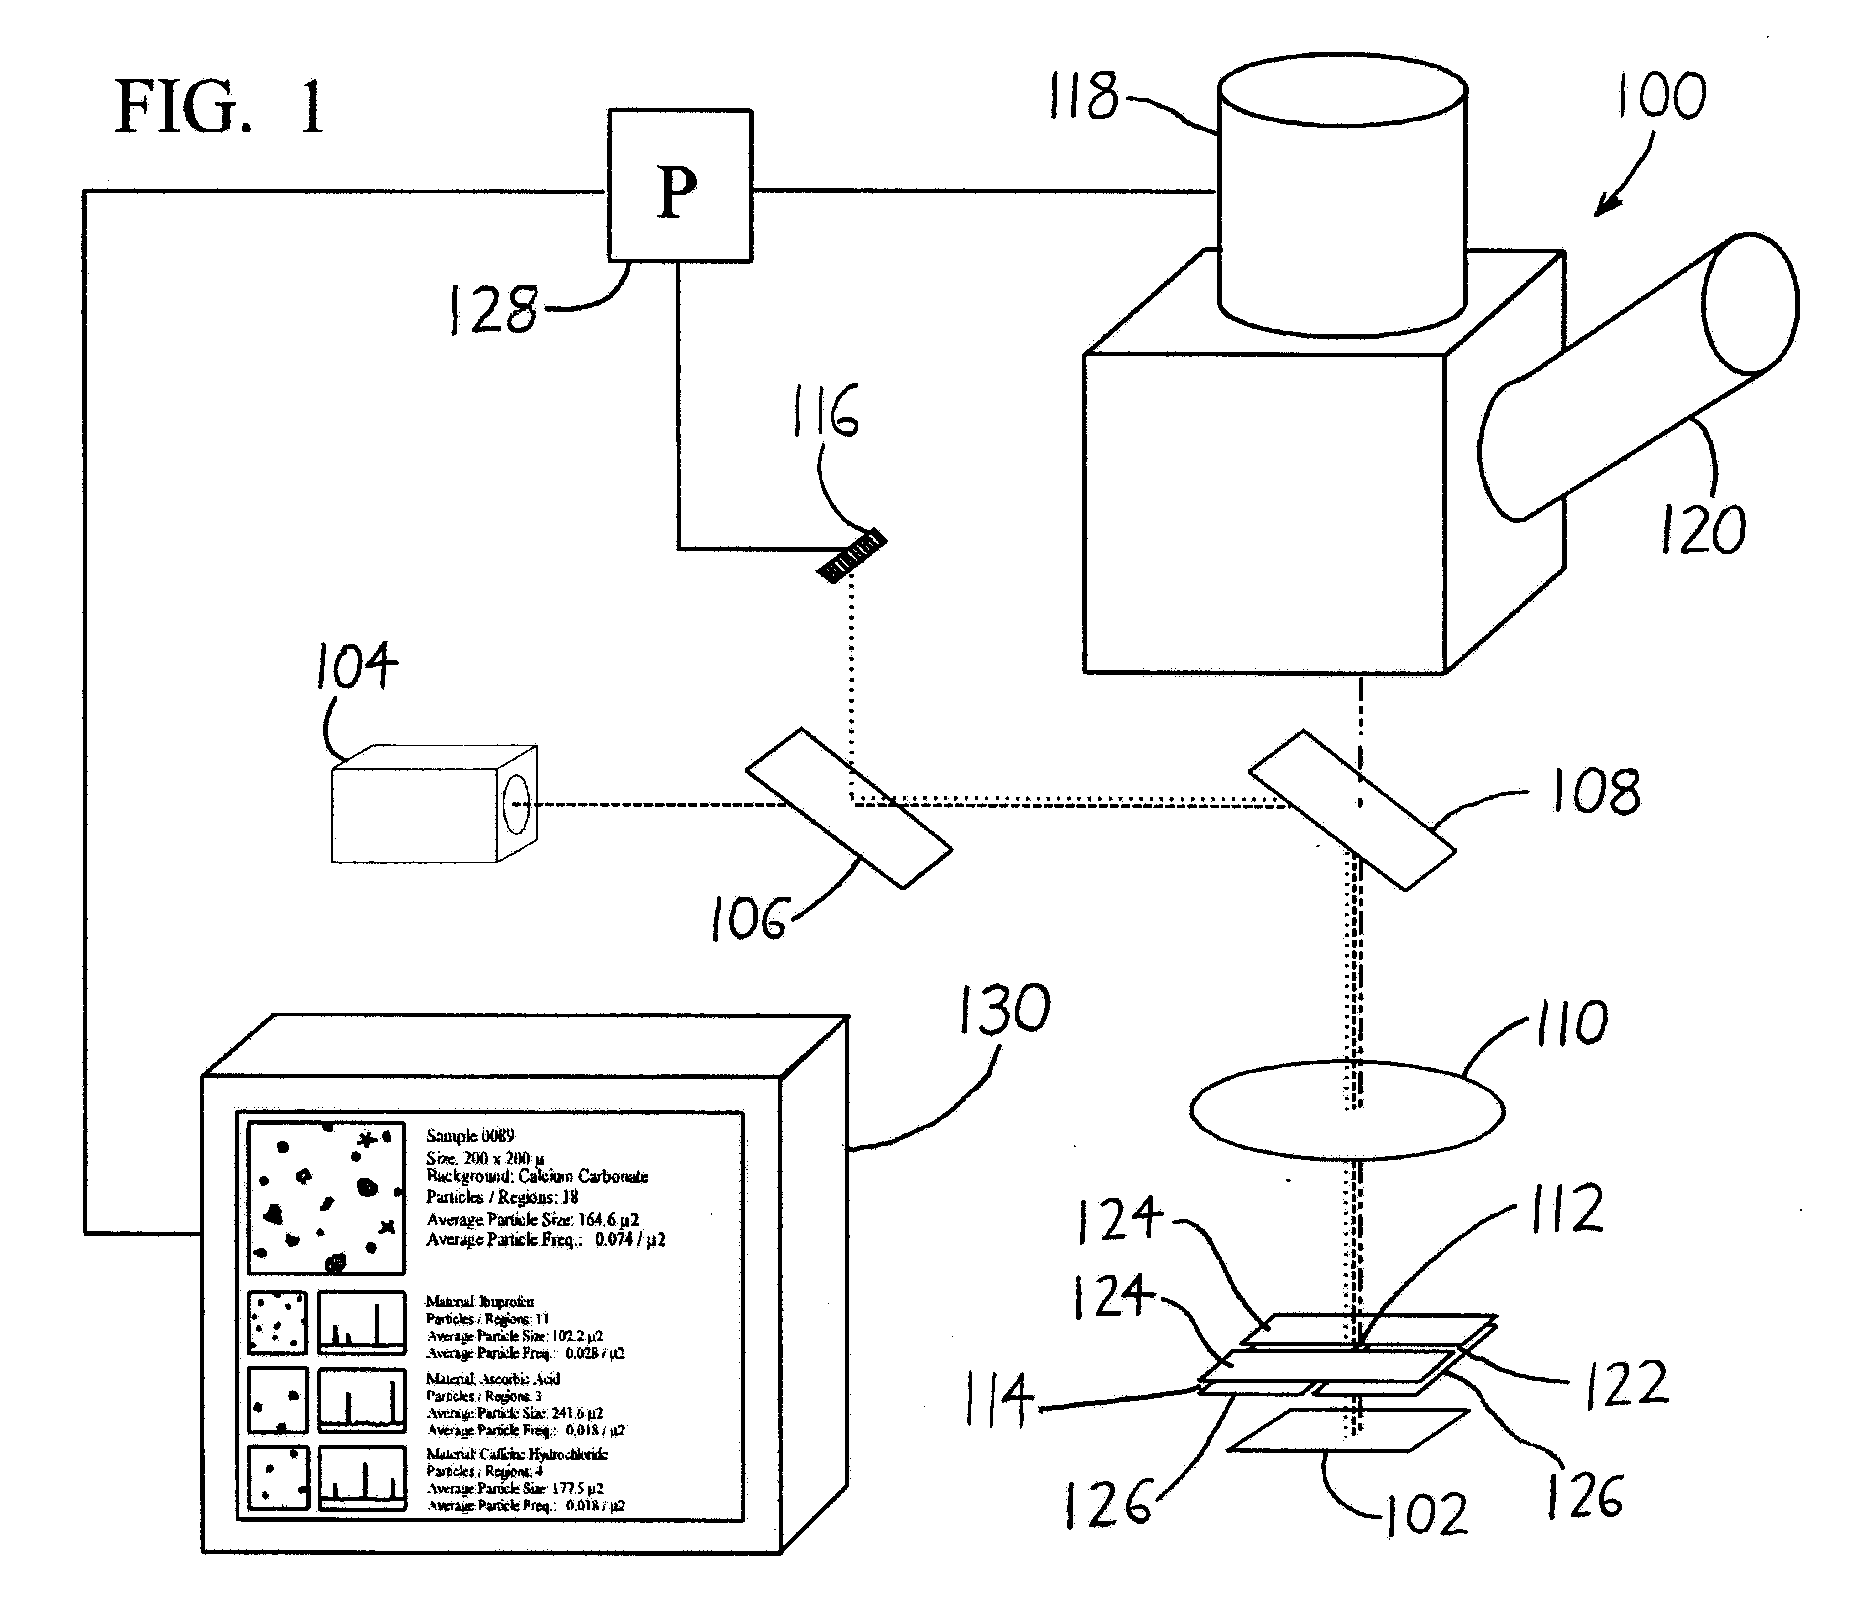
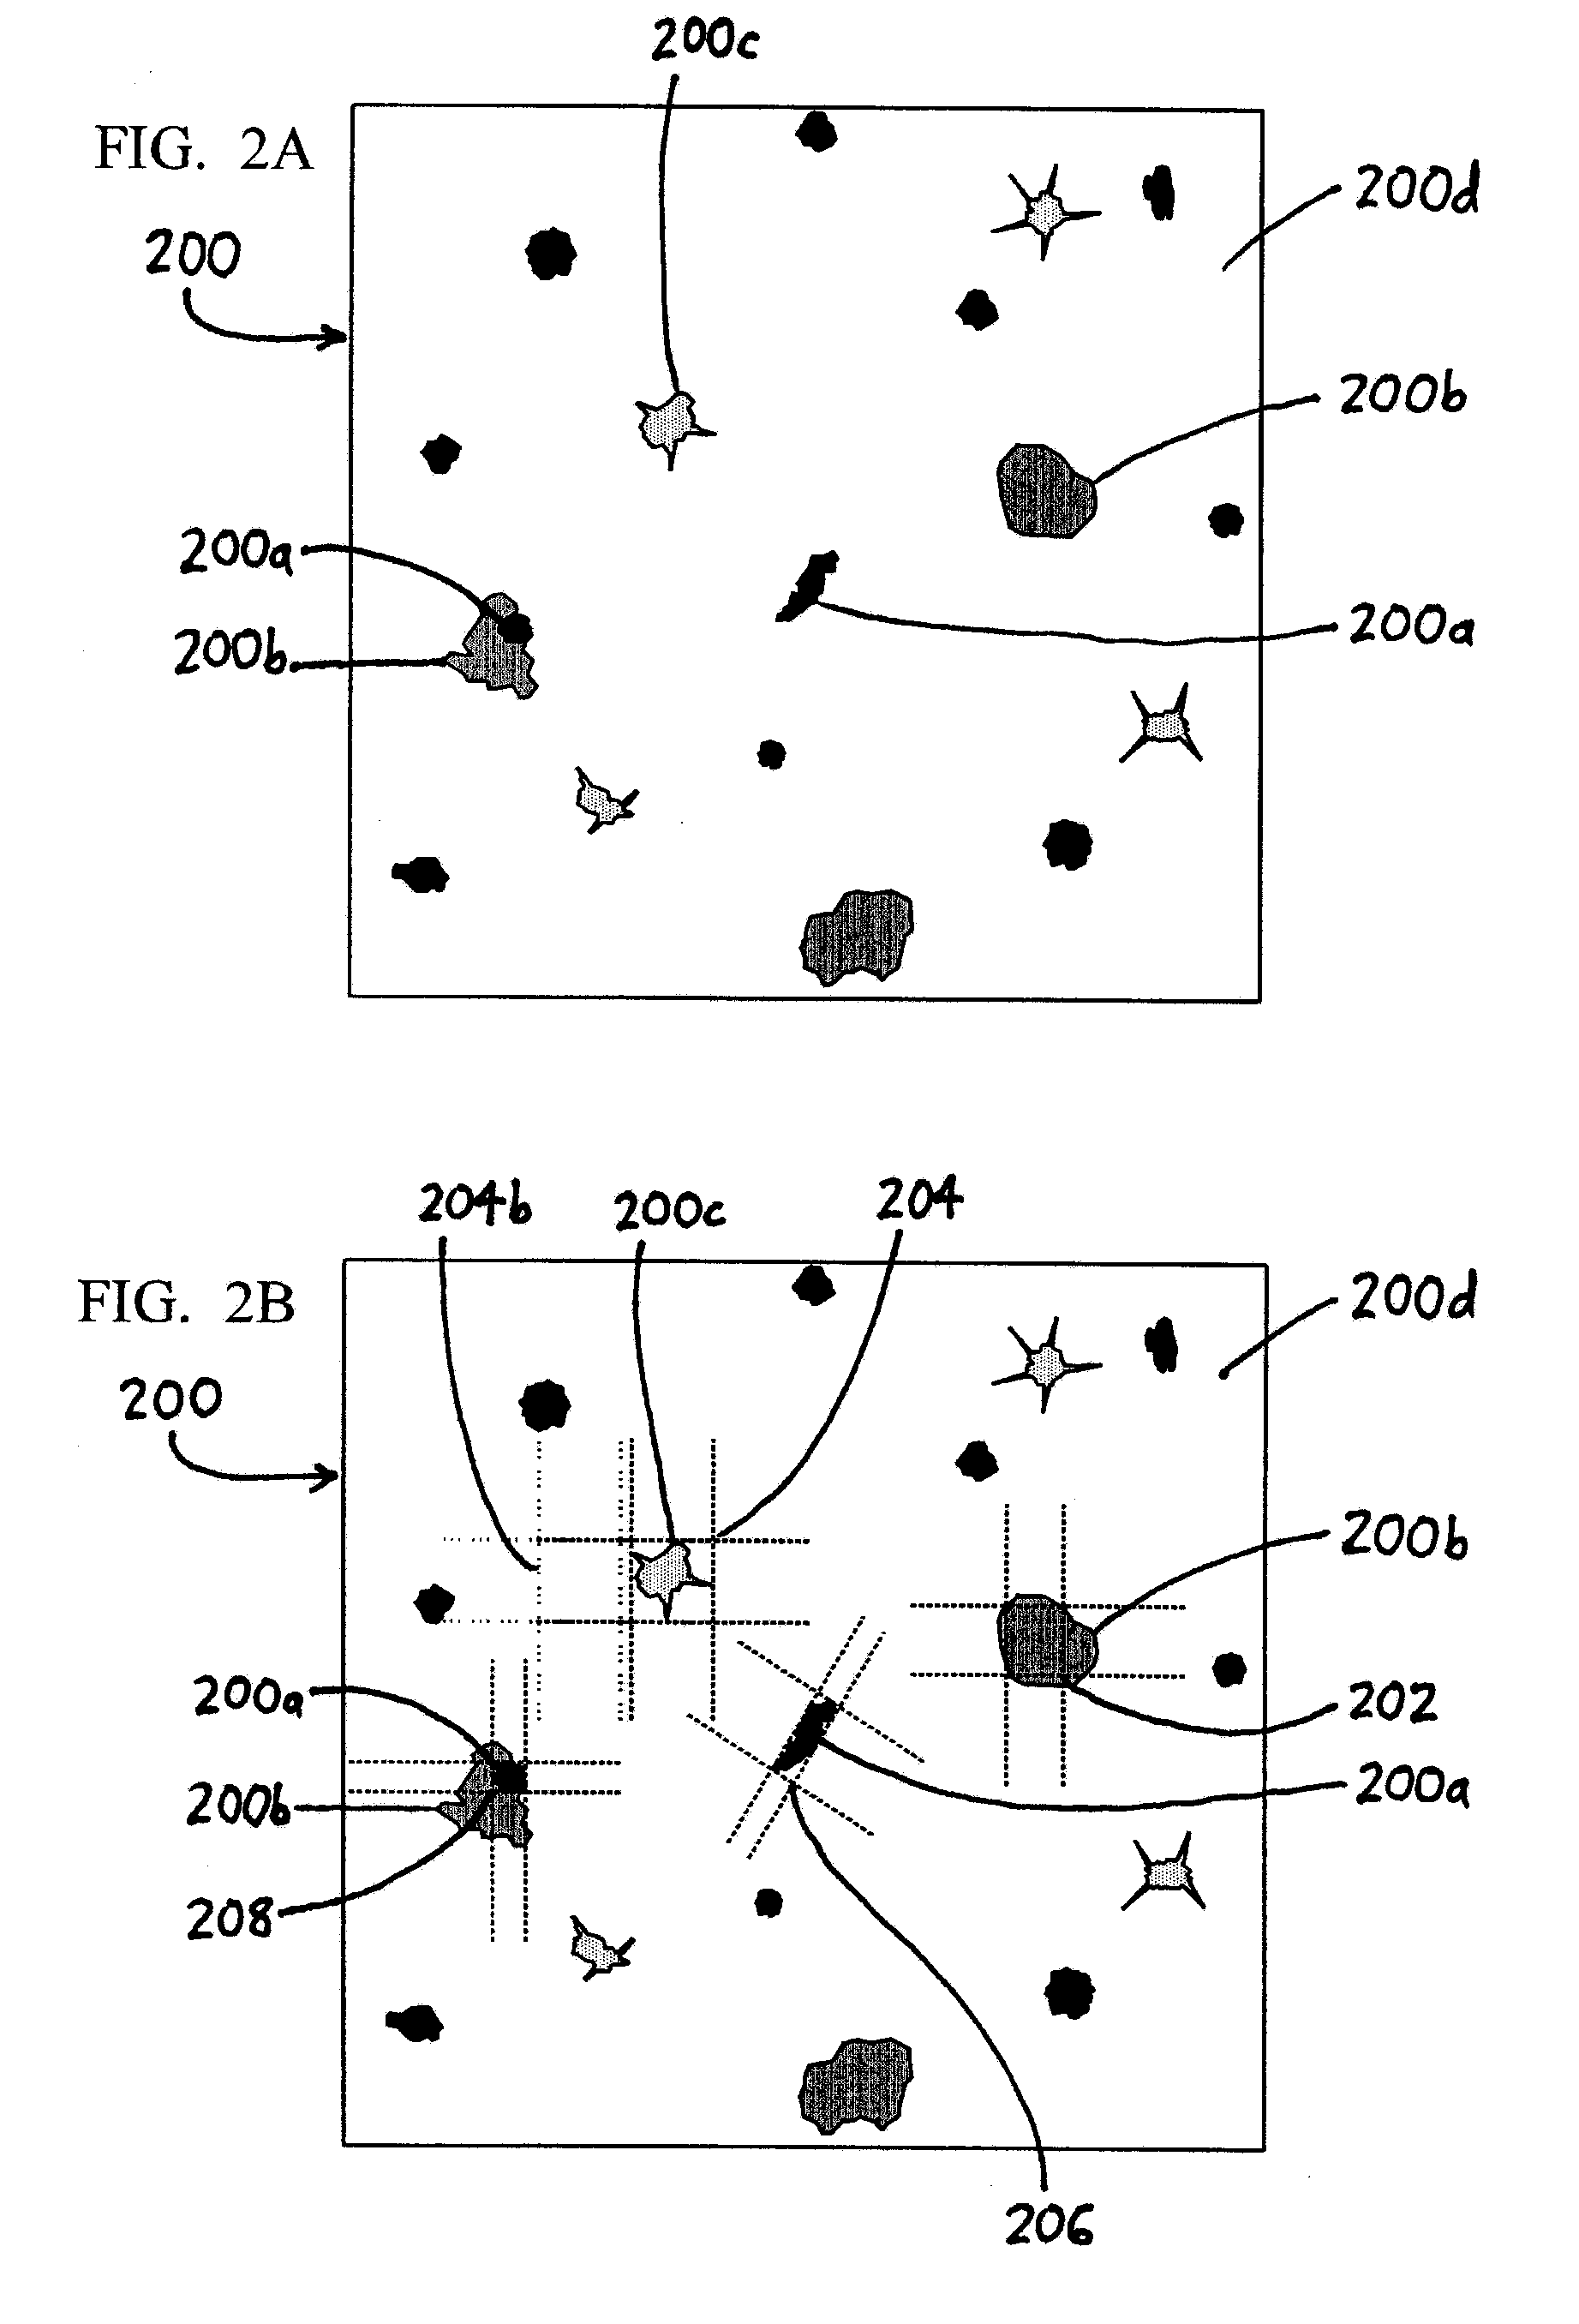
[0025]To review and expand on the discussion in the foregoing Summary, the images obtained by a spectroscopic microscope can be used to define the size and location of an aperture through which spectra are collected from a specimen, and the collected spectra can be linked to their corresponding image regions (identified as areas having the same or similar appearance during image analysis) to provide useful and easily understood output. Regions can be identified and spectrometrically sampled solely on the basis of their appearance, e.g., each specimen region corresponding to an identified image region may be spectrally analyzed. Alternatively or additionally, all or part of a region of interest on a specimen may be spectrometrically sampled, as by capturing spectra about a one- or two-dimensional matrix of sampled areas, and the correlations between the spectra in the matrix may be used in conjunction with specimen regions identified from the specimen image to assign extracted spectr...


PUM


Abstract

In a spectroscopic microscope, a video image of a specimen is analyzed to identify regions having different appearances, and thus presumptively different properties. The sizes and locations of the identified regions are then used to position the specimen to align each region with an aperture, and to set the aperture to a size appropriate for collecting a spectrum from the region in question. The spectra can then be analyzed to identify the substances present within each region of the specimen. Information on the identified substances can then be presented to the user along with the image of the specimen.

Description

CROSS-REFERENCE TO RELATED APPLICATIONS[0001]This application claims priority under 35 USC §119(e) to U.S. Provisional Patent Application 60 / 840,882 filed 28 Aug. 2006, the entirety of which is incorporated by reference herein.FIELD OF THE INVENTION[0002]This document concerns an invention relating generally to instruments for molecular spectrometry, and more specifically to spectroscopic microscopes.BACKGROUND OF THE INVENTION[0003]A molecular spectrometer (sometimes referred to as a spectroscope) is an instrument wherein a solid, liquid, or gaseous specimen is illuminated, often with non-visible light, such as light in the infrared region of the spectrum. The light from the specimen is then captured and analyzed to reveal information about the characteristics of the specimen. As an example, a specimen may be illuminated with infrared light having known intensity across a range of wavelengths, and the light transmitted and / or reflected by the specimen can then be captured for compa...

Claims


Application Information

Patent Timeline
Patent Type & Authority Applications(United States)
IPC IPC(8): G01J3/00
CPCG01J3/02G01J3/0289G02B21/367G01J3/2803G01J3/04
Inventor IZZIA, FEDERICOSCHULTING, KATHLEEN J.GRENOV, ALEXANDER
Owner THERMO ELECTRONICS SCI INSTR LLC
Why Eureka
Try Eureka