Interactive Controls and Information Visualization Using Histogram Equalization

a technology of information visualization and interactive controls, applied in the field of computer user interfaces, can solve the problems of difficult task of trying to determine the relationship of a given data set or data, linear interpolation techniques are well known to be susceptible to a variety of quantization errors, and linear mappings are less effective, so as to achieve the effect of convenient manipulation and visualization

Active Publication Date: 2009-01-01
ORACLE INT CORP
View PDF22 Cites 44 Cited by
  • Summary
  • Abstract
  • Description
  • Claims
  • Application Information

AI Technical Summary

Benefits of technology

[0010]A user interface uses histogram equalization to allow easier manipulation and visualization of a data set, especially data sets having values that are not distributed uniformly. The user interface can show values of a data set in different colors or shades of colors, or a combinatio...

Problems solved by technology

Trying to determine a relationship for a given data set or data is generally a difficult task, especially when the data is distributed in a nonuniform or nonlinear way.
However, one should not assume real-world data sets to be distributed uniformly across their range.
Linear interpolation techniques are well known to be susceptible to a variety of quantization errors for data sets that are not distributed uniformly.
Linear mappings are less effective when the data set is distributed nonuniformly.
In the worst case, the ...

Method used


Image

  • Interactive Controls and Information Visualization Using Histogram Equalization
  • Interactive Controls and Information Visualization Using Histogram Equalization
  • Interactive Controls and Information Visualization Using Histogram Equalization

Examples


Embodiment Construction

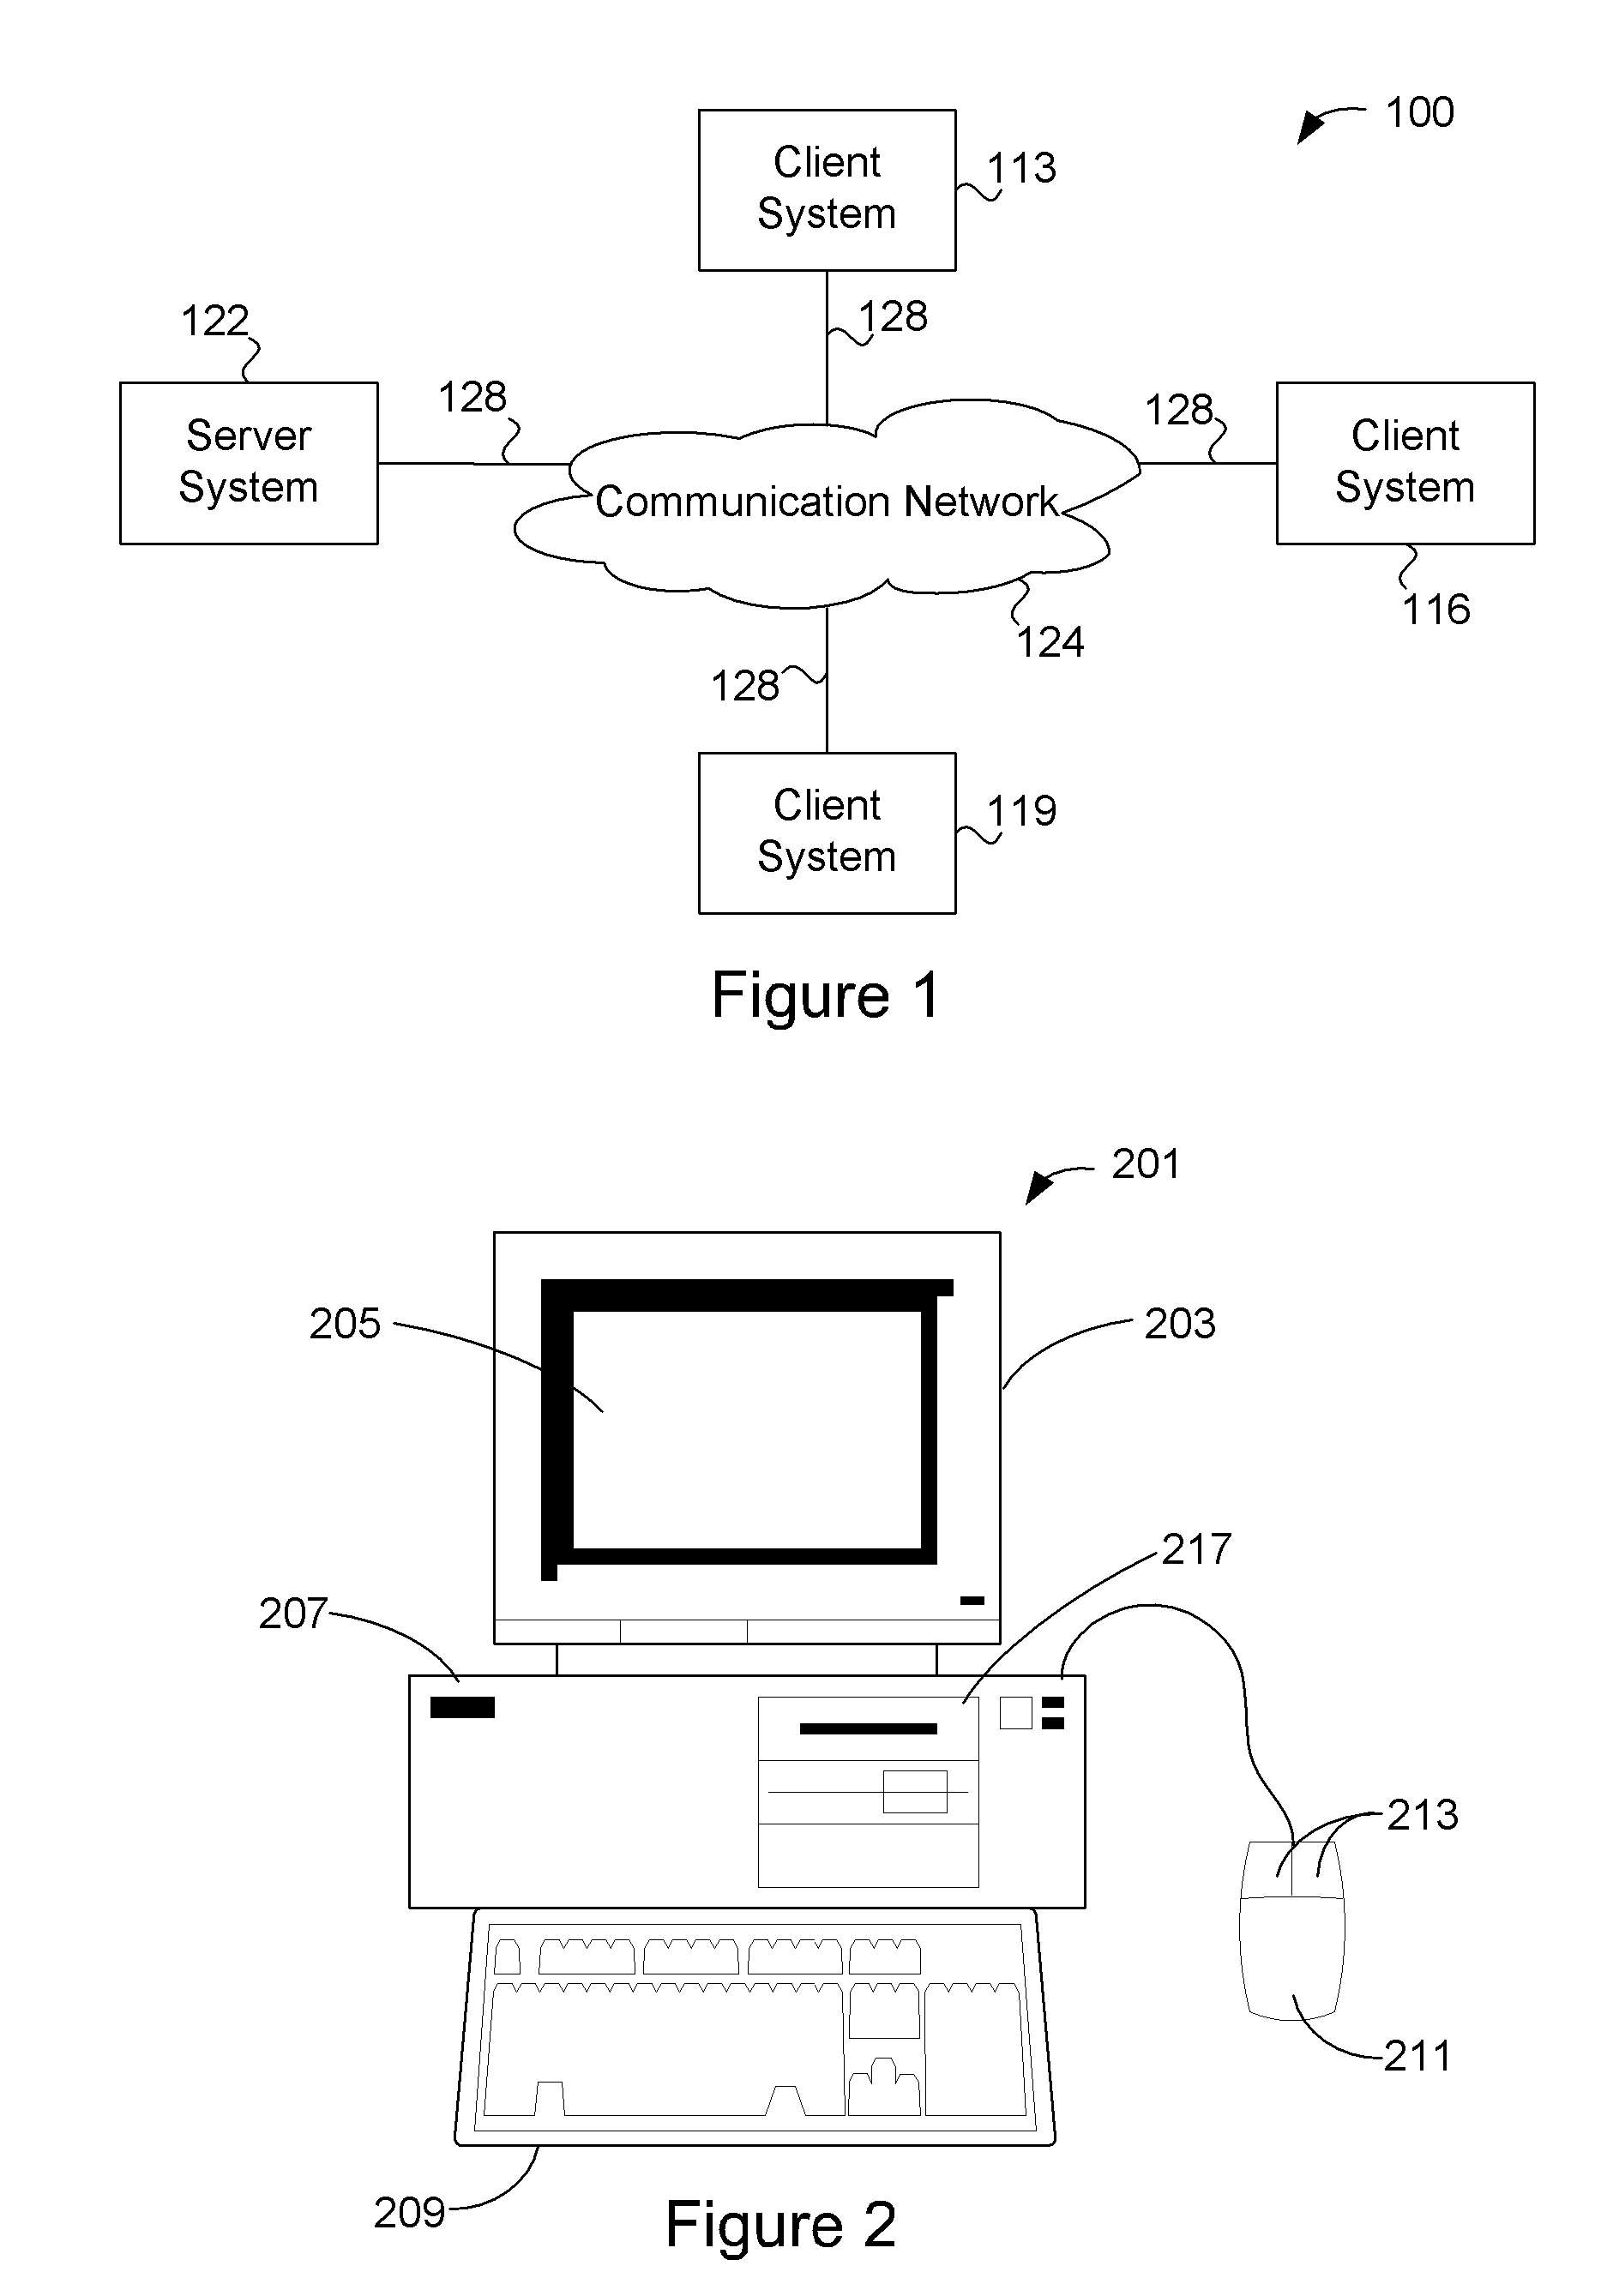
[0039]FIG. 1 is a simplified block diagram of a distributed computer network 100 incorporating an embodiment of the present invention. Computer network 100 includes a number of client systems 113, 116, and 119, and a server system 122 coupled to a communication network 124 via a plurality of communication links 128. Communication network 124 provides a mechanism for allowing the various components of distributed network 100 to communicate and exchange information with each other.

[0040]Communication network 124 may itself be comprised of many interconnected computer systems and communication links. Communication links 128 may be hardwire links, optical links, satellite or other wireless communications links, wave propagation links, or any other mechanisms for communication of information. Various communication protocols may be used to facilitate communication between the various systems shown in FIG. 1. These communication protocols may include TCP / IP, HTTP protocols, wireless applic...


PUM


Abstract

A user interface uses histogram equalization to allow easier manipulation and visualization of a data set, especially data sets having values that are not distributed uniformly. The user interface can show values of a data set in different colors or shades of colors, or a combination of these, or in grayscale. Additionally, values can also be represented according to a size or area relative to other values. A user may change views of the data by adjusting controls of the interface including slider bars, dials, tool bars, button bars, and others, and combinations of these.

Description

BACKGROUND OF THE INVENTION [0001]This invention relates to the field of computer user interfaces and more specifically, to a user interface providing information visualization with an interactive control to allow a user to alter the visualization as desired.[0002]In this age of information, vast amounts of data are continuously being gathered in many different industries. There are a seemingly endless number of data sources including mobile phone calls, airplane take-offs and landings, computer help desk calls, downloading of movies or music, and many others. It is desirable to analyze the data so that relationships may be determines, so that resources may be more effectively allocated and customers and users can be better served.[0003]Trying to determine a relationship for a given data set or data is generally a difficult task, especially when the data is distributed in a nonuniform or nonlinear way. Many existing interactive systems for helping people understand or manipulate dat...

Claims


Application Information

Patent Timeline
IPC IPC(8): G06T11/20
CPCG06T5/009G06T5/40G06F9/44G06T2207/10024G06F3/048G06T11/60
Inventor HELFMAN, JONATHAN
Owner ORACLE INT CORP
Why Eureka
Try Eureka