

Stress condition logging in utility meter
- Summary
- Abstract
- Description
- Claims
- Application Information
AI Technical Summary
Benefits of technology
Problems solved by technology
Method used
Image

Examples
Embodiment Construction
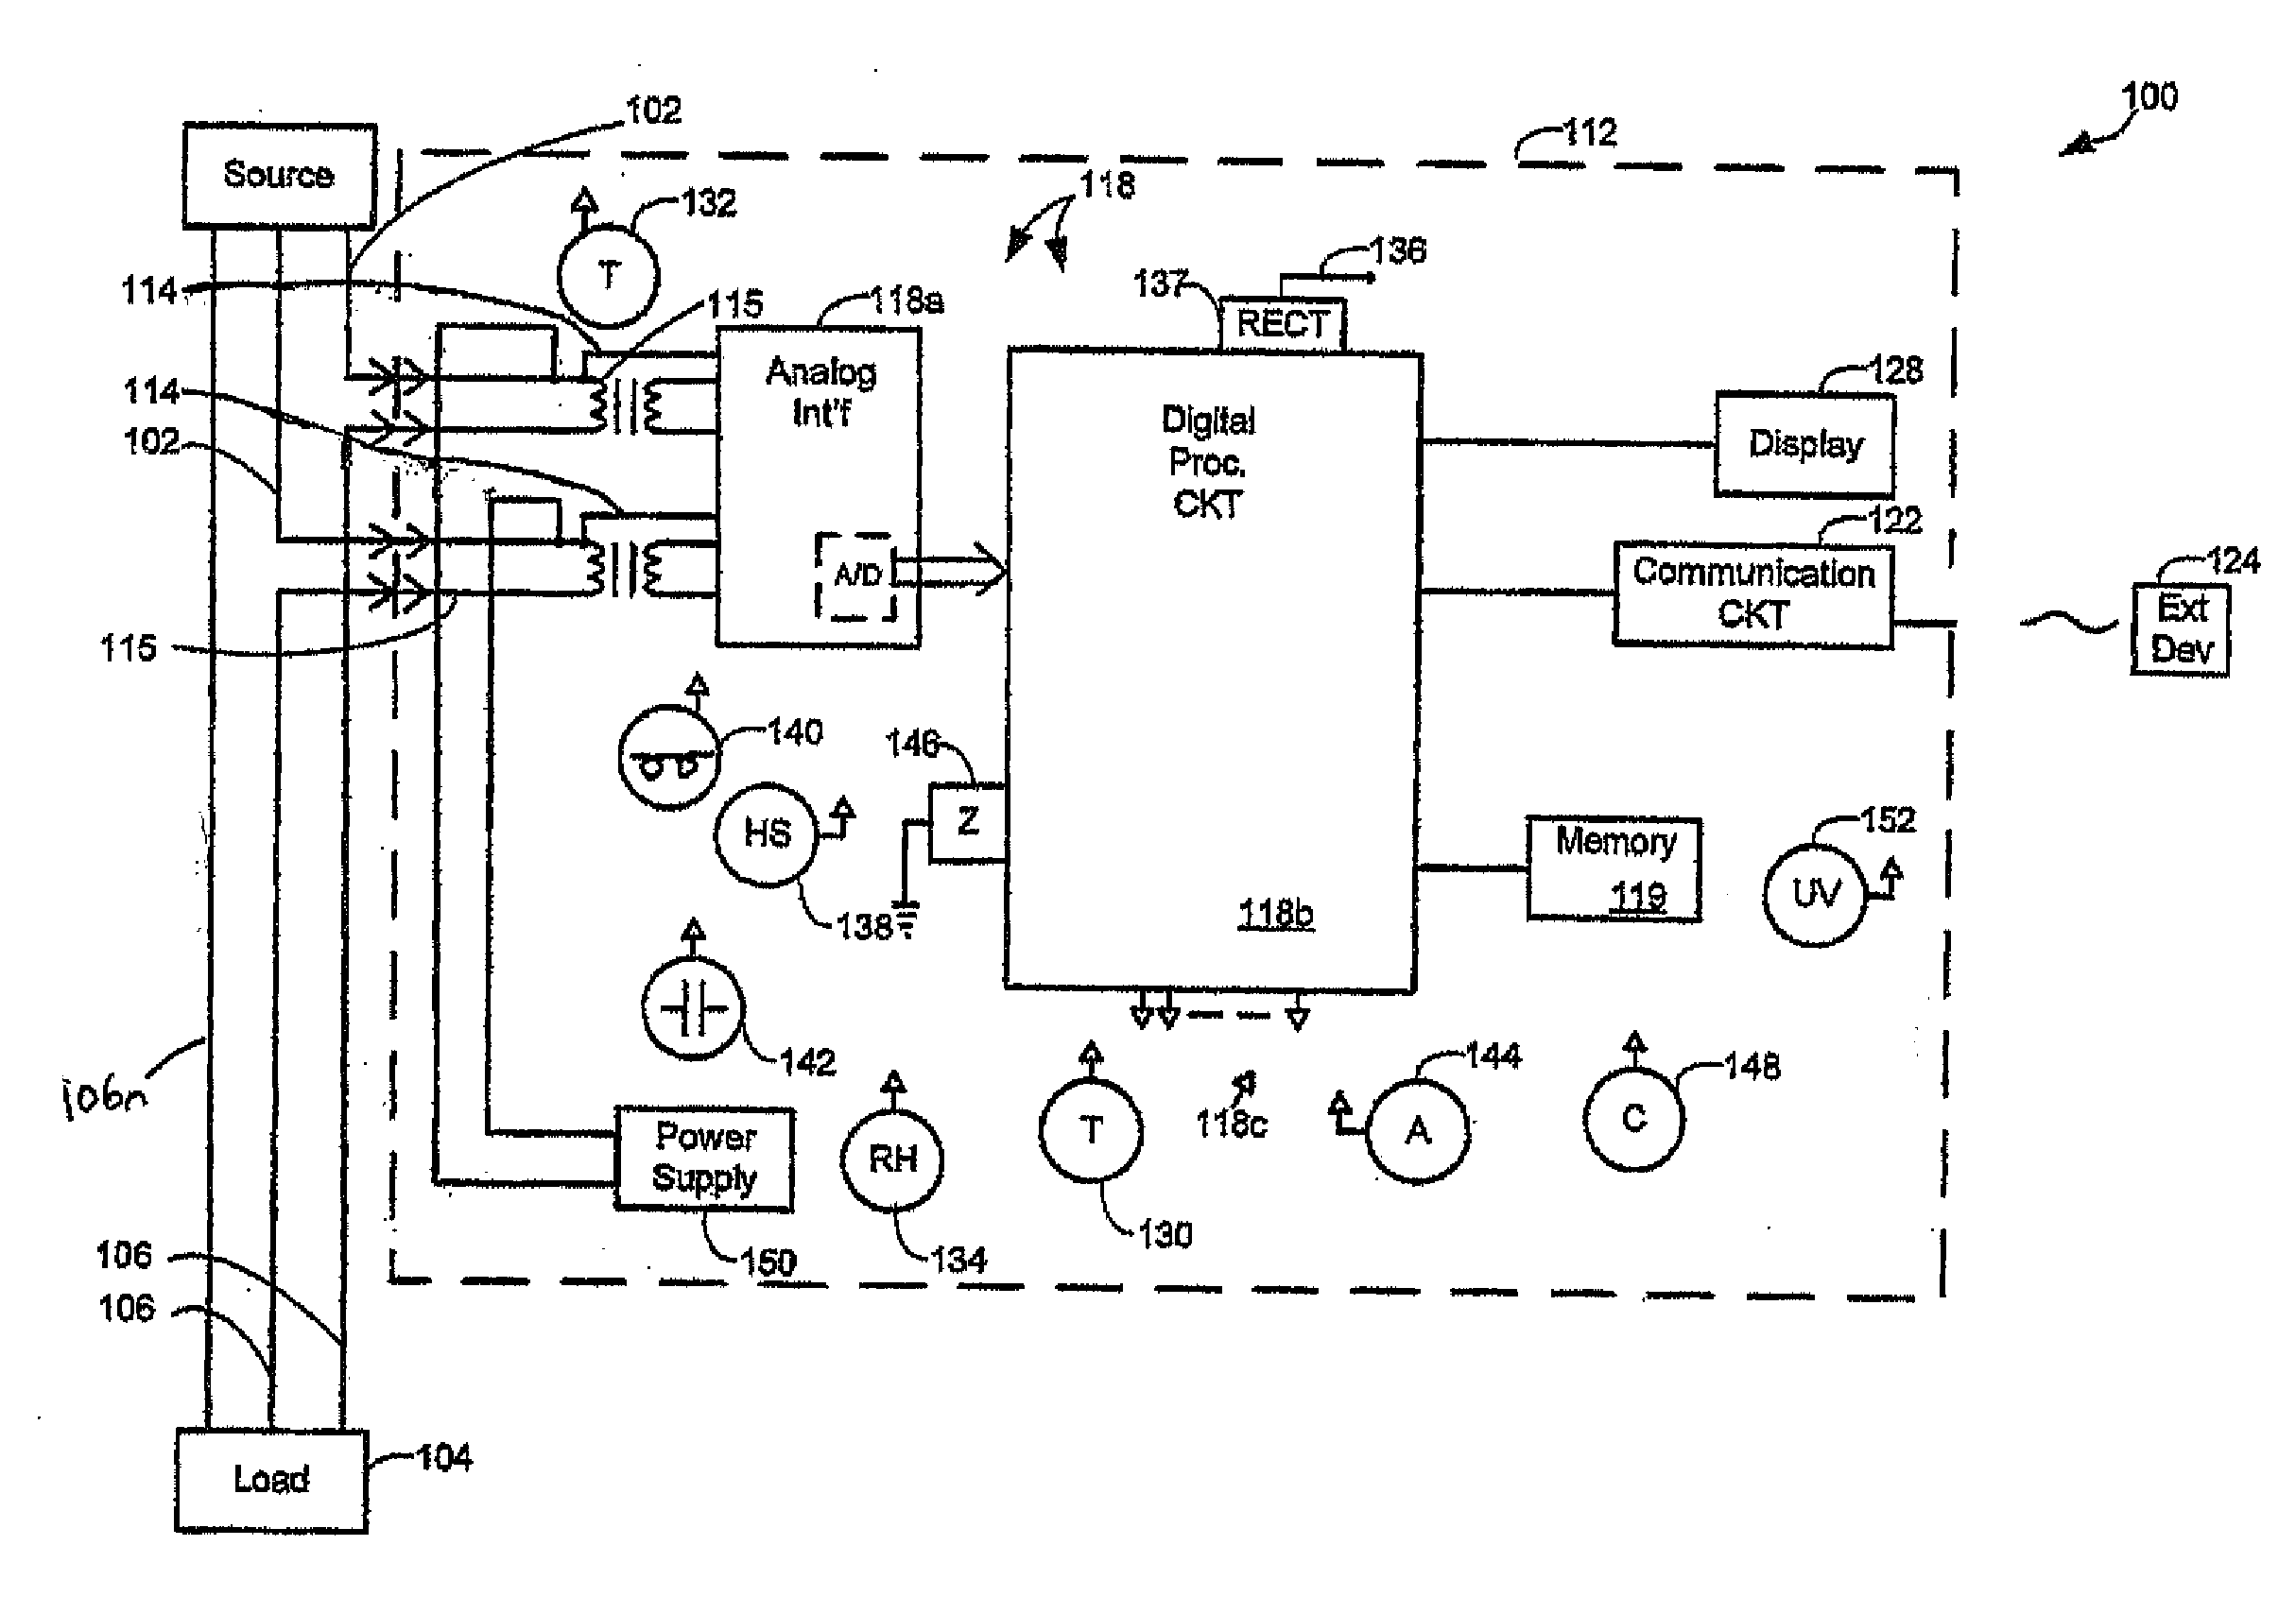
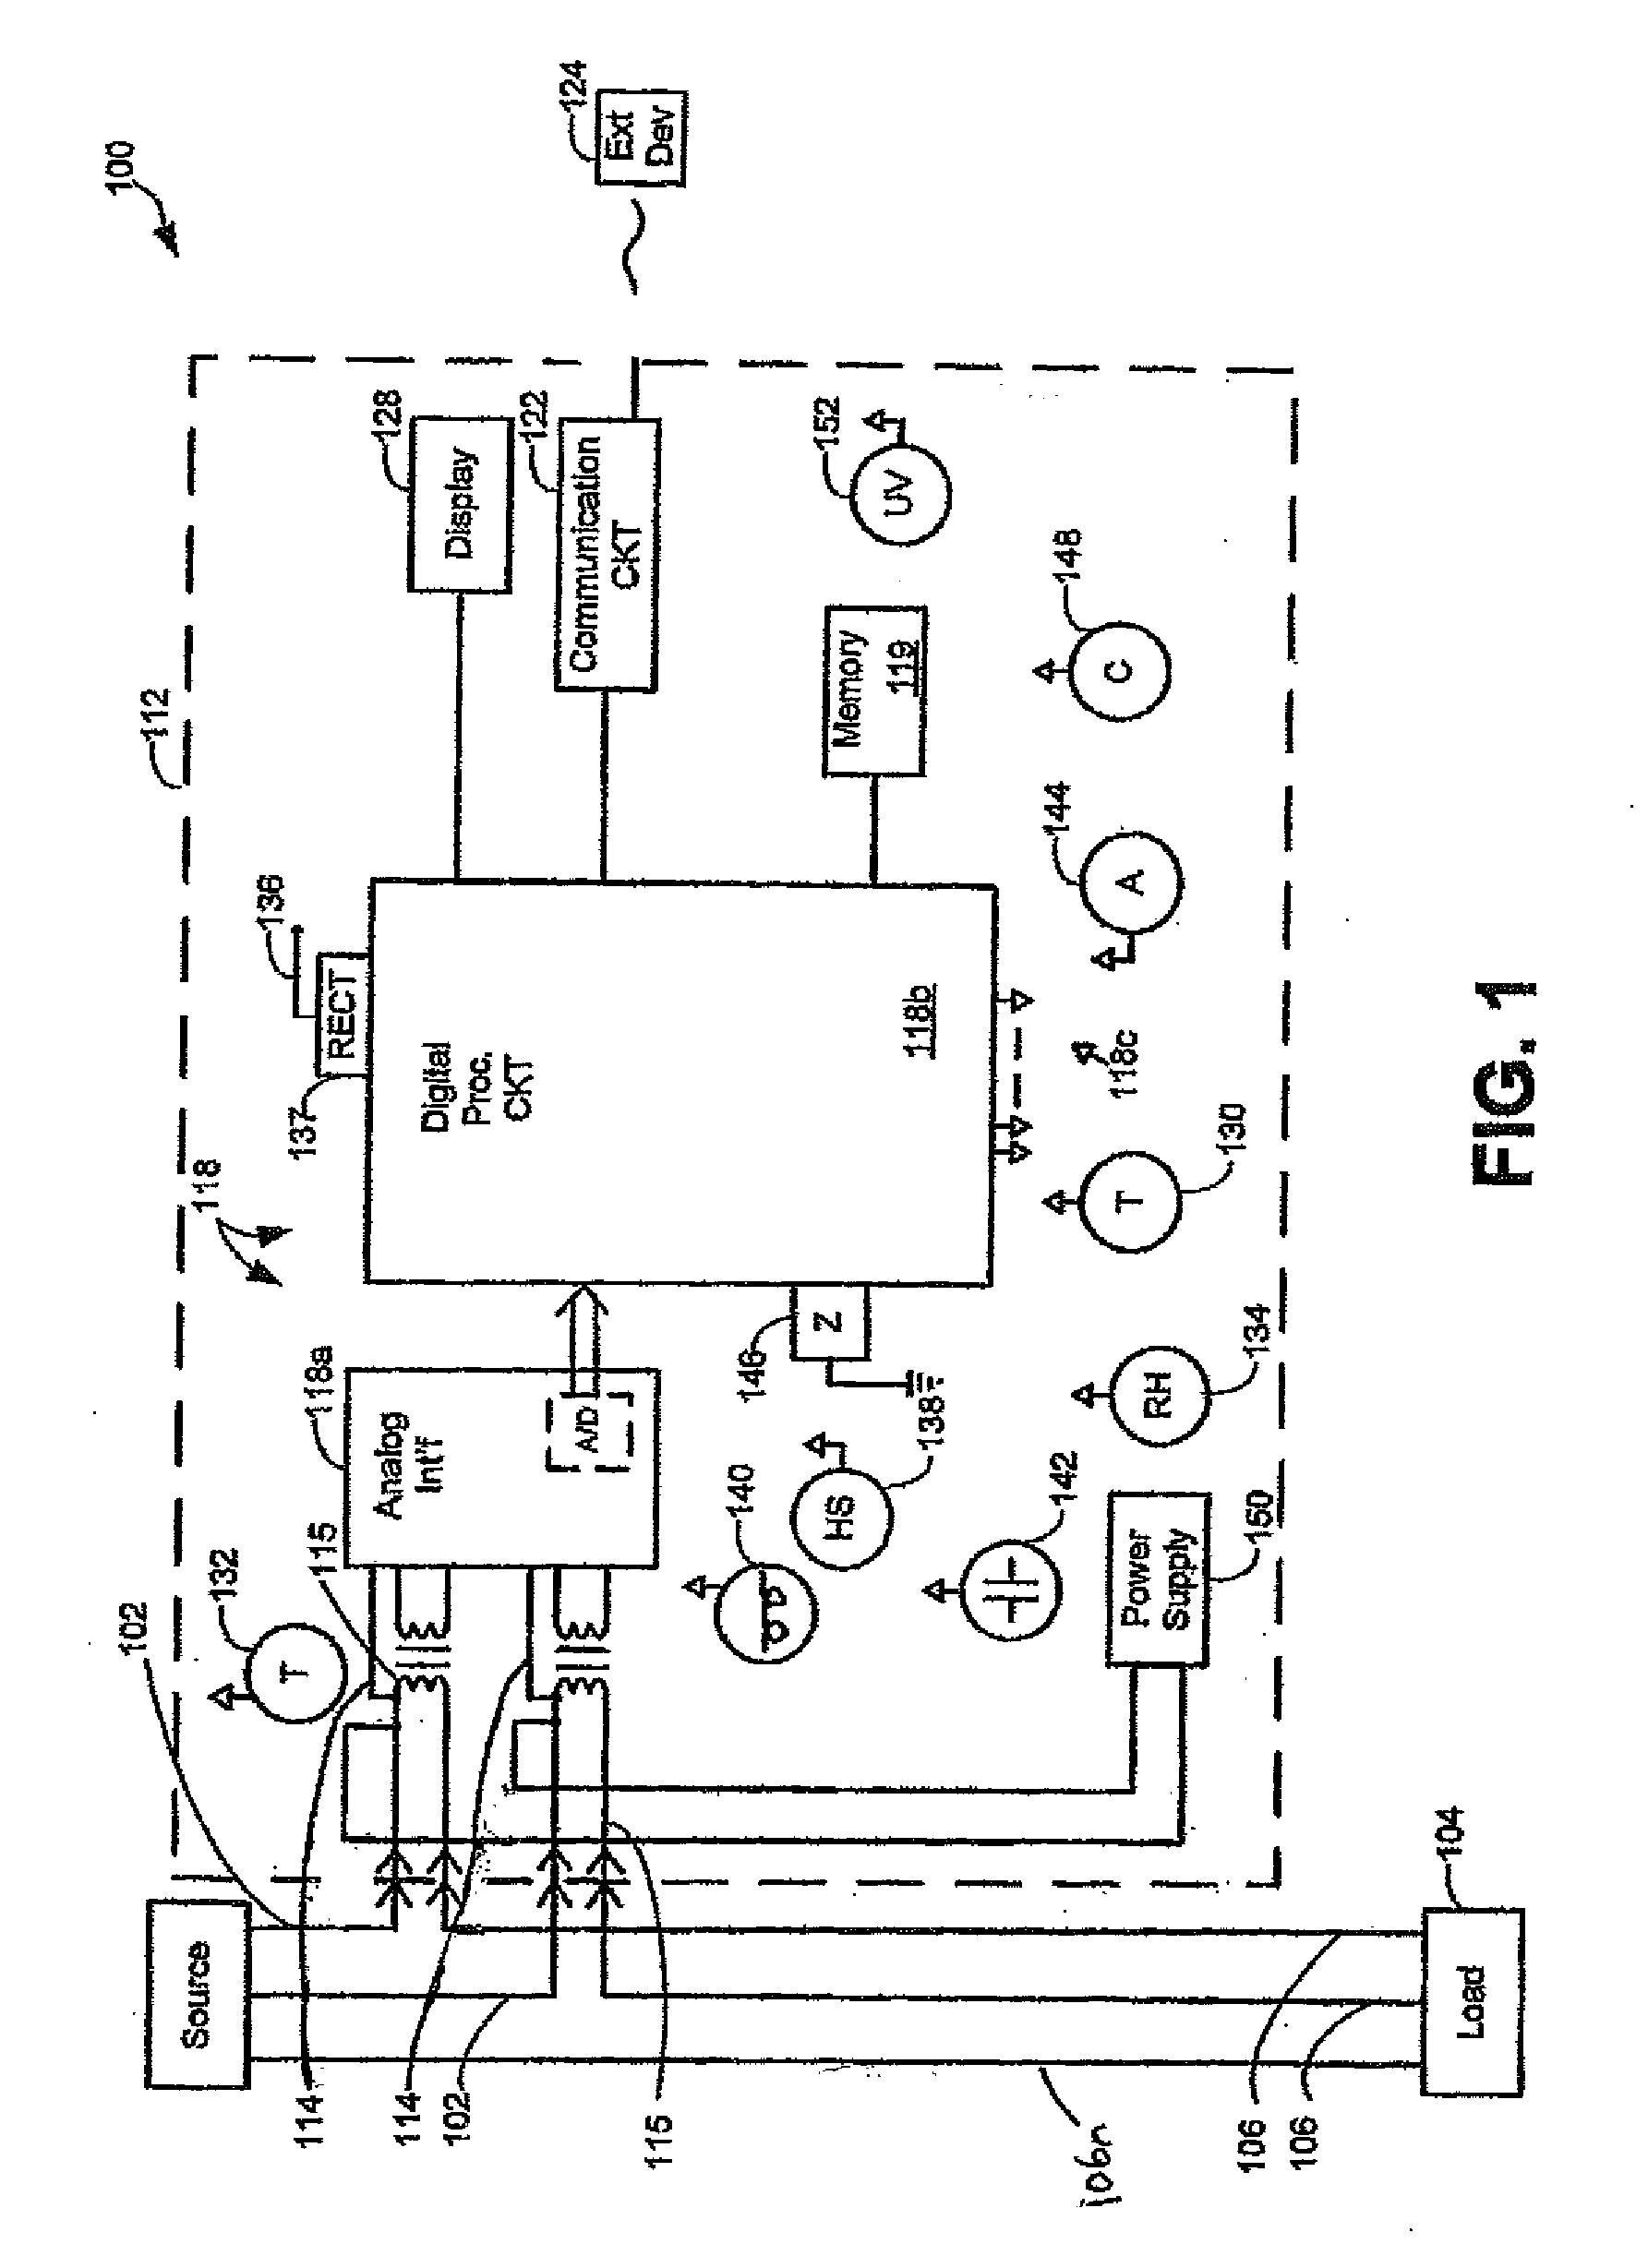
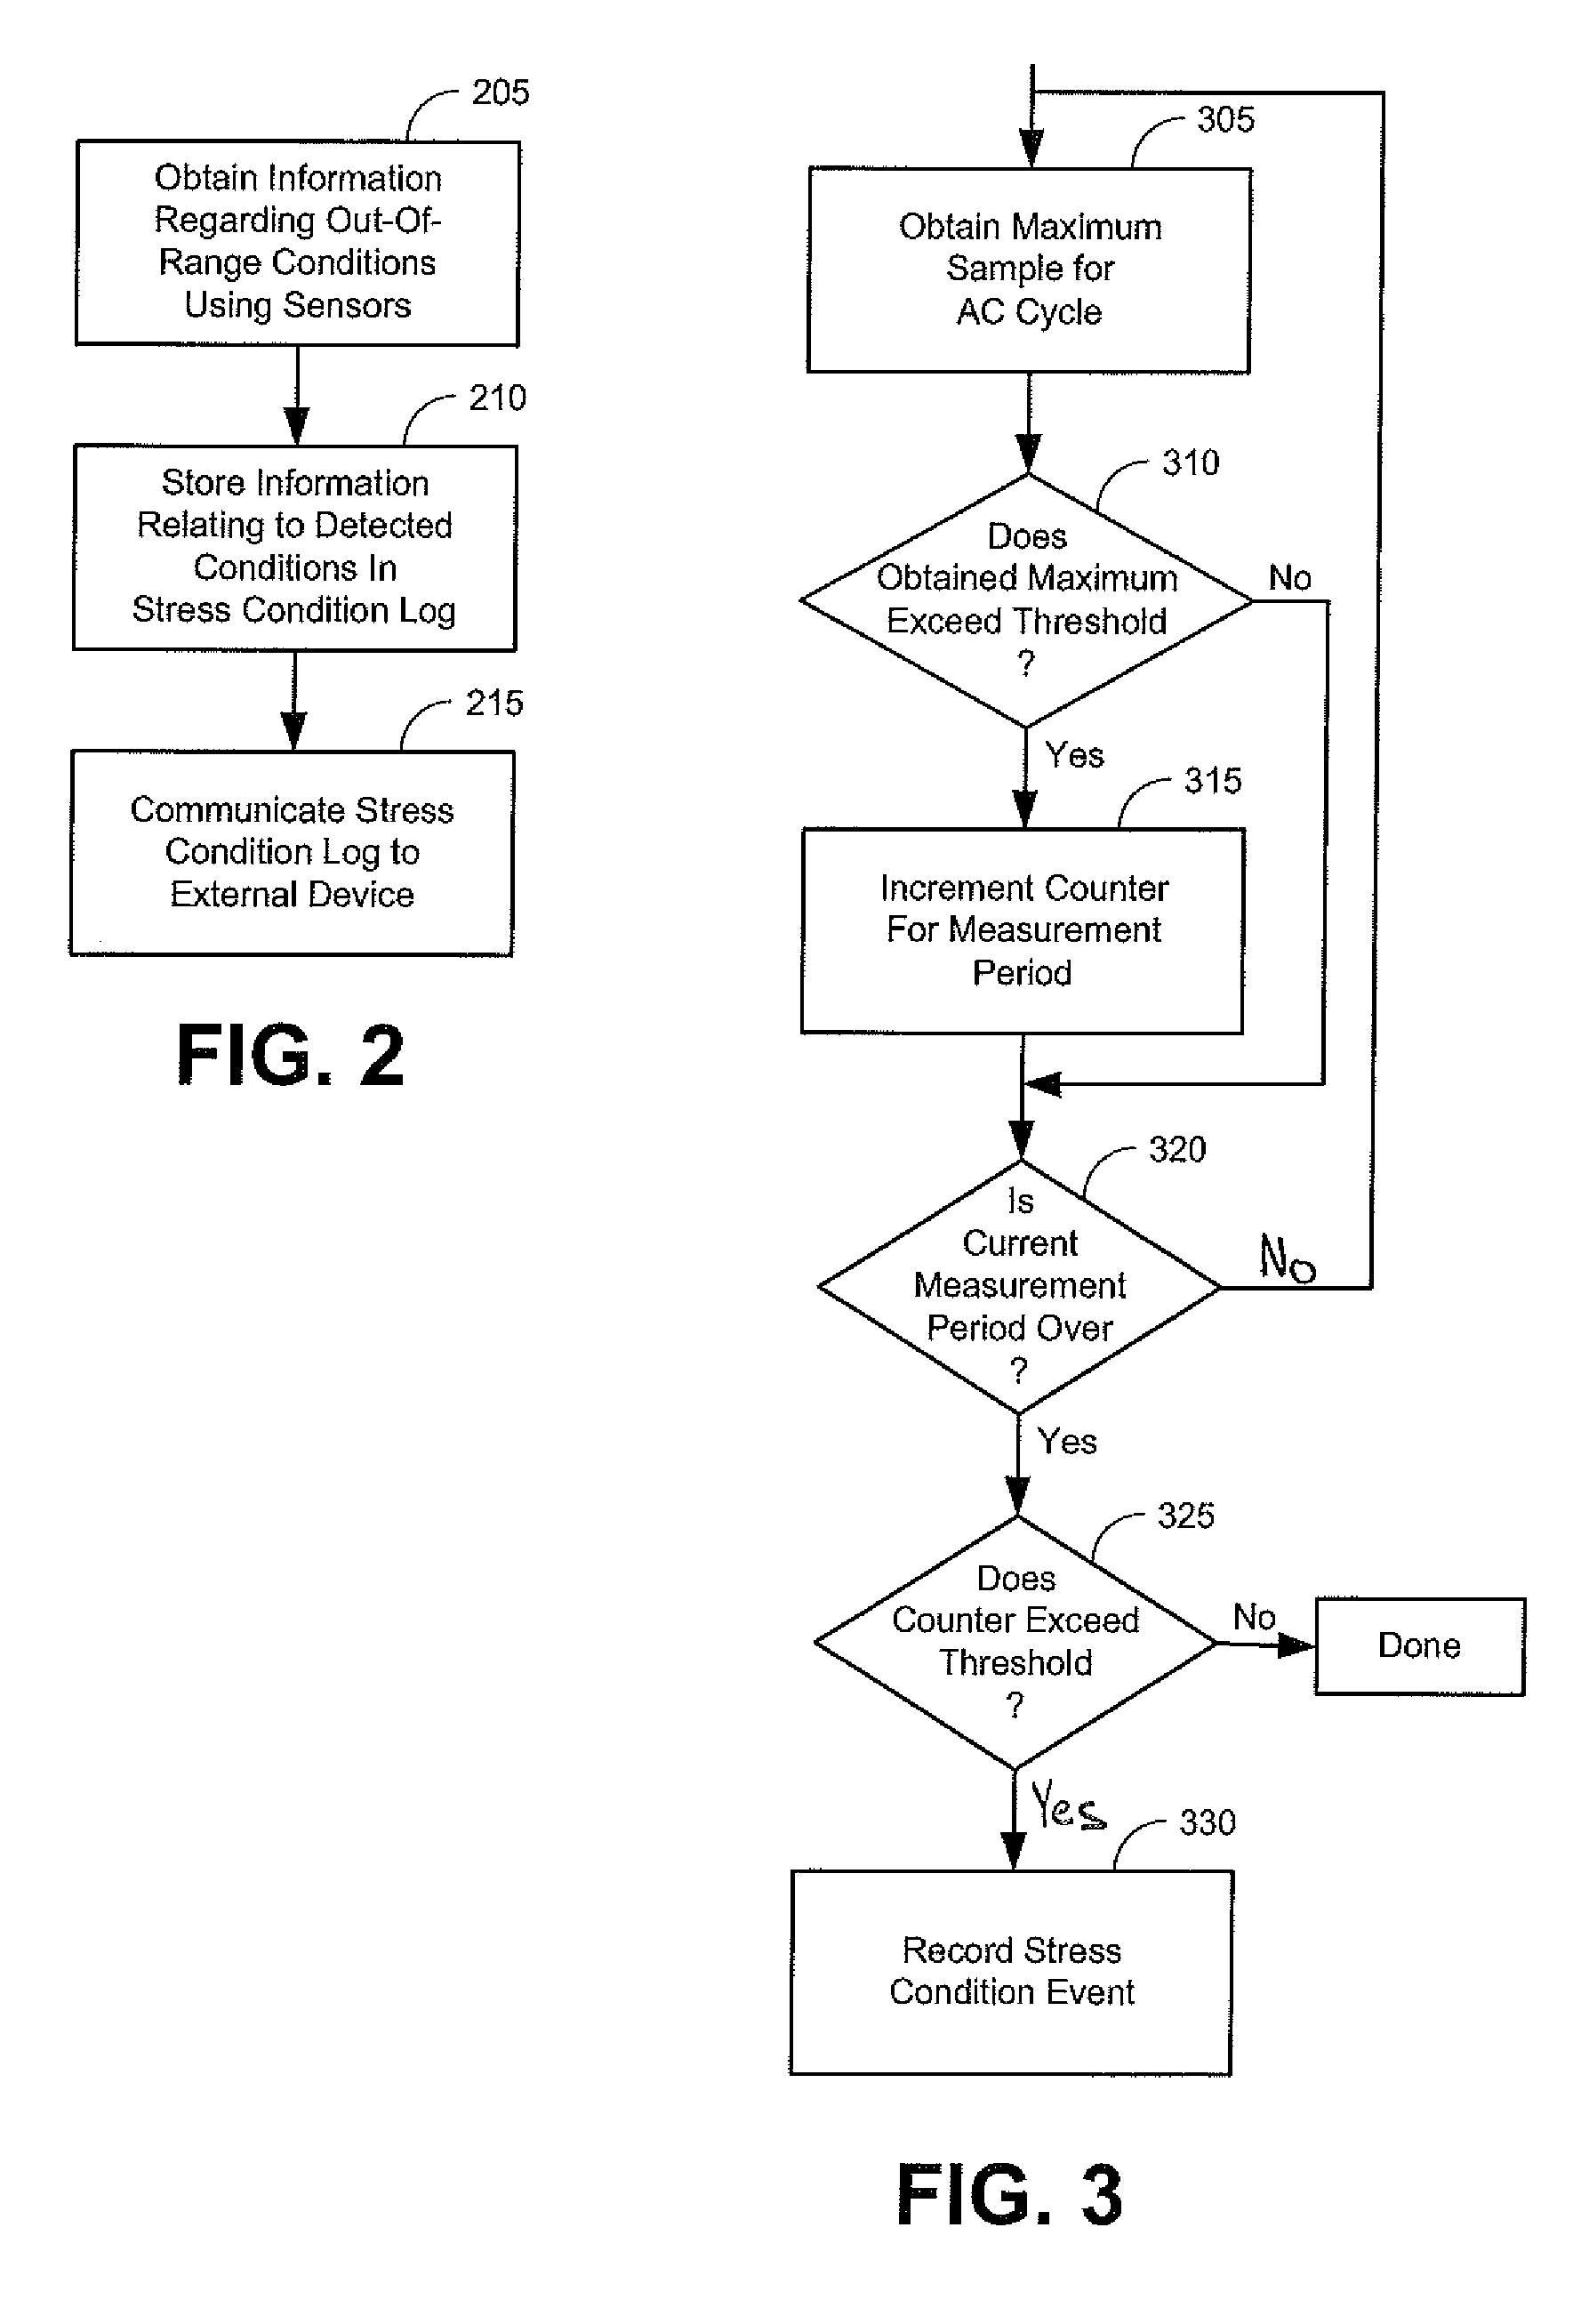
[0017]As will be discussed below, one or more meters in an area are configured to detect and / or log or store stress conditions, wherein the stress condition does itself necessarily amount to a meter malfunction.
[0018]The overstress condition could include, but not be limited to, the following:
[0019]1. Sustained over voltage 60 hertz condition
[0020]2. Surge or spike over voltage condition
[0021]3. Sustained over current 60 hertz condition
[0022]4. Surge or spike over current condition
[0023]5. Temperature outside of specified limits
[0024]6. Current Coil temperature rise outside of limits
[0025]7. Excessive rate of change of temperature (Temperature Shock)
[0026]8. Excessive humidity
[0027]9. Presence of moisture
[0028]10. Excessive conducted or radiated electromagnetic fields
[0029]11. Excessive DC magnetic fields
[0030]12. Excessive power line frequency magnetic fields
[0031]13. Excessive electric fields
[0032]14. Excessive mechanical shock or vibration
[0033]15. Power line frequency outside of...
PUM
 Abstract
Description
Claims
Application Information