
System, method and computer program product for optimized root cause analysis

a root cause analysis and optimization technology, applied in the field of information technology (it) environments, can solve the problems of not being able to perform mathematical correlations at reasonable prices, and not being able to optimize the algorithm by reducing the candidate list to a reasonable size, so as to reduce the overall time needed

Active Publication Date: 2010-02-25
BMC SOFTWARE
View PDF17 Cites 78 Cited by
  • Summary
  • Abstract
  • Description
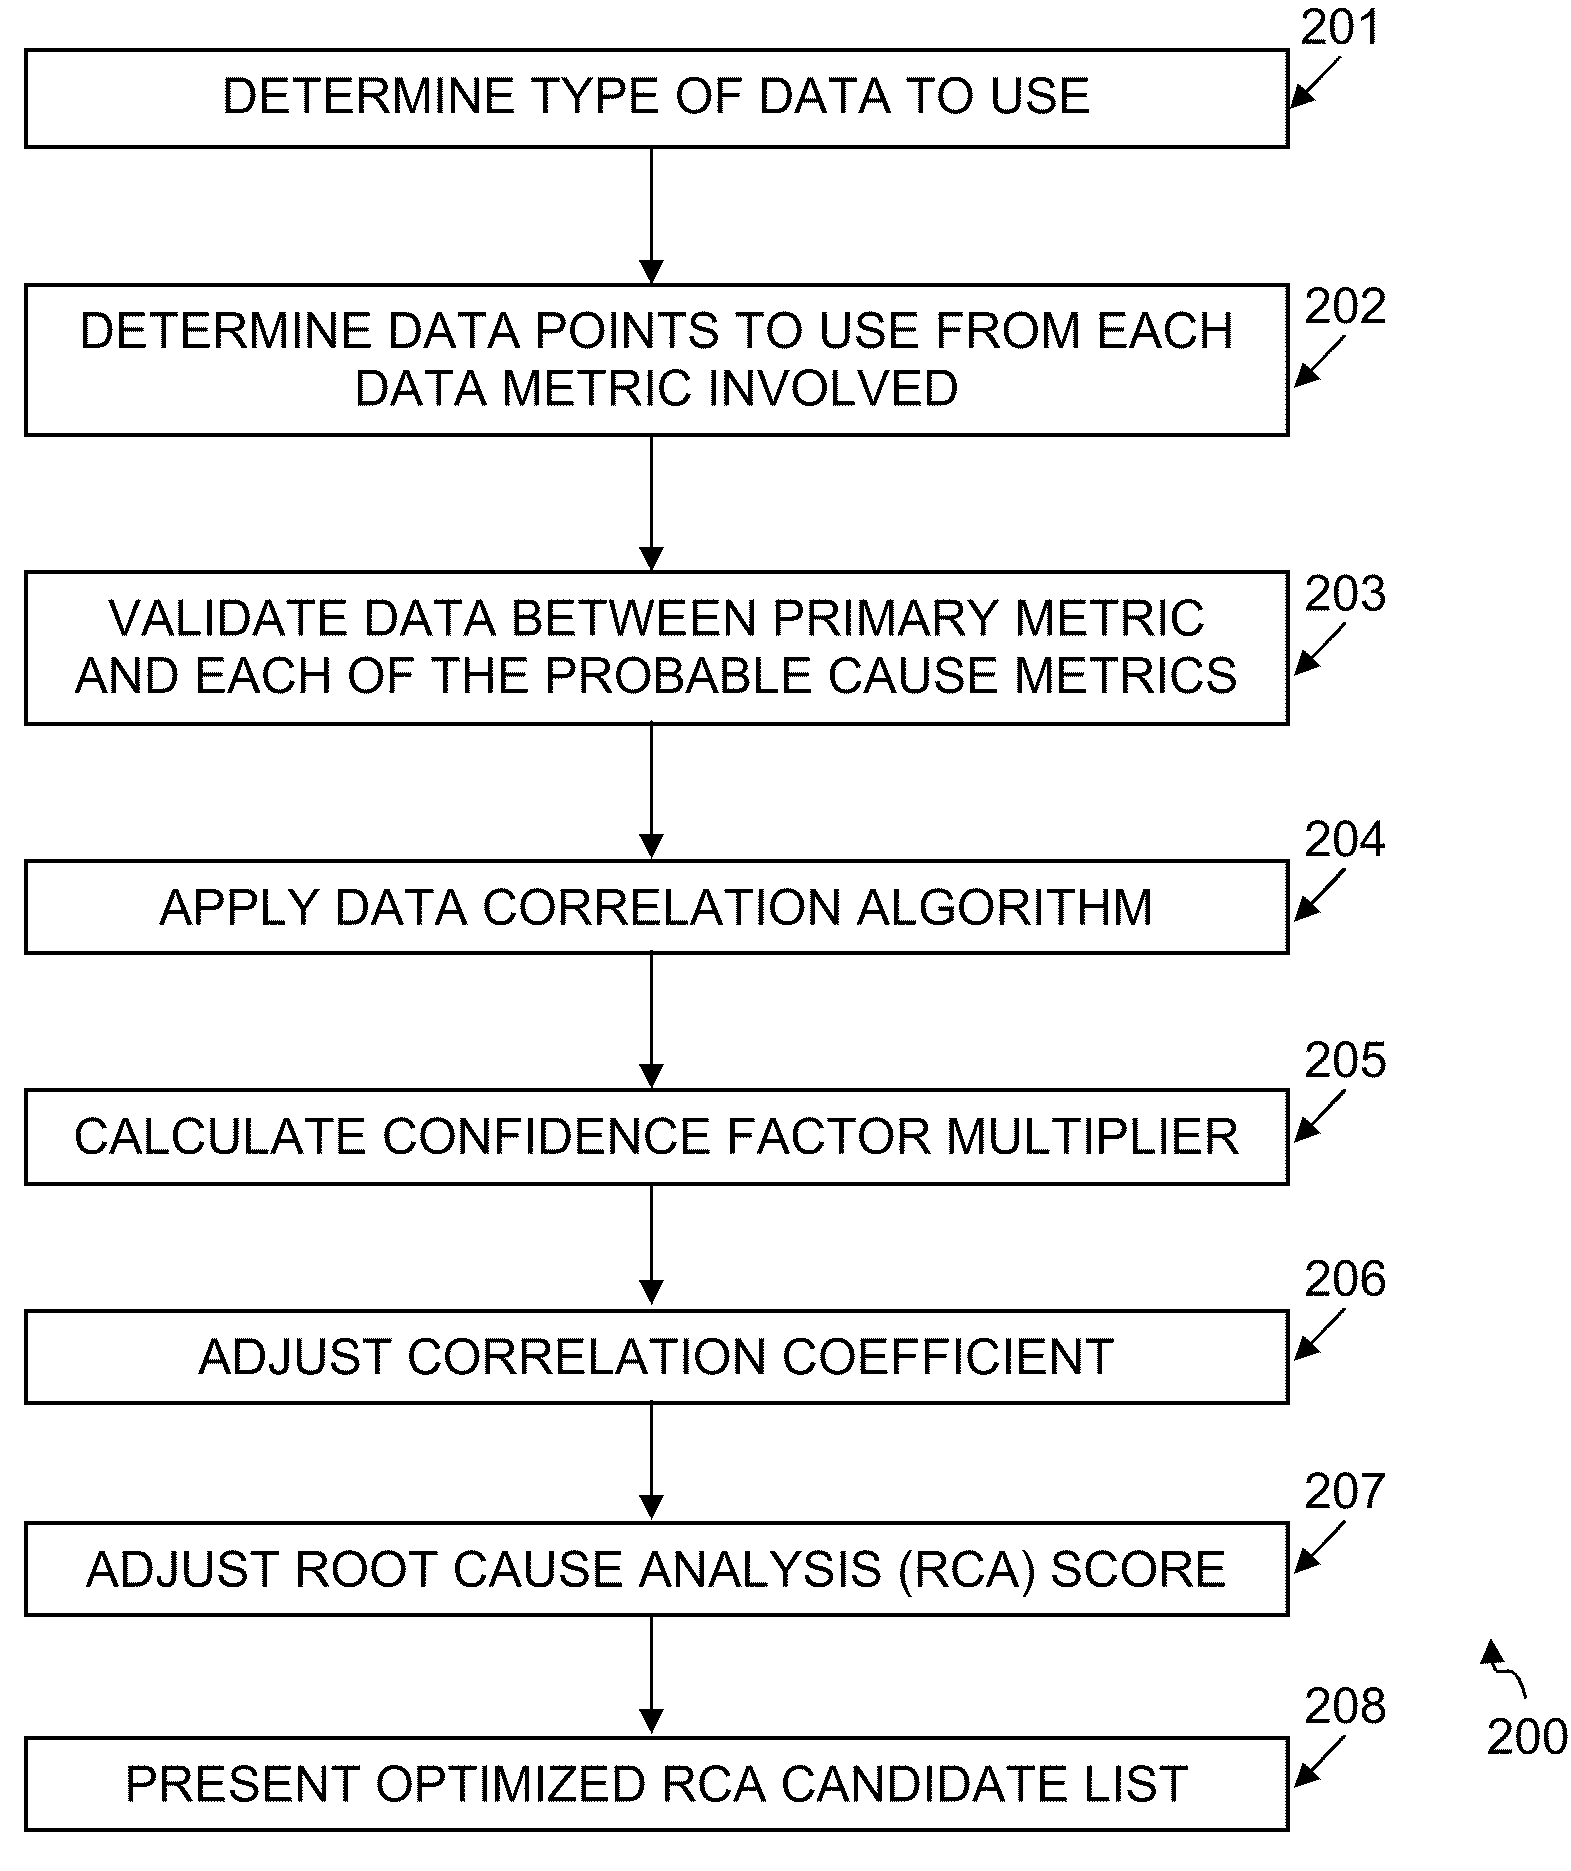
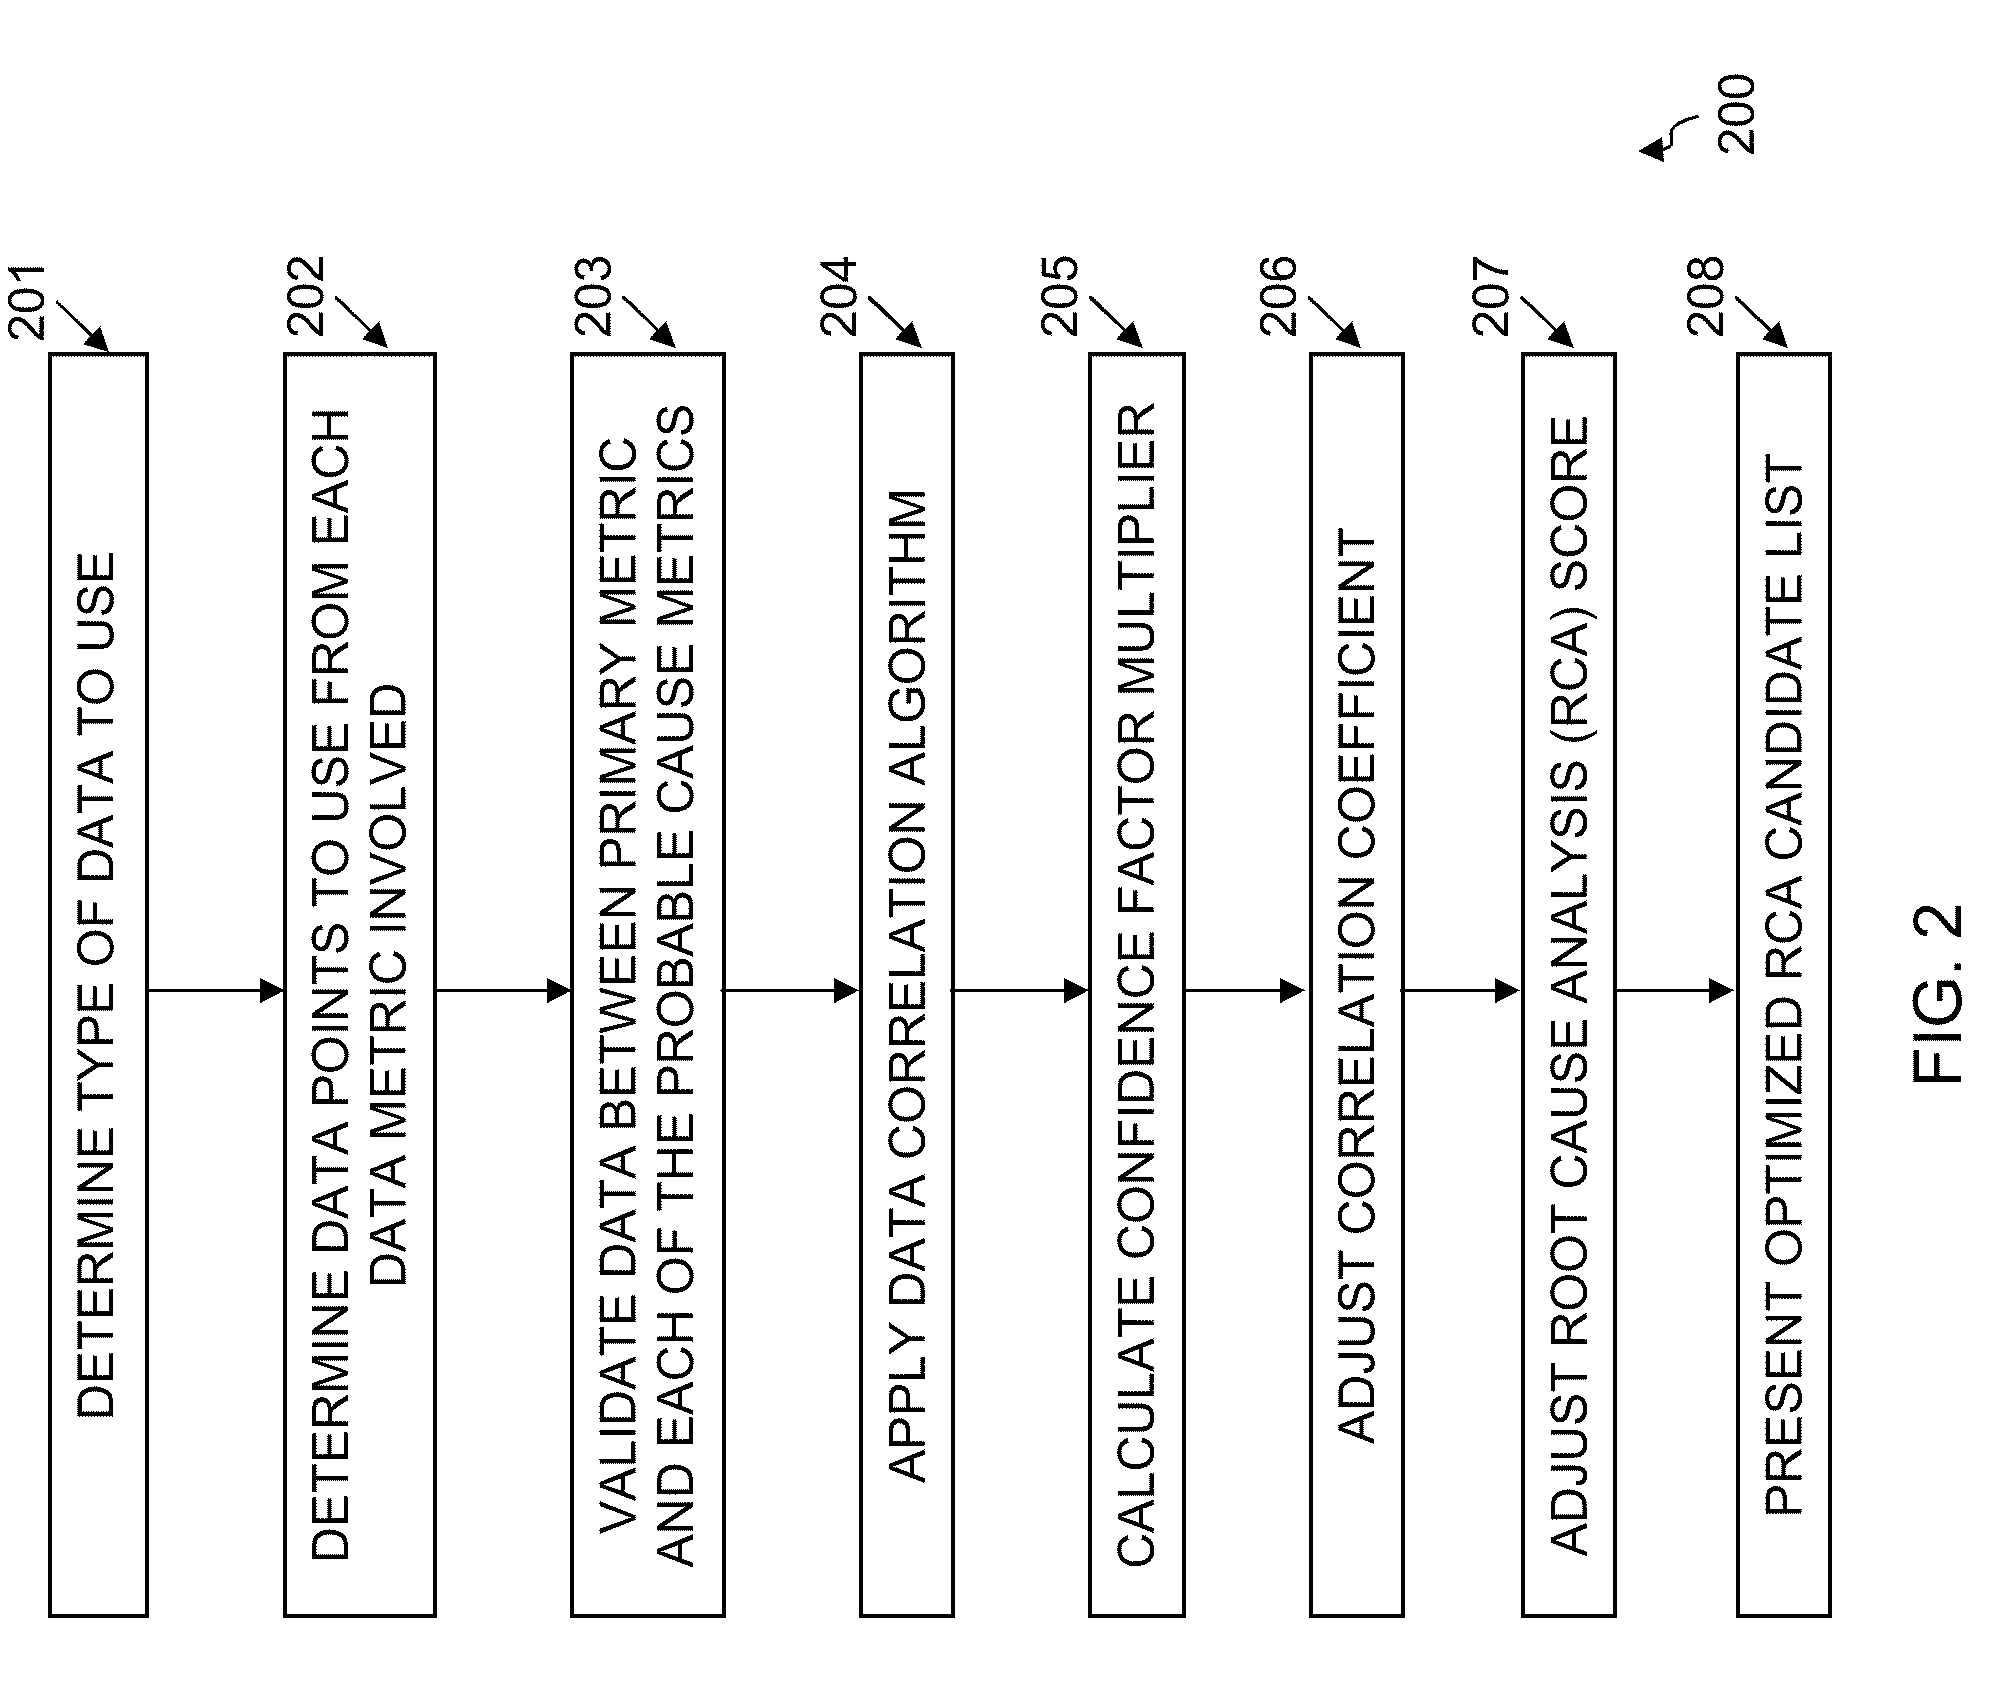
  • Claims
  • Application Information

AI Technical Summary

Benefits of technology

[0008]Embodiments disclosed herein provide a system, method, and computer program product for an optimized root cause analysis that can significantly reduce the overall time needed to isolate the root cause or causes of service degradation in an IT environment. Some embodiments provide prioritization which can be useful in large enterprises in performing root cause analysis.
[0009]In some embodiments, a data correlation algorithm is applied to an abnormality detection algorithm. This avoids having to apply the data correlation algorithm against all the other metrics being collected and reduces the comparisons to a reasonable amount. In some embodiments, the data correlation algorithm is a Pearson product-moment correlation coefficient. Other suitable linear correlation algorithms may also be used. The data being collected for the primary alarm metric and the data being collected for the candidate list of abnormal metrics is compared using the data correlation algorithm. This allows the degree of correlation to be calculated and consequently allows the root cause candidate list of abnormal metrics to be ranked and ordered.
[0010]Applying the data correlation algorithm to the abnormality detection algorithm produces a much more meaningful and practical list for the operator to work off of when trying to isolate the root cause on the service degradation. Without this step, a list of a hundred or more potentially abnormal root cause candidates may be shown to the user without any mathematical consideration of the correlation. With this new approach, the top abnormal events listed in the candidate list are guaranteed to be closely correlated to the primary alarm data and hence most likely to be related to the service degradation. This reduces the time the user needs to spend visually inspecting the data, since for performance degradation the most likely cause of this will now be shown at the top of the candidate list.

Problems solved by technology

Conventional root cause analysis (RCA) products / technologies do not leverage the data points being collected but rather use time coupled with policies / rules to help filter out a root cause candidate list.
This requires creating and maintaining some kind of rules / policies which is not desirable and not scalable for large environments.
Some RCA technologies try to do mathematical correlation on the data between metrics to achieve something similar, but they do not optimize the algorithm by reducing the candidate list to a reasonable size.
This can be important as performing the mathematical correlation can be prohibitively expensive and not scalable without first reducing to a reasonable size.

Method used


Image

  • System, method and computer program product for optimized root cause analysis
  • System, method and computer program product for optimized root cause analysis
  • System, method and computer program product for optimized root cause analysis

Examples


Embodiment Construction

[0019]The disclosure and various features and advantageous details thereof are explained more fully with reference to the exemplary, and therefore non-limiting, embodiments illustrated in the accompanying drawings and detailed in the following description. Descriptions of known programming techniques, computer software, hardware, operating platforms and protocols may be omitted so as not to unnecessarily obscure the disclosure in detail. It should be understood, however, that the detailed description and the specific examples, while indicating the preferred embodiments, are given by way of illustration only and not by way of limitation. Various substitutions, modifications, additions and / or rearrangements within the spirit and / or scope of the underlying inventive concept will become apparent to those skilled in the art from this disclosure.

[0020]Software implementing embodiments disclosed herein may be implemented in suitable computer-executable instructions that may reside on a com...


PUM


Abstract

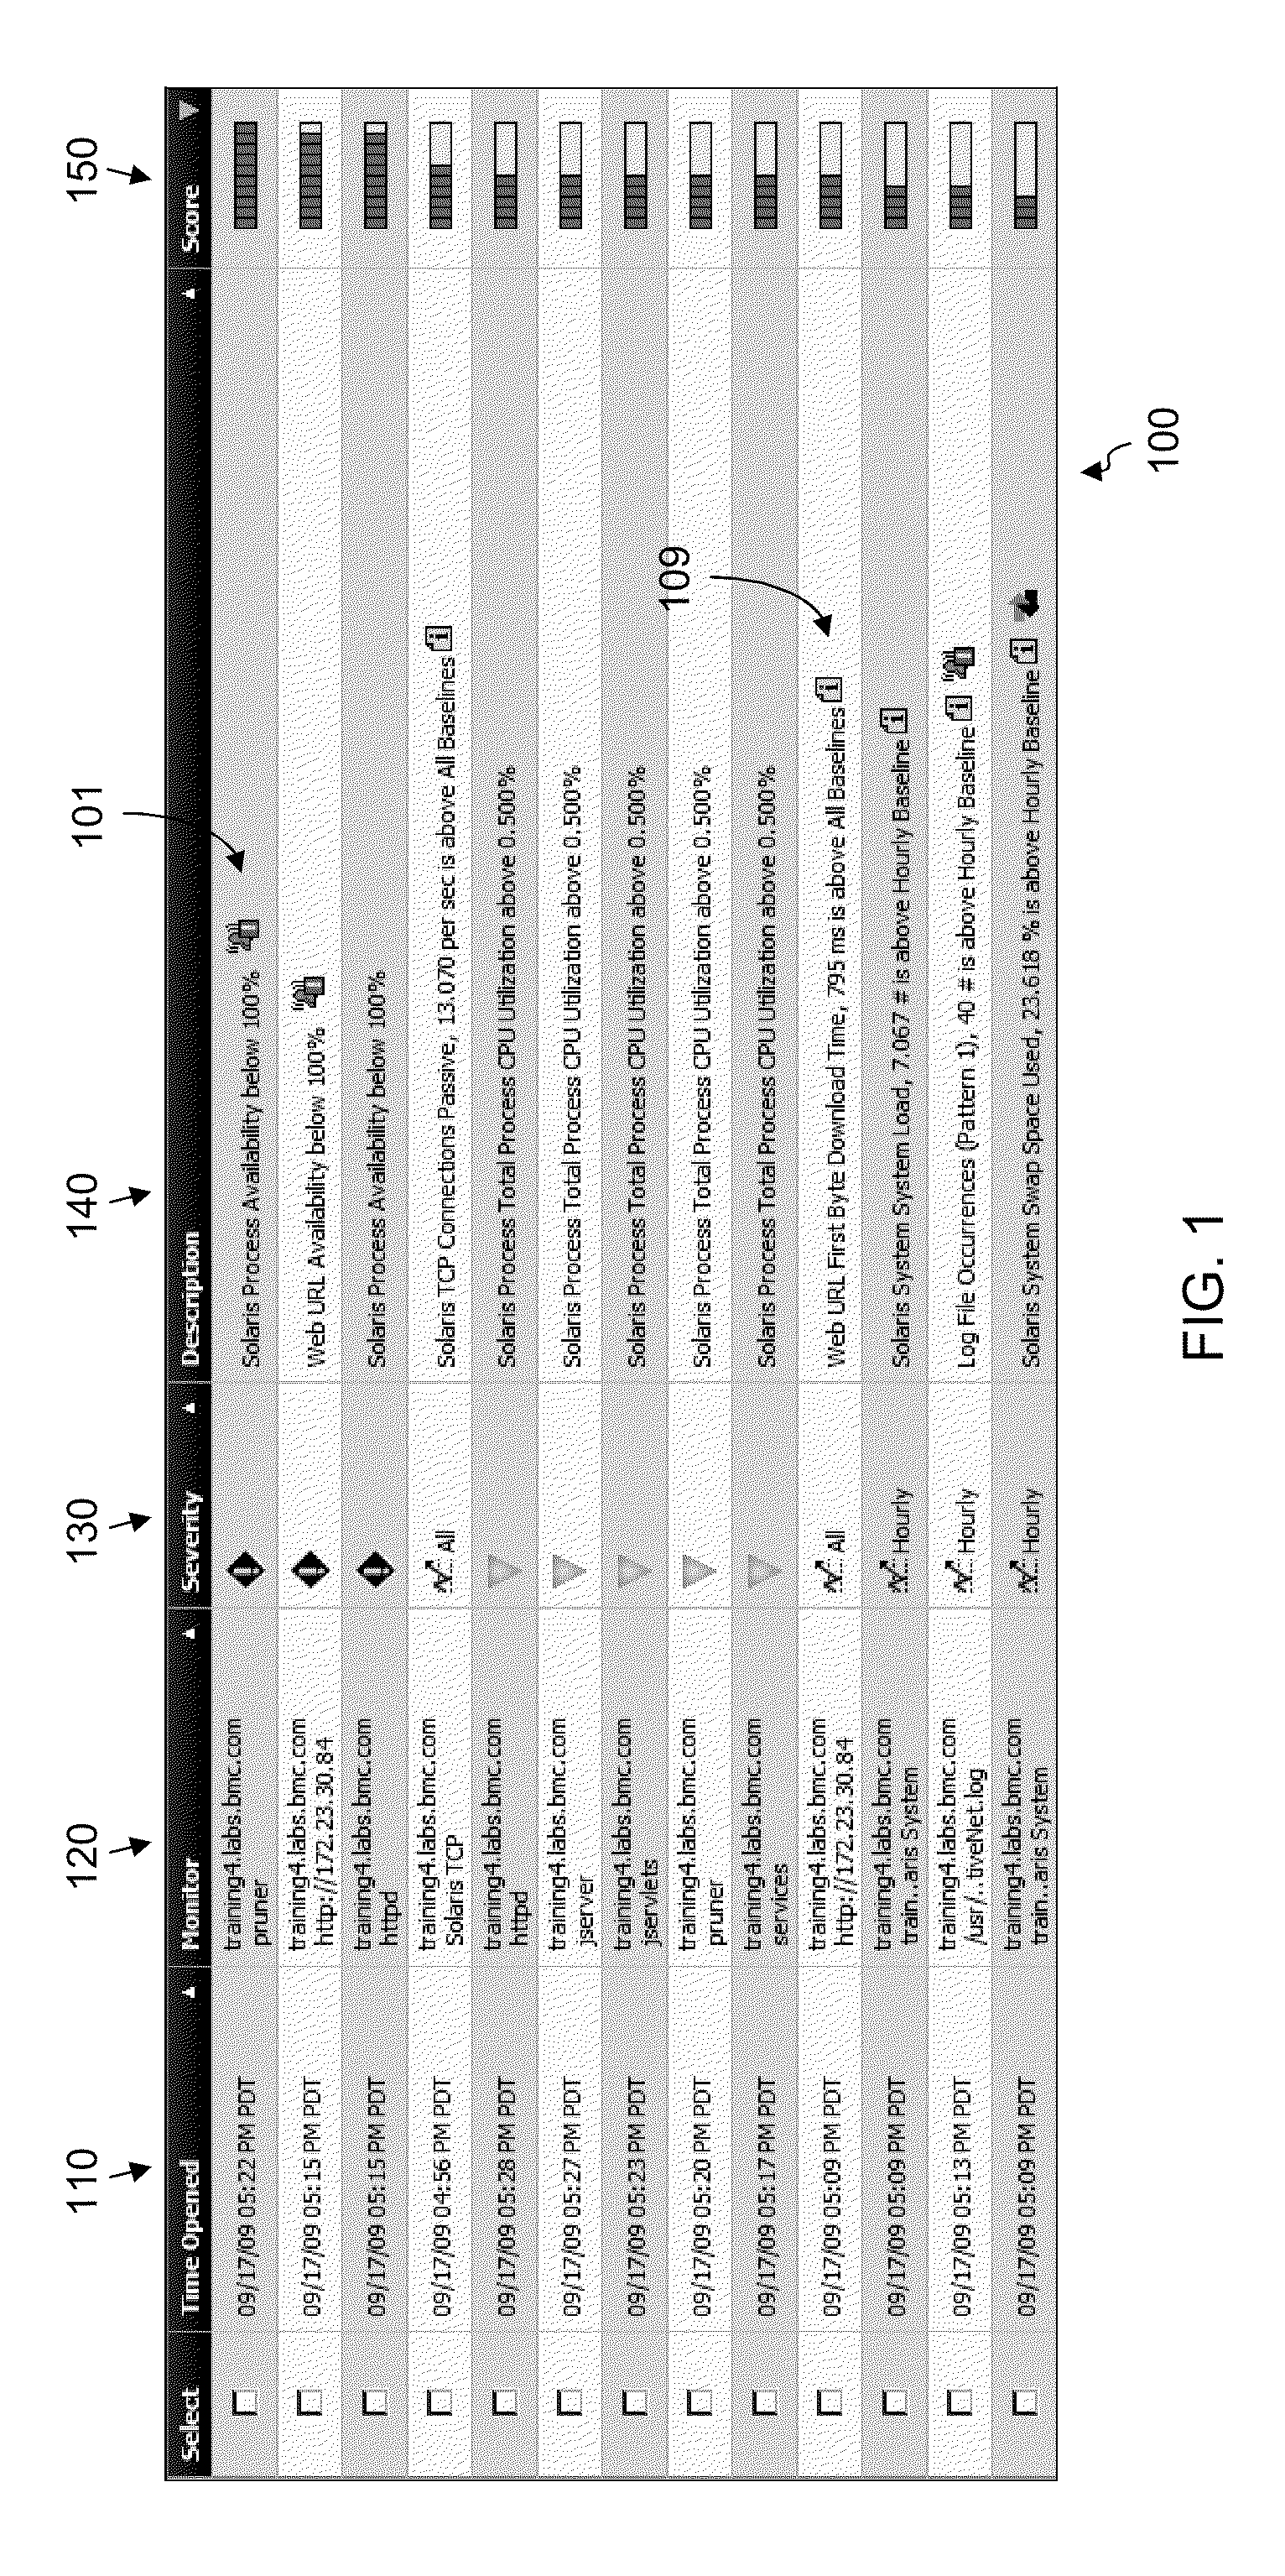
Embodiments disclosed herein can significantly optimize a root cause analysis and substantially reduce the overall time needed to isolate the root cause or causes of service degradation in an IT environment. By building on the ability of an abnormality detection algorithm to correlate an alarm with one or more events, embodiments disclosed herein can apply data correlation to data points collected within a specified time window by data metrics involved in the generation of the alarm and the event(s). The level of correlation between the primary metric and the probable cause metrics may be adjusted using the ratio between theoretical data points and actual points. The final Root Cause Analysis score may be modified depending upon the adjusted correlation value and presented for user review through a user interface.

Description

CROSS-REFERENCE TO RELATED APPLICATIONS[0001]The present application is a continuation-in-part of U.S. patent application Ser. No. 11 / 308,430, filed Mar. 24, 2006, Publication No. 2006 / 0200373, entitled “FACILITATING ROOT CAUSE ANALYSIS FOR ABNORMAL BEHAVIOR OF SYSTEMS IN A NETWORKED ENVIRONMENT,” which is a continuation of U.S. patent application Ser. No. 11 / 161,313, file Jul. 29, 2005, issued as U.S. Pat. No. 7,502,844, entitled “ABNORMALITY INDICATOR OF A DESIRED GROUP OF RESOURCE ELEMENTS,” which relates to co-pending U.S. patent application Ser. No. 10 / 452,134, filed Jun. 3, 2003, entitled, “NETWORK MANAGEMENT SYSTEM TO MONITOR MANAGED ELEMENTS,” and Ser. No. 11 / 160,664, filed Jul. 5, 2005, entitled, “MONITORING SEVERAL DISTRIBUTED RESOURCE ELEMENTS AS A RESOURCE POOL.” The present application claims priority from U.S. Provisional Application No. 61 / 110,289, filed Oct. 31, 2008, entitled “METHOD AND SYSTEM FOR OPTIMIZED SERVICE-IT ROOT CAUSE CORRELATION” and is related to U.S. ...

Claims


Application Information

Patent Timeline
Patent Type & Authority Applications(United States)
IPC IPC(8): G06F11/07
CPCG06F11/0709G06F11/079H04L43/16H04L41/142H04L43/0817H04L41/0631
Inventor SCARPELLI, JOESODEM, SRIDHARLEFAIVE, RONALD ALEXANDER
Owner BMC SOFTWARE
Learn More