
Method for capturing and analyzing test result data

a technology of test results and data, applied in the field of capture, characterization, calculating, analyzing test data, can solve the problems of enormous amount of data that can be harvested, and achieve the effect of reducing the investigation to the significant parameters

Inactive Publication Date: 2010-03-25
BROWN HAROLD LEE +1
View PDF22 Cites 20 Cited by
  • Summary
  • Abstract
  • Description
  • Claims
  • Application Information

AI Technical Summary

Benefits of technology

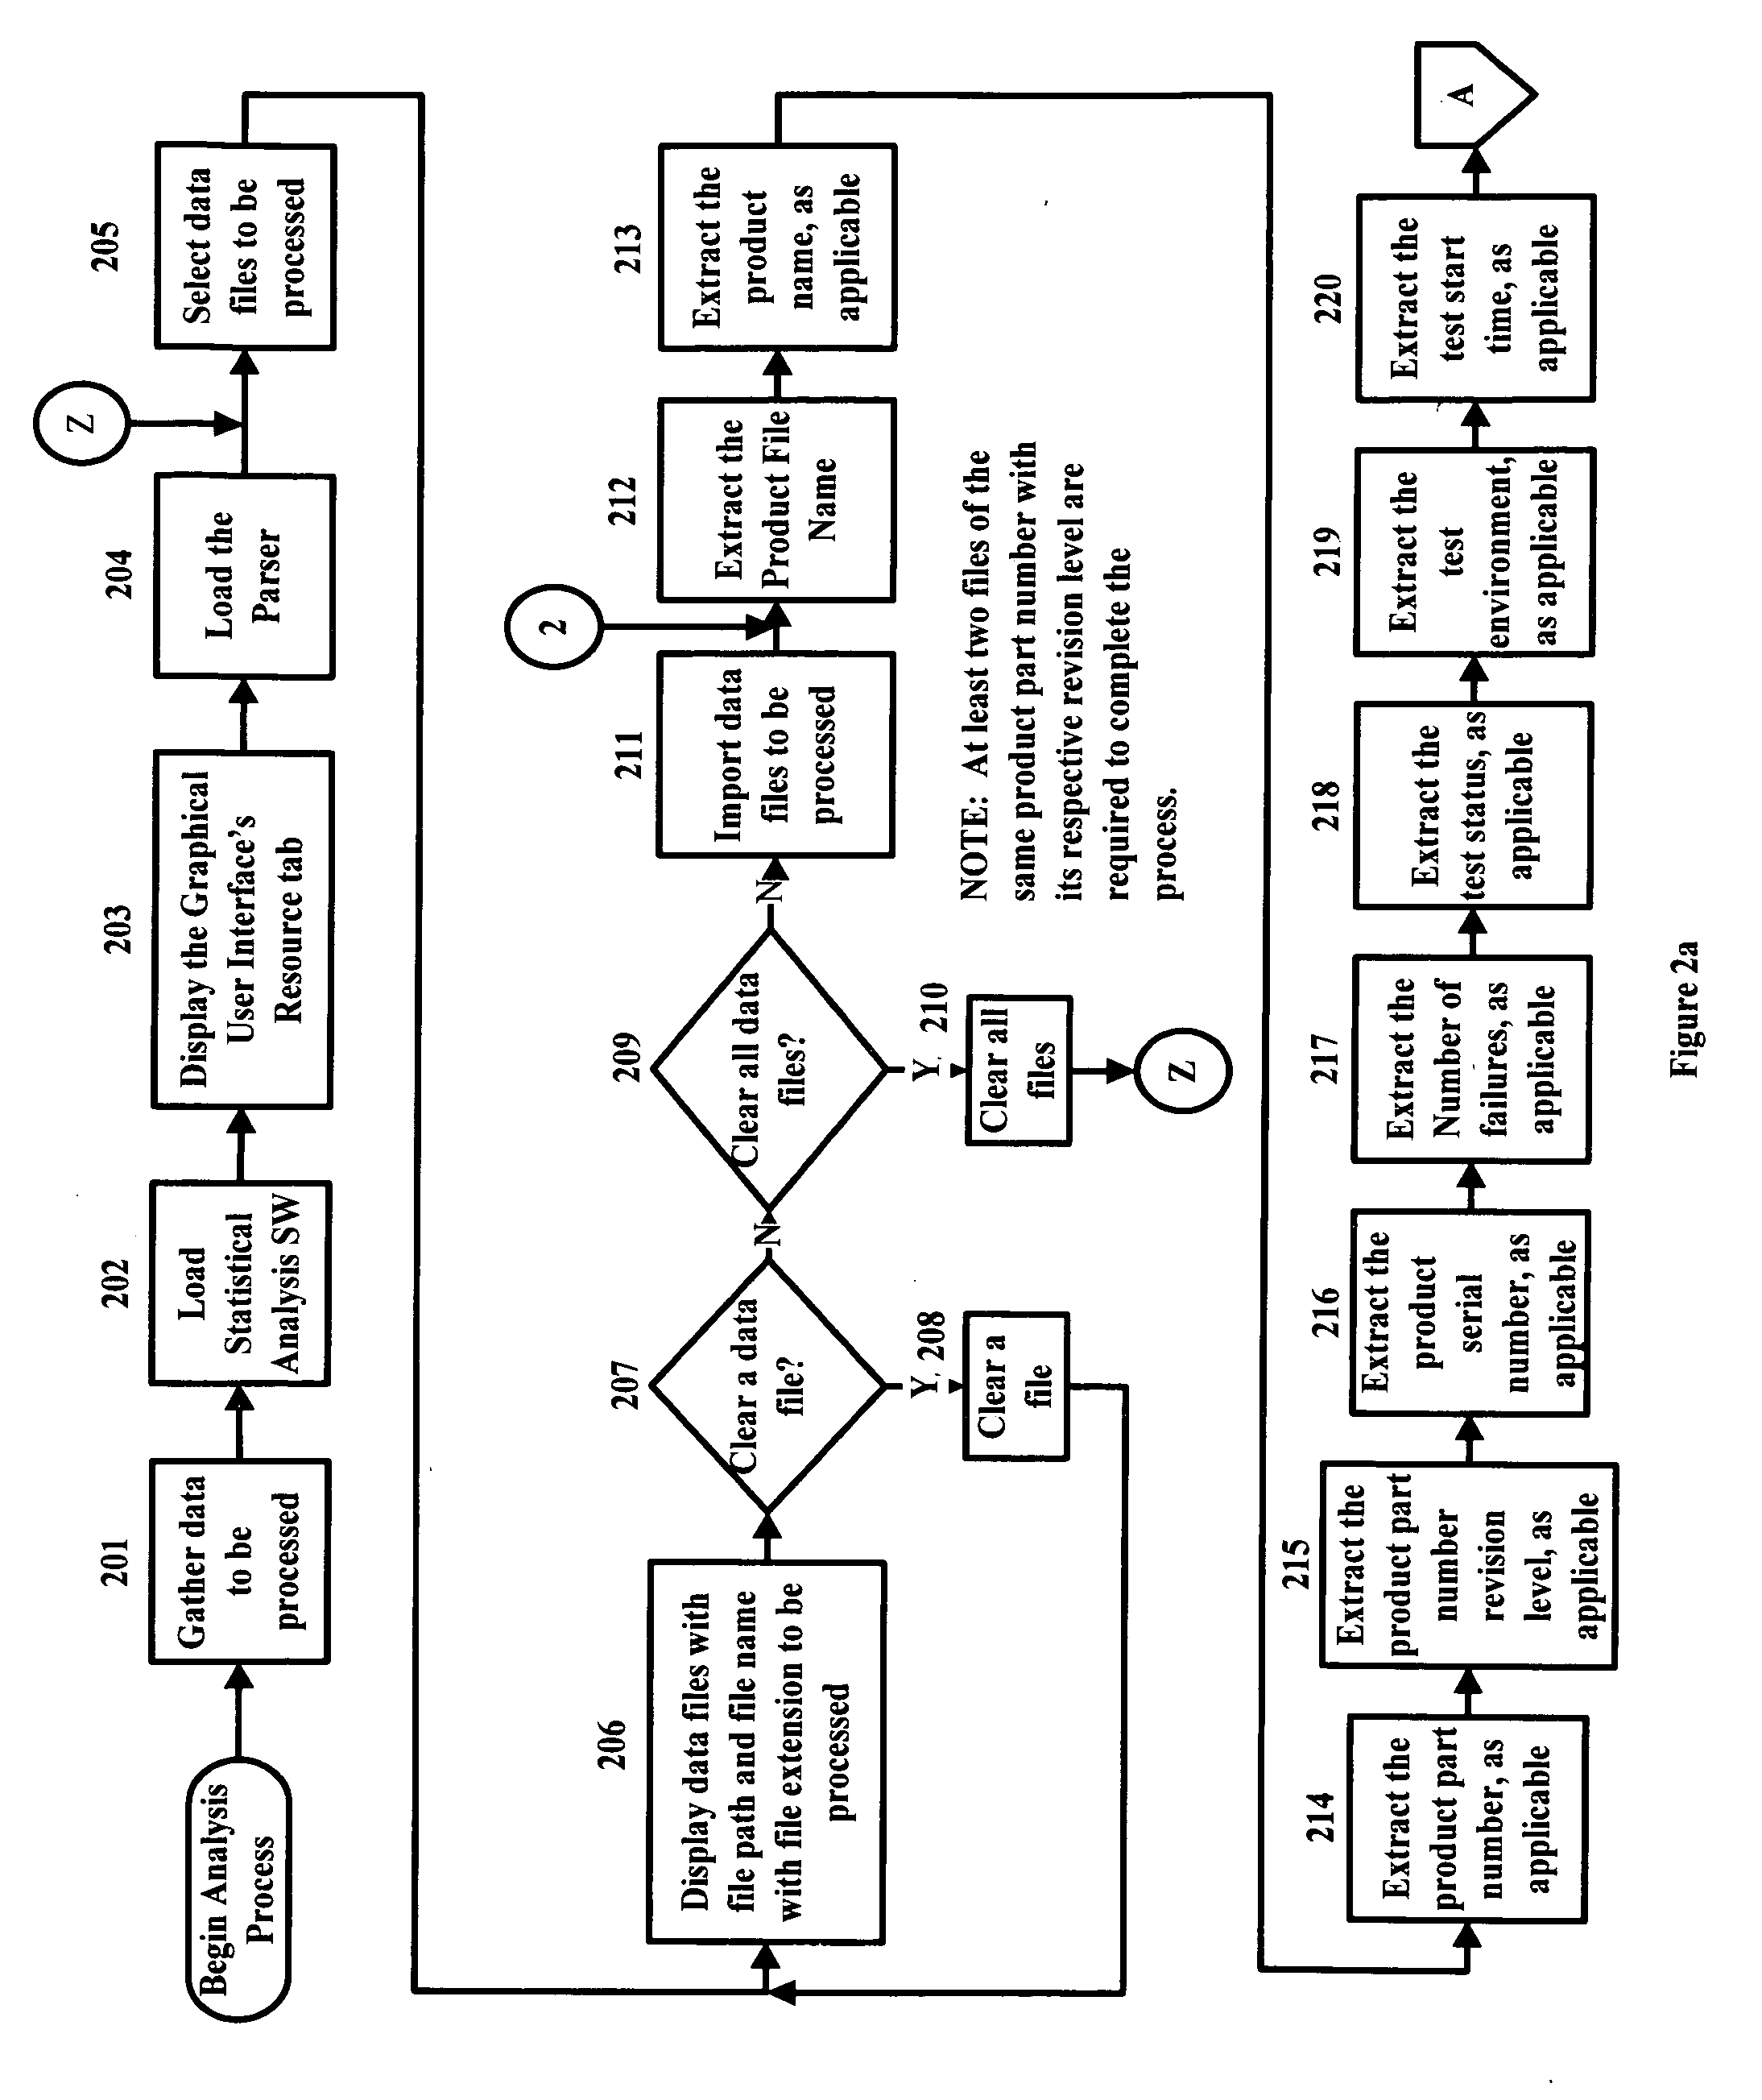
[0010]It is another object of the present invention to provide a method that may be performed by an embodiment combining software, hardware, and user input. This embodiment includes a computer, software embodying an analysis system or method and utilizing a graphical user interface display for test data capture, characterization, calculation, evaluation / analysis. The method entails the acquisition and characterization of test data, calculating statistical results based on this test data, thereby makes it possible for the user to assess the aggregate data and reduce the investigation to the significant parameters. An enormous amount of data can be harvested to perform the analysis of the parameters using this method.

Problems solved by technology

An enormous amount of data can be harvested to perform the analysis of the parameters using this method.

Method used


Image

  • Method for capturing and analyzing test result data
  • Method for capturing and analyzing test result data
  • Method for capturing and analyzing test result data

Examples


Embodiment Construction

[0019]The present invention is useful for capturing, characterizing, and analyzing test data. More specifically, the present invention provides a method for an improved statistical analysis of test data for diverse products from a wide variety of industries, such as proctologic video probes, video bore scopes, aviation electronic surveillance units, power supply printed circuit boards, aviation information management system modules, flight data recorders, traffic collision avoidance systems, radar modules, and website performance metrics. While statistical analysis is typically used to characterize and analyze products, it can also be used to evaluate the repeatability and reproducibility of designs, test processes (test instrument or test equipment), manufacturing processes, performance metrics, raw materials, and so on.

[0020]One of the challenges facing technicians, engineers, statisticians, and the like, is to quickly analyze raw and processed data and make sound decisions based ...


PUM


Abstract

A method, system, and graphical user interface display for an efficient and effective characterization and analysis of test data for diverse products from a wide variety of industries using both successful test data and failure test data.

Description

FIELD OF THE INVENTION [0001]The present invention relates to the field of capturing, characterizing, calculating, evaluating, and analyzing test data.BACKGROUND [0002]Design and Manufacturing companies typically utilize test instruments, manual test equipment, and / or automated test equipment (“test equipment”) with specific test software to validate a product design and manufacturing process.[0003]The test equipment usually has associated hardware interfacing between the test equipment and the products under test. Such products may include, but are not limited to, one or more of the following: devices, printed circuit assemblies, sub-assemblies, sub-units, units, sub-systems, and / or systems. The types of data and / or parameters collected from these products will vary depending upon the type of product. Some typical data and / or parameters include, but are not limited to, voltage, current, resistance, frequency, magnetic flux, digital data, dimensional, thermal properties, temperature...

Claims


Application Information

Patent Timeline
Patent Type & Authority Applications(United States)
IPC IPC(8): G06F17/18
CPCG06Q50/04Y02P90/30
Inventor BROWN, HAROLD LEEJUSTICE, PHILLIP A.
Owner BROWN HAROLD LEE
Learn More