Robust forecasting techniques with reduced sensitivity to anomalous data

a forecasting technique and anomalous data technology, applied in forecasting, instruments, data processing applications, etc., can solve the problems of large complexity of time series forecasting algorithms, ineffective handling of anomalous data points, and relatively large number of consecutive data points corresponding to anomalous data

Active Publication Date: 2010-07-22
AMAZON TECH INC
View PDF42 Cites 55 Cited by
  • Summary
  • Abstract
  • Description
  • Claims
  • Application Information

AI Technical Summary

Benefits of technology

[0013]Robust forecasting methods and algorithms are disclosed which are relatively immune from anomalies or outliers in a stream or time series of observed data values. These forecasting methods, which may be implemented in software and / or hardware of a computer-based monitoring system, improve the accuracy of forecasts for a wide variety of applications, such as in the detection of anomalies in the operation or use of a computer system. The forecasting methods are sufficiently computationally efficient to enable concurrent monitoring of a large number of data streams (which may be associated with a common metric or different metrics) in real time.
[0018]In one embodiment, a plurality of the above techniques are combined to provide a robust forecast suitable for use in monitoring a computer system. These robust forecasts can be used to detect various types of faults and anomalies associated with a monitored system such that corrective actions can be taken in a timely manner.

Problems solved by technology

Time series forecasting algorithms vary greatly in complexity.
While such techniques may isolate a single outlier in a historical data series, an abnormality in a monitored system may result in a relatively large number of consecutive data points corresponding to anomalous data.
These anomalous data points are not effectively handled by conventional forecasting techniques.
It is typical for robust techniques to be ineffective when an anomaly spans several successive observations or when an anomaly is present in the most recent observation(s).
One problem with existing forecasting methods, including those that account for seasonal variations, is that they commonly produce inaccurate results for a period of time after an anomaly occurs.
For example, an anomalous event in the operation of a computer system, such as a server failure or denial of service (DoS) attack, will typically result in one or more anomalous data values in the time series of a representative metric; additionally, during the time of failure, these data points will typically be the most recent available observations.
As described in the foregoing, typical outlier removal methods are not effective in this situation.
Methods such as exponential smoothing will perform poorly between the start of the event until well after the event has subsided due to the influence of anomalous data.
Seasonal forecasting algorithms may produce poor forecasts for several cycles (e.g., days, weeks or years); HWS typically does not completely recover within a meaningful time scale.
As a result, the forecasting-based monitoring system may both fail to accurately detect problems that require attention and yield unacceptably numerous false alarms.
Another problem with the relatively more complex conventional forecasting methods is that they are typically computationally intensive.

Method used


Image

  • Robust forecasting techniques with reduced sensitivity to anomalous data
  • Robust forecasting techniques with reduced sensitivity to anomalous data
  • Robust forecasting techniques with reduced sensitivity to anomalous data

Examples


example timing

Diagrams (FIGS. 1C, 1D, and 1E)

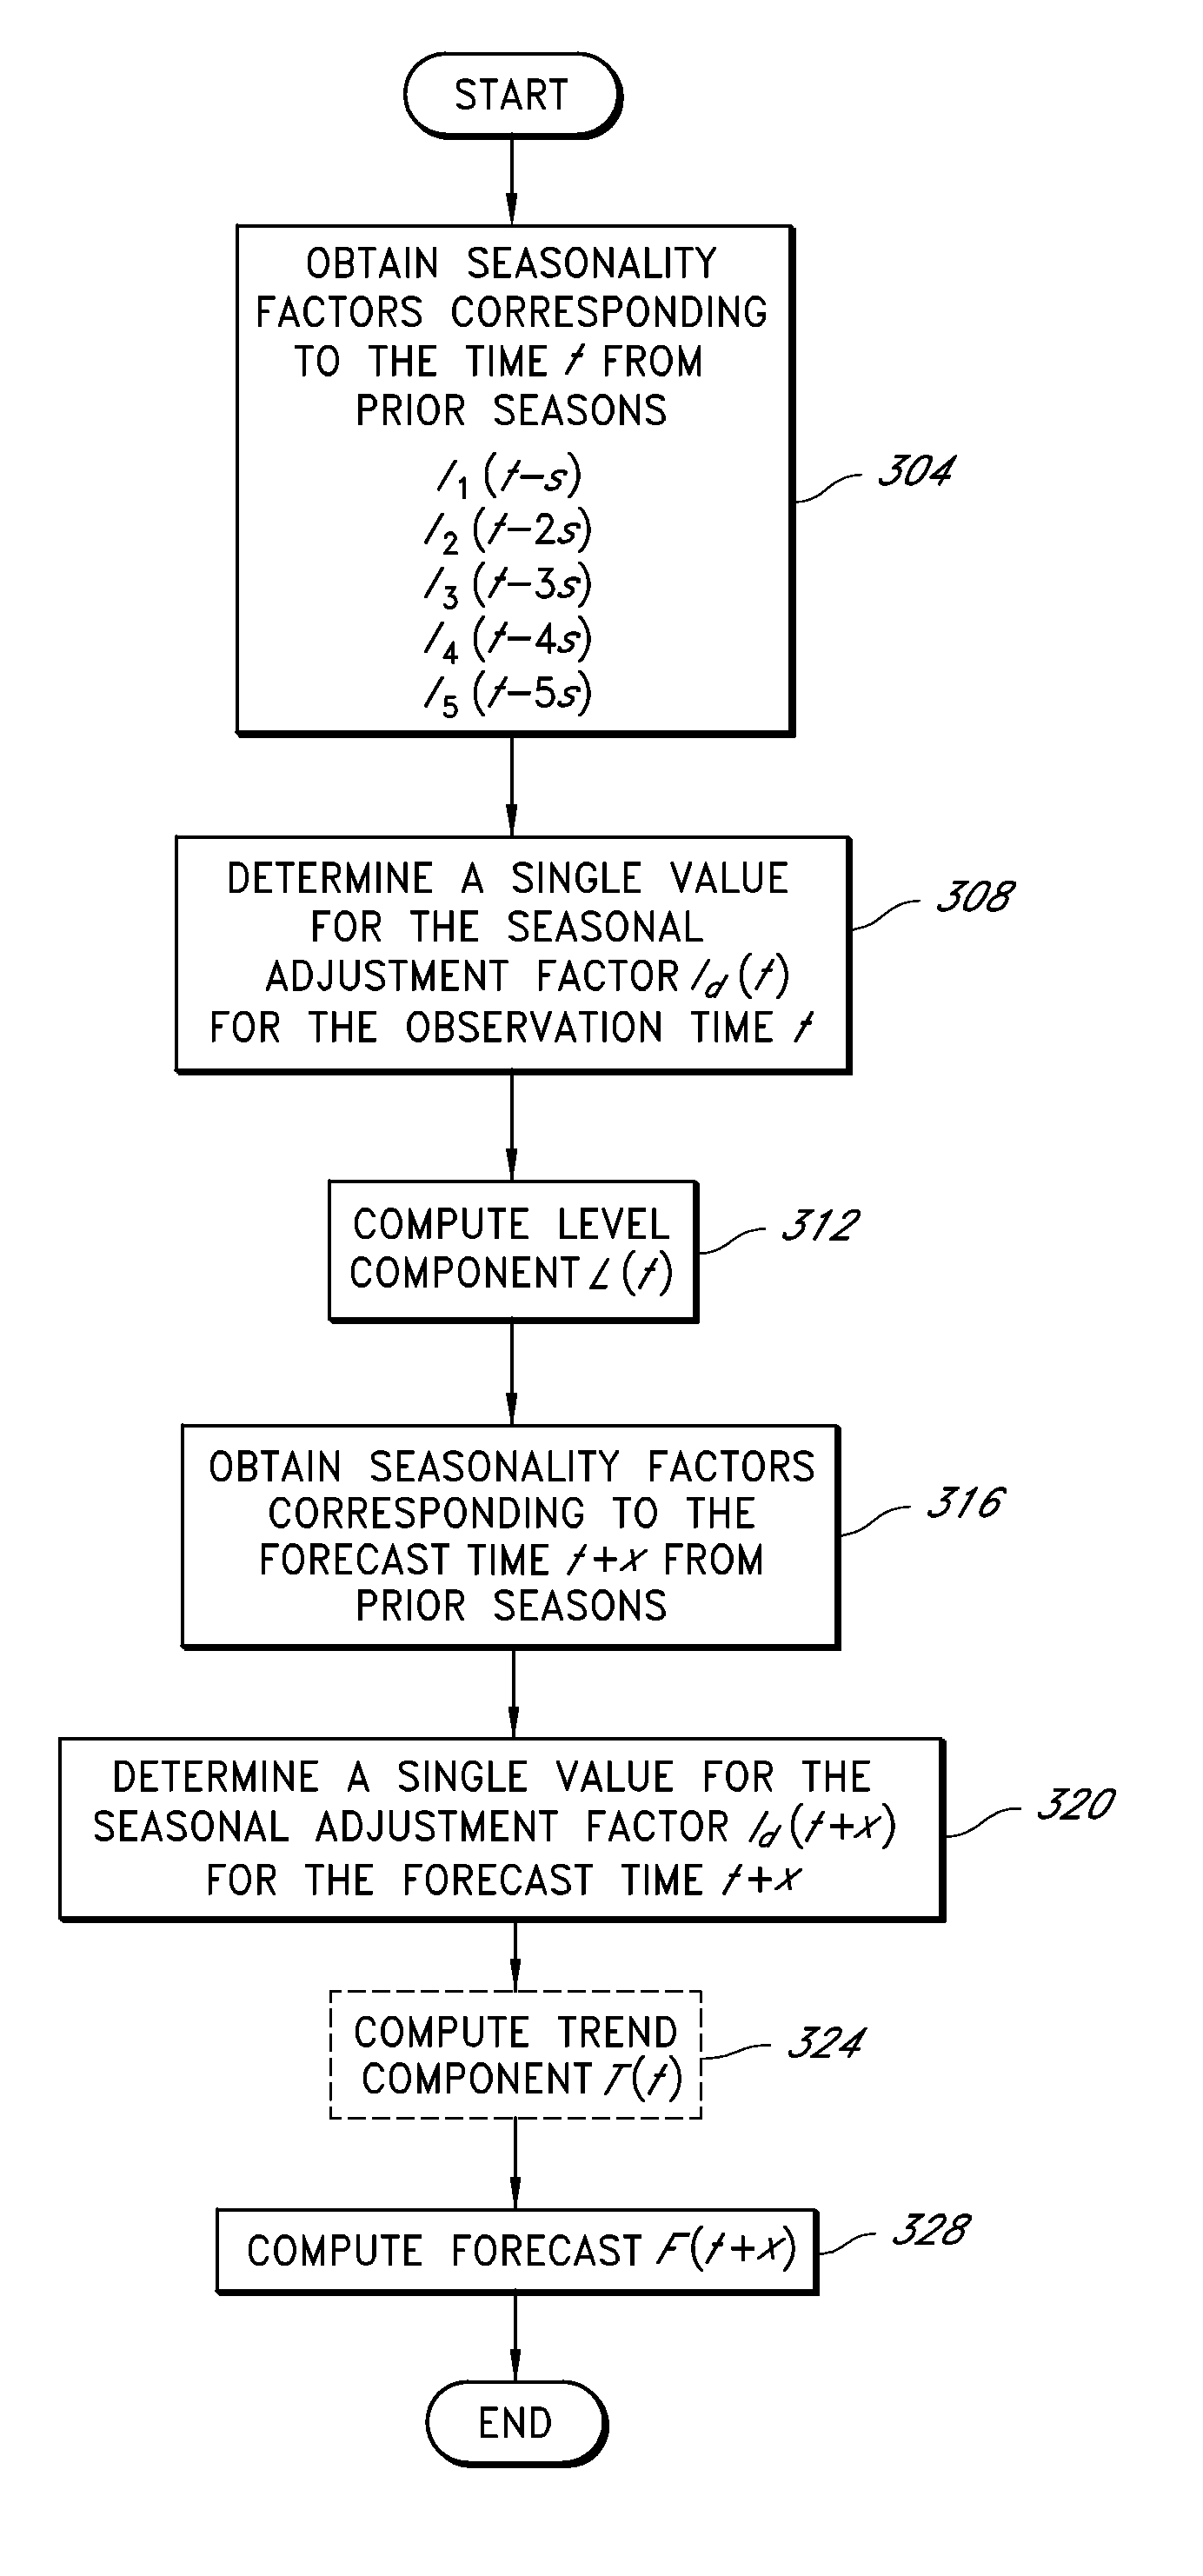
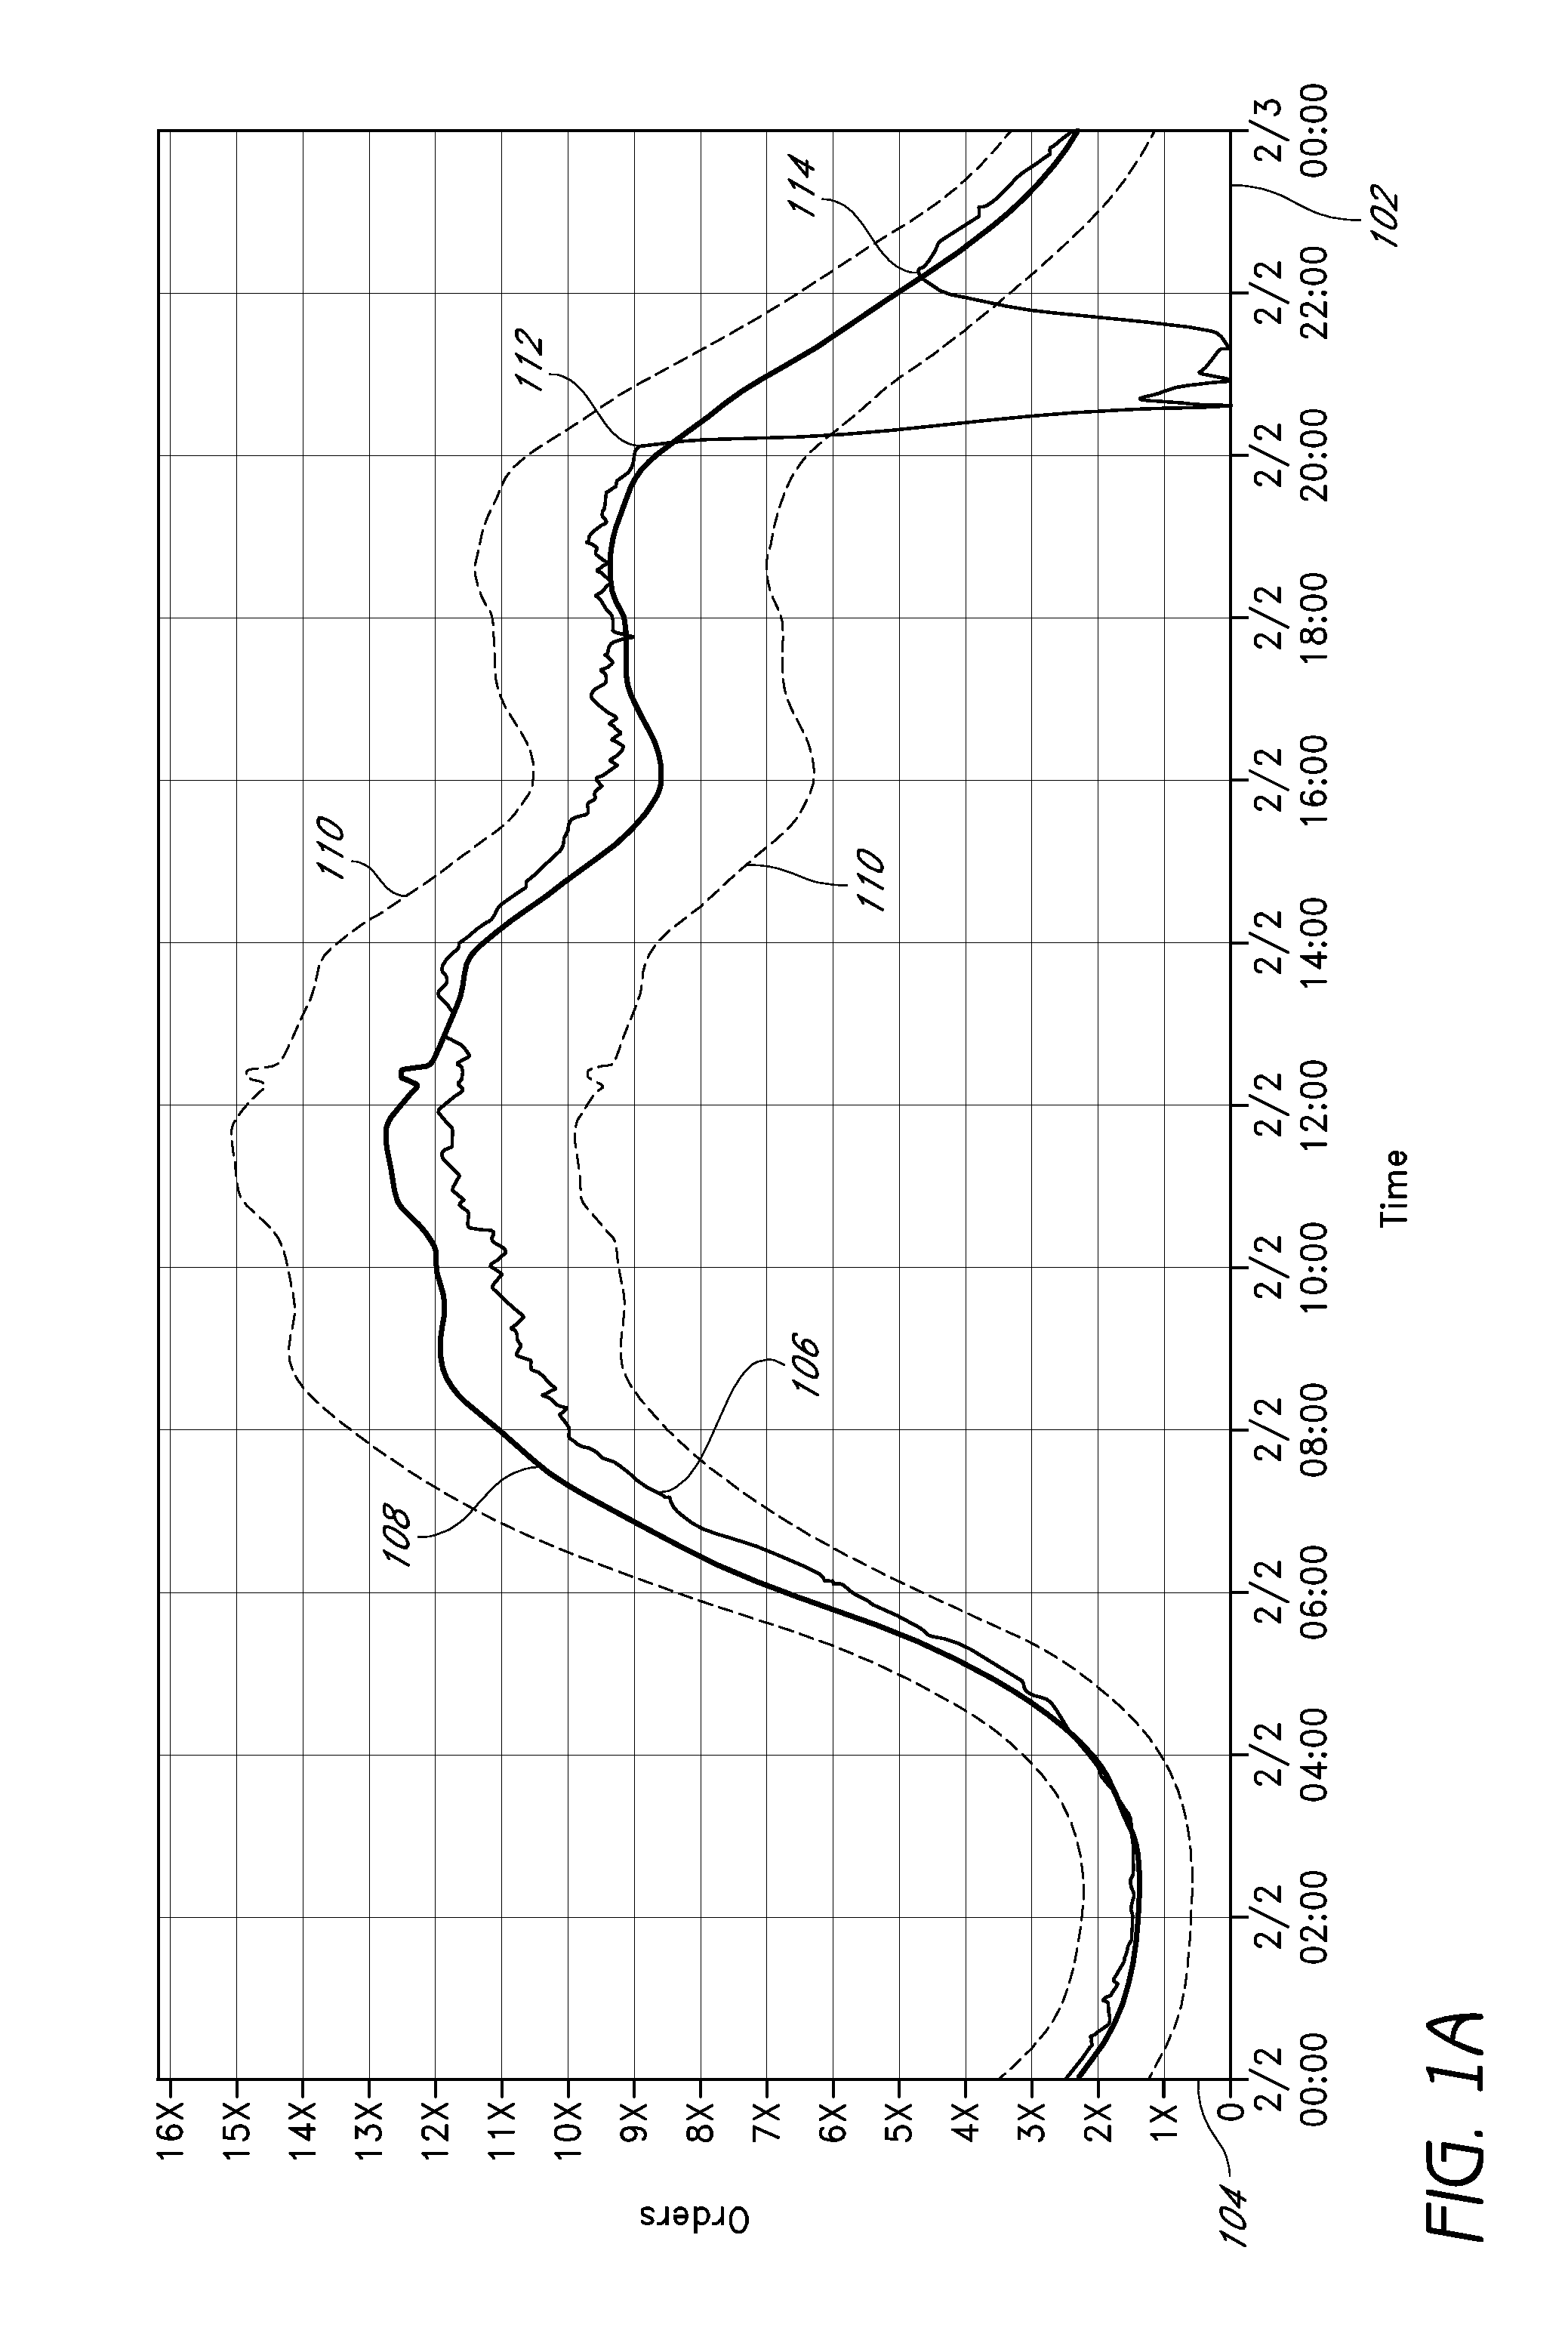
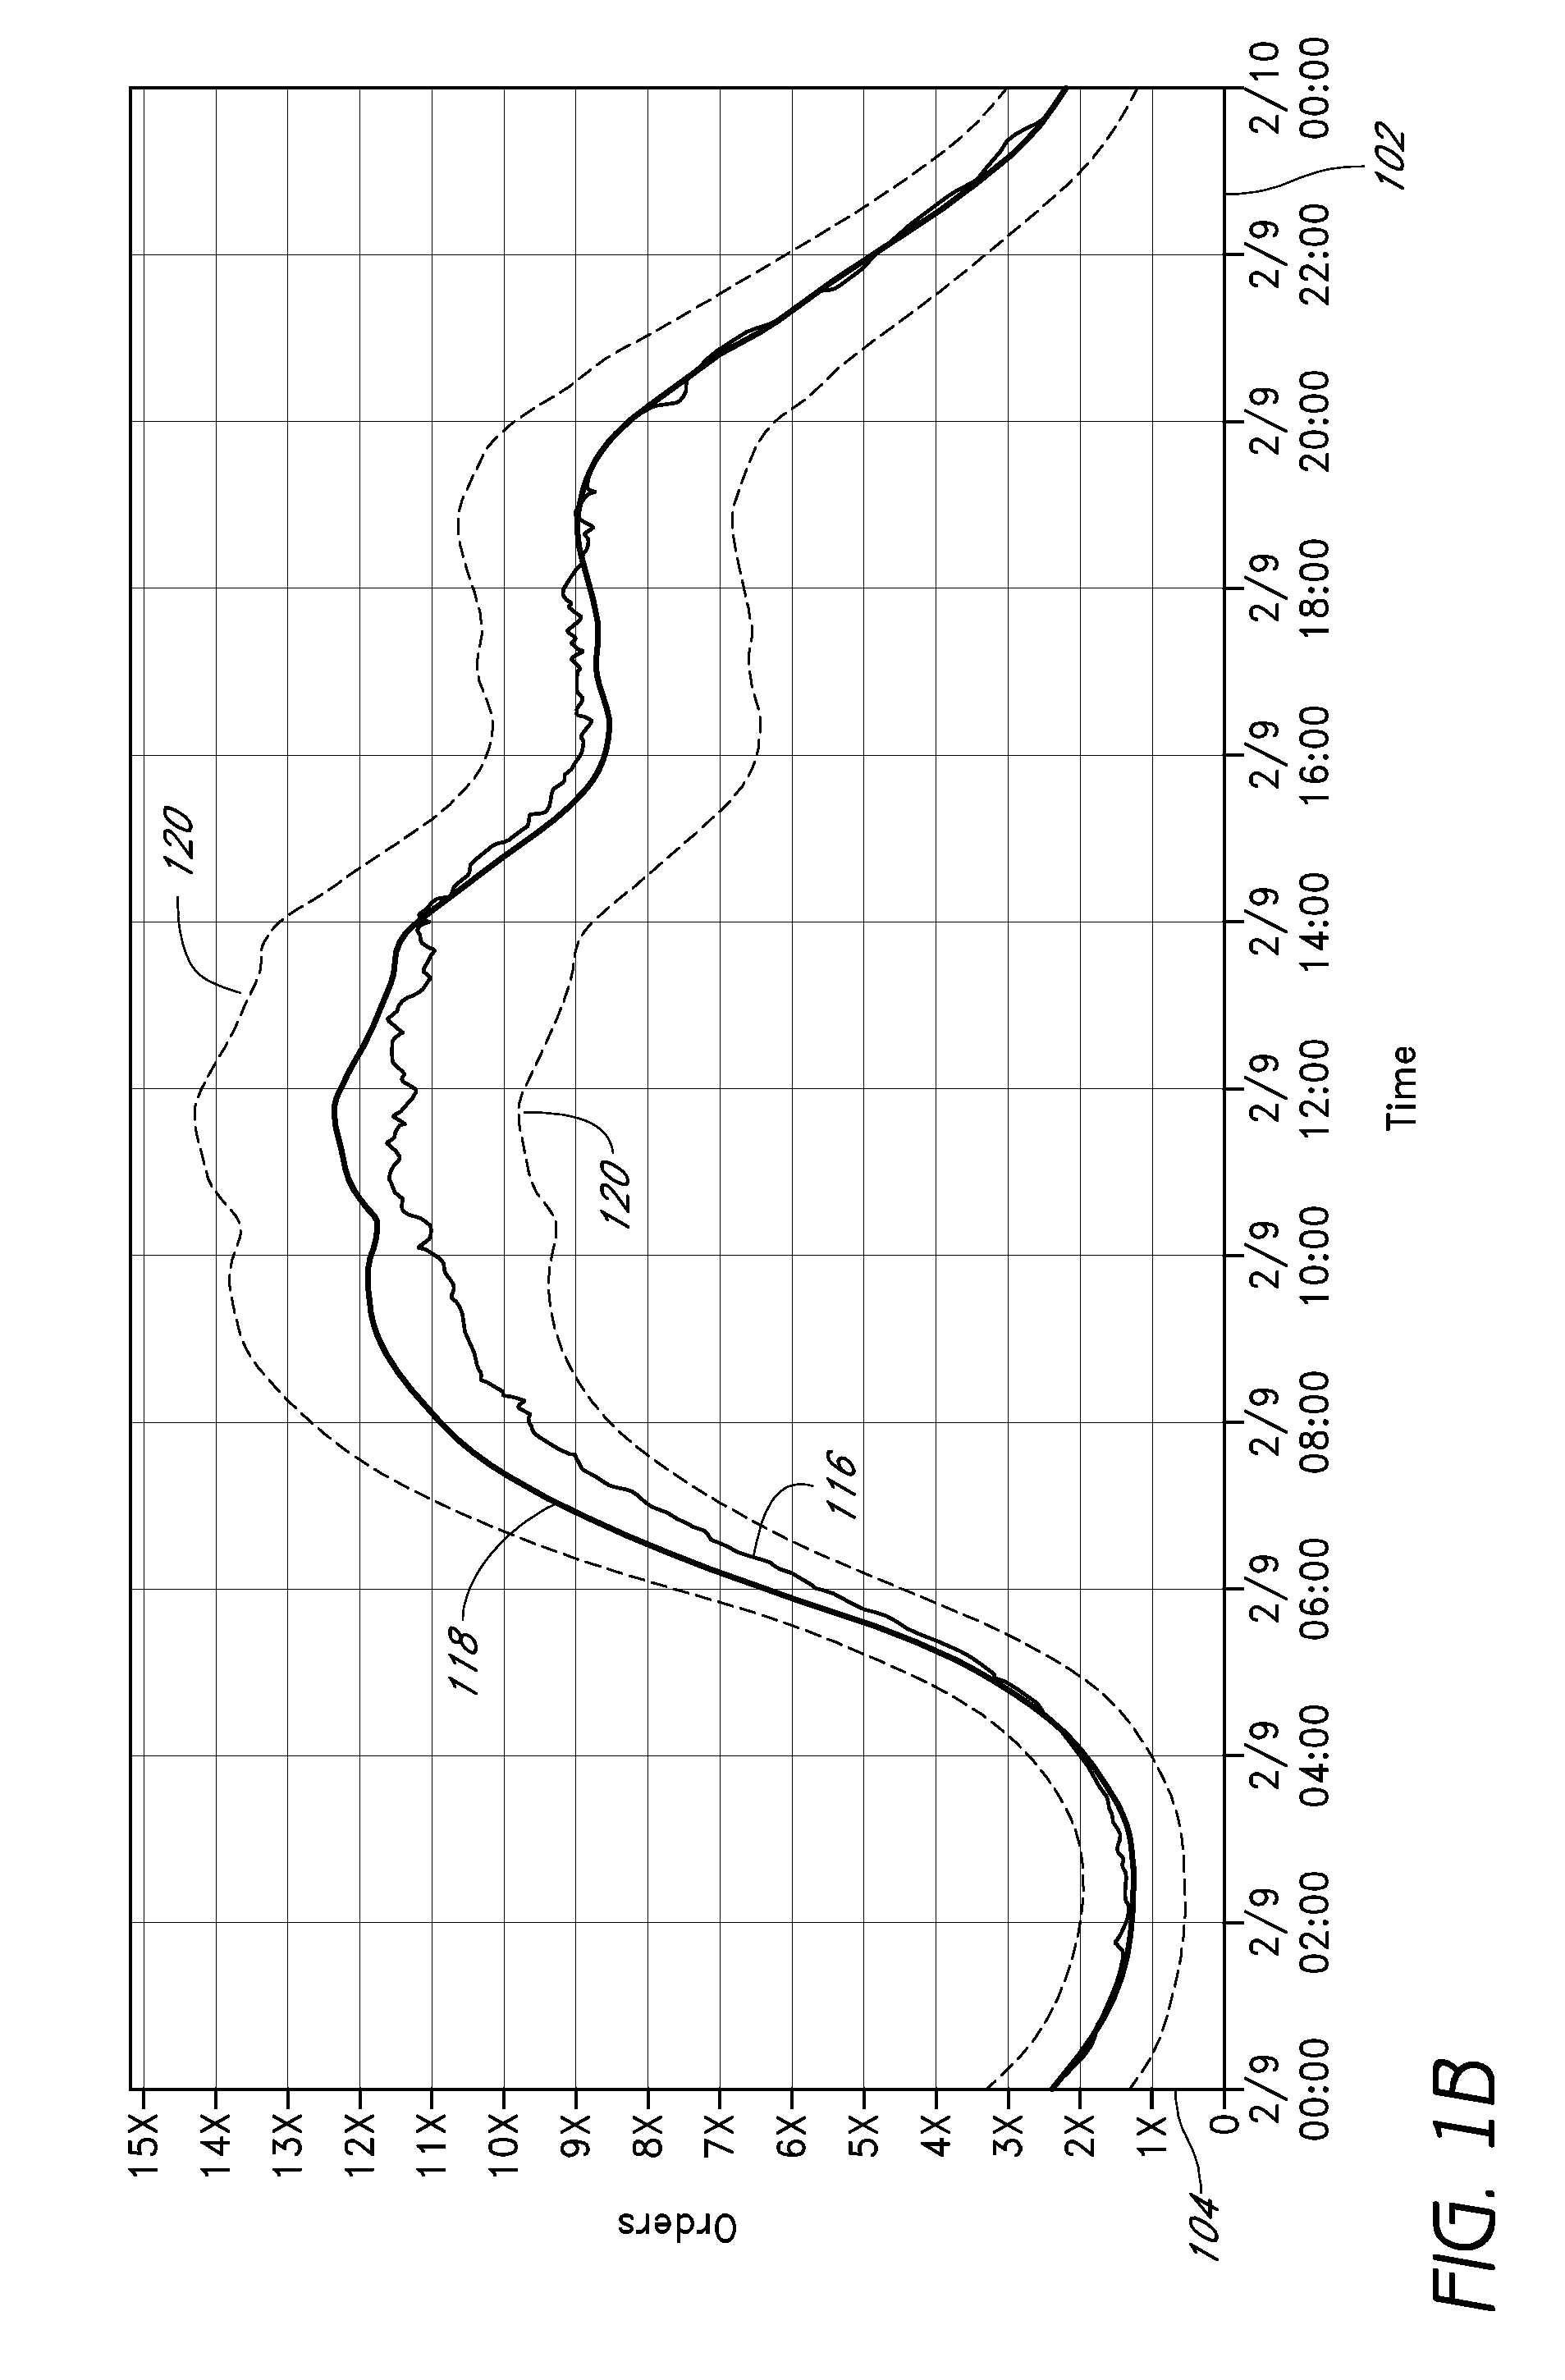
[0052]FIG. 1C is a timing diagram illustrating seasonal periods used to account for seasonality (deseasonalize) a current observation at time t and to adjust for seasonality (seasonalize) a forecast for a time t+x, where the forecast time horizon x is less than or equal to a seasonal period s. An example described later in connection with FIG. 1D illustrates seasonal periods where the forecast time horizon x is greater than the length of a seasonal period s. The illustrated timing diagrams may be helpful in illustrating features of a process that will be described in greater detail later in connection with FIG. 3.

[0053]A horizontal axis indicates time, with time increasing to the right. A dashed vertical line at present time t (now) corresponds to the most recent in time observation in use by the forecasting process. As illustrated in FIG. 1C, the dashed vertical line at present time t demarcates a domain to the left in which observations are available...


PUM


Abstract

Robust forecasting techniques are relatively immune from anomalies or outliers in observed data, such as a stream of data values reflective of the operation or use of a computer system. One robust technique provides a relatively accurate forecast of seasonal behavior even in the presence of an anomaly in corresponding historical data. Another robust forecasting technique provides a relatively accurate forecast even in the presence of an anomaly that spans multiple recent observations. In one embodiment, both techniques are used in combination to automatically detect anomalies in the operation and / or use of a multi-user computer system.

Description

RELATED APPLICATIONS[0001]This application is a continuation of U.S. patent application Ser. No. 11 / 089,537, filed Mar. 24, 2005, titled ROBUST FORECASTING TECHNIQUES WITH REDUCED SENSITIVITY TO ANOMALOUS DATA, now U.S. patent Ser. No. ______, the entirety of which is hereby incorporated by reference. This application is related to U.S. patent application Ser. No. 11 / 089,452, filed Mar. 24, 2005, titled ROBUST FORECASTING TECHNIQUES WITH REDUCED SENSITIVITY TO ANOMALOUS DATA, now U.S. Pat. No. 7,610,214, the entirety of which is hereby incorporated by reference.BACKGROUND[0002]1. Field of the Invention[0003]The invention generally relates to the monitoring of a computer-based system, such as a web site system, to detect events or problems that may require a corrective action. More specifically, the invention relates to a methodology of monitoring such a system by computationally predicting the values of data representative of its normal operating conditions, and computationally eval...

Claims


Application Information

Patent Timeline
Patent Type & Authority Applications(United States)
IPC IPC(8): G06Q10/00
CPCG06Q10/04G06Q30/0202
Inventor DWARAKANATH, SAMVID H.VANDERBILT, MONTYZOOK, JOHN M.
Owner AMAZON TECH INC
Why Eureka
Try Eureka