Tools for objectively determining severity of systemic sclerosis

Inactive Publication Date: 2011-08-04
LAFYATIS ROBERT A
View PDF0 Cites 0 Cited by
  • Summary
  • Abstract
  • Description
  • Claims
  • Application Information

AI Technical Summary

Benefits of technology

[0006]At present, due to the lethality and rarity of systemic sclerosis, a large percentage of the care for patients with the disease is handled in specialized centers. The development of tools to objectively measure the degree of the disease—and of the change of the degree of the disease ov

Problems solved by technology

Systemic sclerosis can even be fatal, with lung, heart, and kidney troubles accounting for most deaths.
PAH is associated with high mortality rates despite modest improvements in survi

Method used


Image

  • Tools for objectively determining severity of systemic sclerosis
  • Tools for objectively determining severity of systemic sclerosis
  • Tools for objectively determining severity of systemic sclerosis

Examples


Example

Example 1

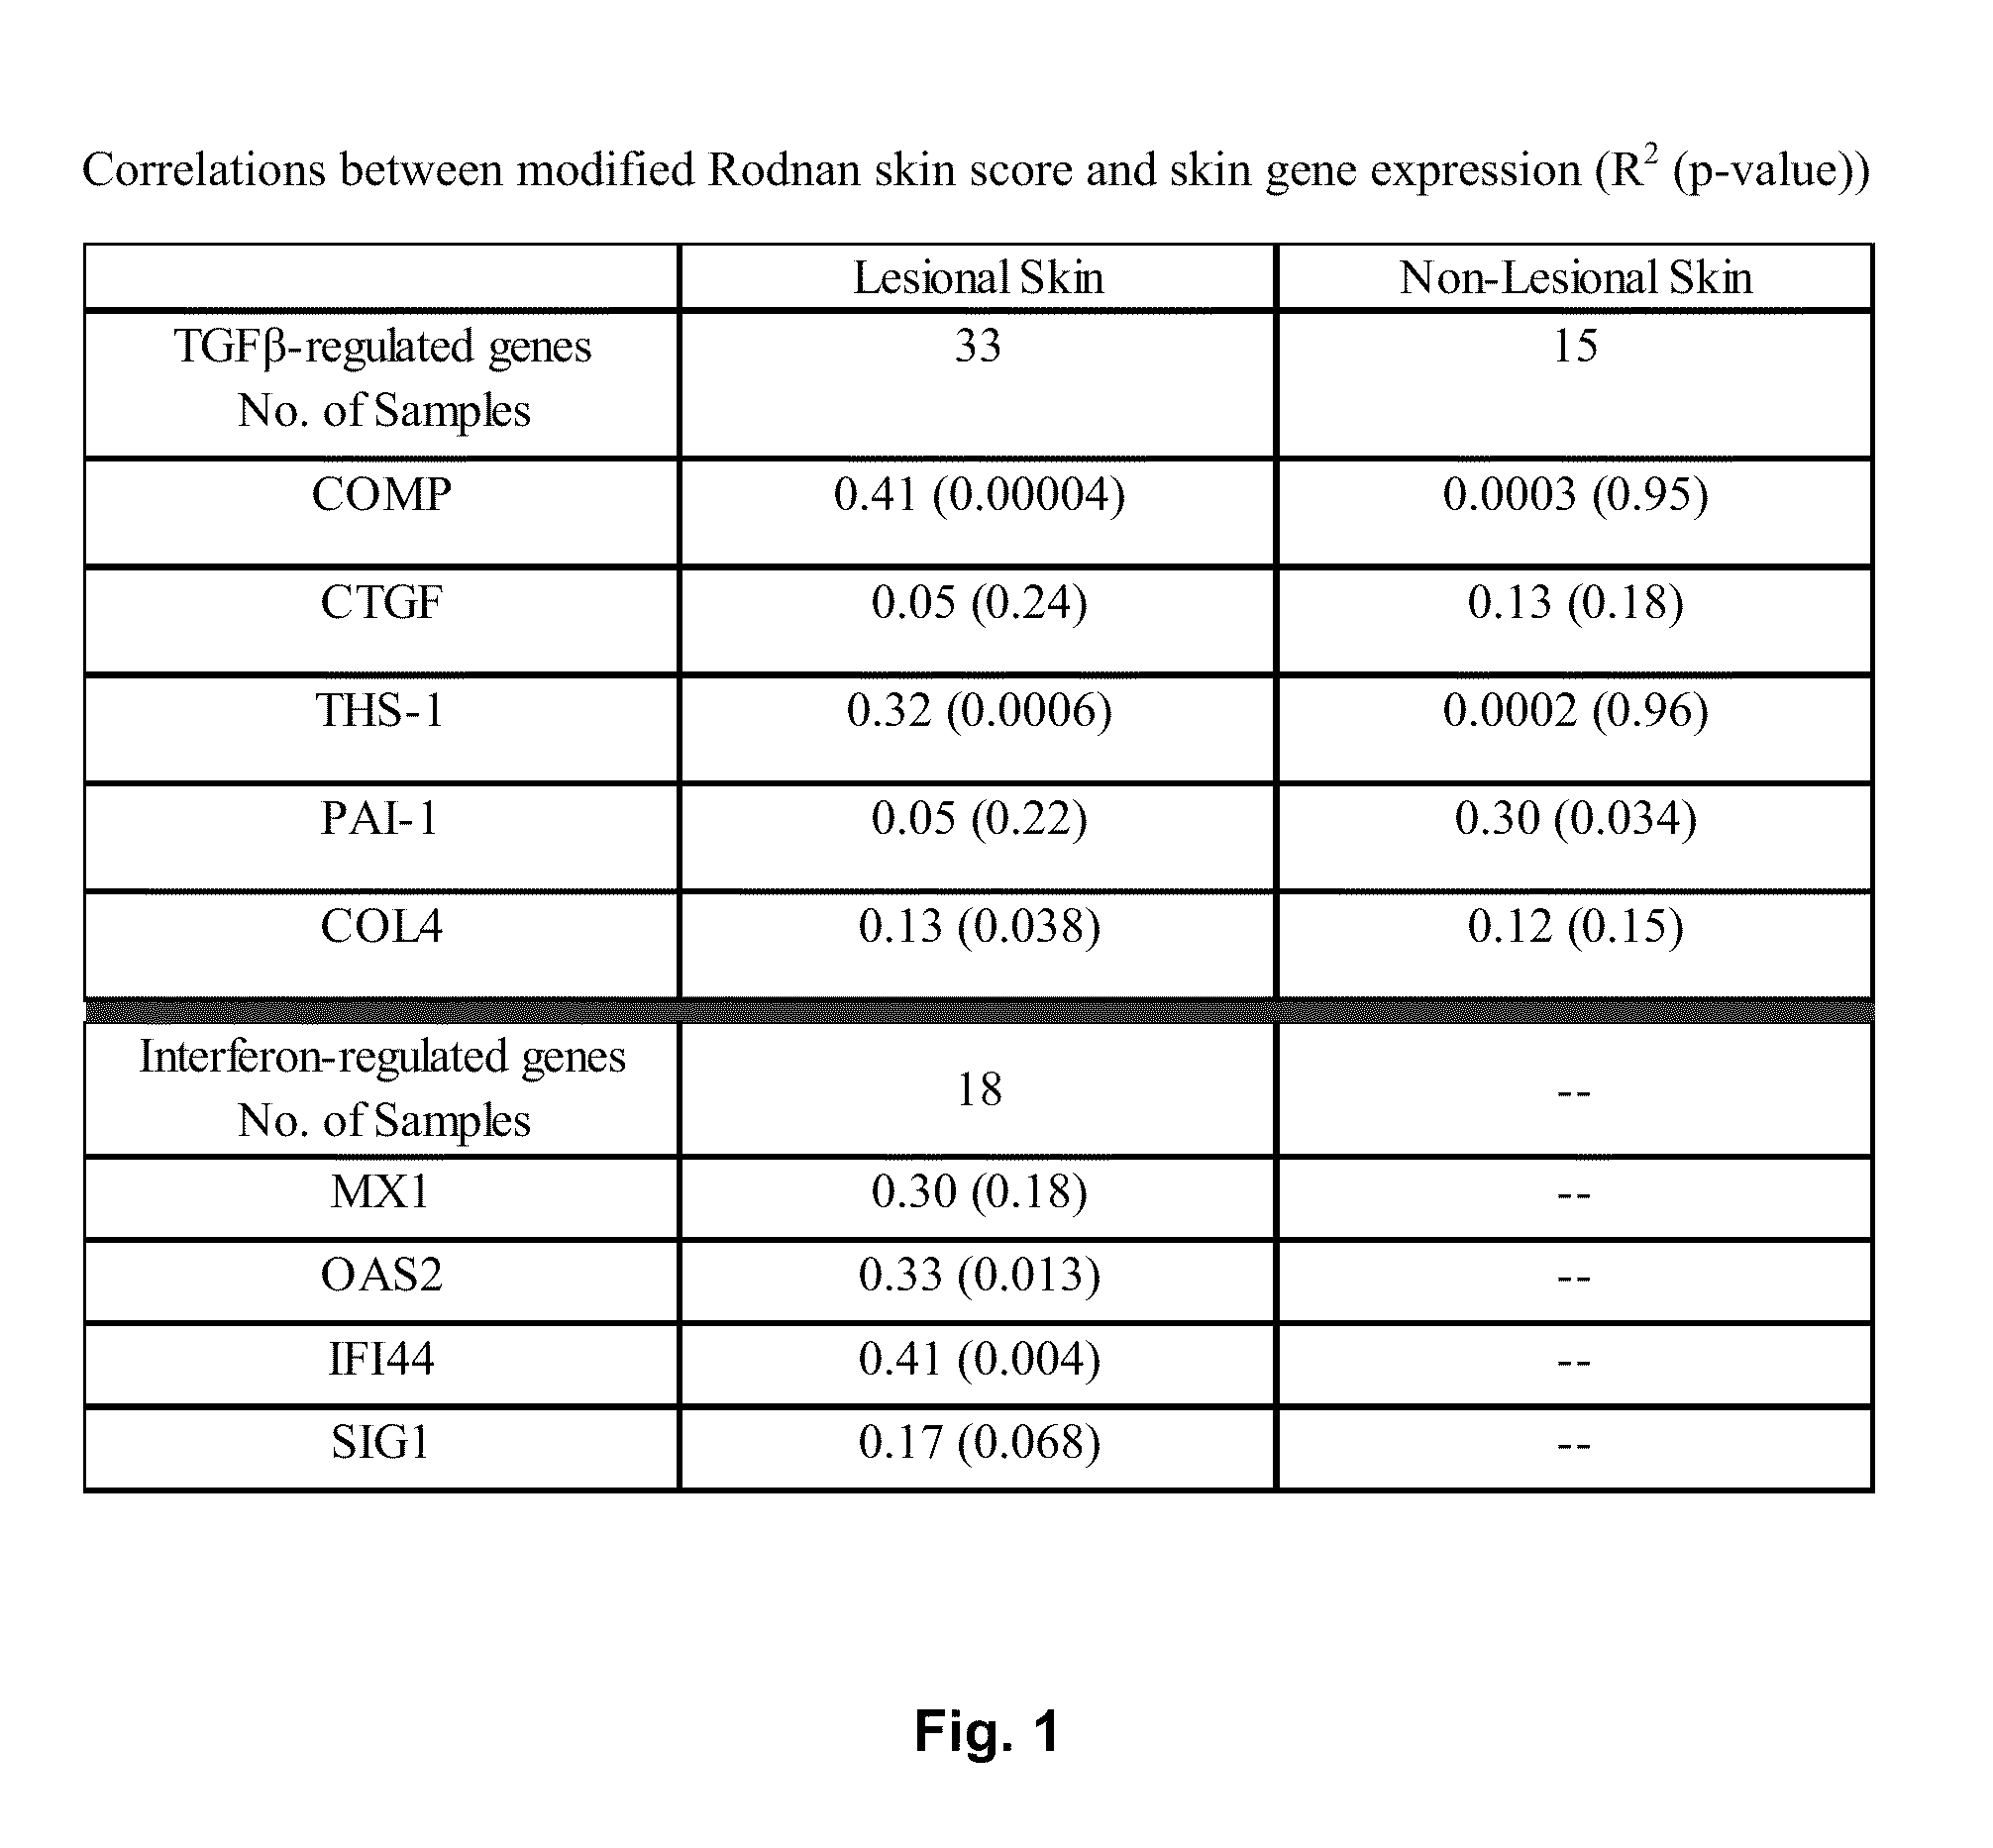
[0025]In the first example, any one identified gene can be useful for predicting and / or supplementing the mRSS. The correlation between each gene and the mRSS is expressed in the listed R2 values of the table:

GeneOne Gene (R2)COMP0.64THS10.32SIG10.17IFI440.41MX10.30OAS20.33

Example

Example 2

[0026]In the second example, pair combinations of each gene can be useful for predicting and / or supplementing the mRSS. The correlation between each gene pair and the mRSS is expressed in the listed R2 values of the table. Each gene listed in column A is paired with the genes listed in columns B, C, D, E, and F, and the R2 values for the respective combinations are listed where the row for each gene listed in column A intersects the column below each gene in the columns B-F. The R2 value for each combination is listed only once.

GeneTwo Gene Fits (R2)ABCDEFCOMPCOMPTHS1SIG1IFI44MX1THS10.71SIG10.660.47IFI440.710.760.53MX10.640.610.370.43OAS20.670.550.380.480.35

Example

Example 3

[0027]In the third example, three-gene combinations can be useful for predicting and / or supplementing the mRSS. The correlation between each three gene combination and the mRSS is expressed in the listed R2 values of the table. Each gene listed in column A is combined with the genes pairs listed in columns B-K, and the R2 values for the respective combinations are listed where the row for each gene listed in column A intersects the column below each gene pair in the columns B-K. The R2 value for each combination is listed only once.

Three Gene Fits (R2)BCDEFGHIJKGeneCOMP / COMP / COMP / COMP / THS1 / THS1 / THS1 / SIG1 / SIG1 / IFI44 / ATHS1SIG1IFI44MX1SIG1IFI44MX1IFI44MX1MX1SIG10.74IFI440.840.730.86MX10.730.660.750.710.780.53OAS20.690.680.720.700.610.770.650.540.400.48

The p-values for the three gene combinations with the highest R2 values are as follows:

p-valuep-valuep-valuep-valueR2COMP:0.012THS1:0.003IFI44:0.0030.84THS1:SIG1:IFI44:0.0040.86


PUM


Abstract

Methods are disclosed for the identification and use of biomarkers in order to objectively measure systemic sclerosis. The biomarker may be a single gene, or may be a combination of multiple genes. A preferred embodiment in which the biomarker is a four gene combination of two TGFβ regulated genes (COMP and THS1), and two IFN regulated genes (IFI44 and SIG1) is the best identified predictor of systemic sclerosis as measured by the modified Rodnan skin score.

Description

RELATED APPLICATION DATA[0001]This application claims the benefit under 35 U.S.C. §119(e) of U.S. Provisional Application No. 61 / 336,361, filed Jan. 21, 2010, the content of which is hereby expressly incorporated herein by reference in its entirety.FIELD OF THE DISCLOSURE[0002]Aspects of this disclosure relate to methods for determining the severity of systemic sclerosis. Other aspects relate to methods and tools for providing objective severity data and using the data for drug discovery trials, diagnostics, and therapeutics.DESCRIPTION OF BACKGROUND INFORMATION[0003]Systemic sclerosis can be a debilitating disease. People suffering from systemic sclerosis are afflicted with fibrosis, degenerative changes, and vascular abnormalities in their skin, joints and various internal organs such as the esophagus, lower GI tract, lungs, heart, and kidneys. They often suffer from Raynaud's syndrome, polyarthralgia, dysphagia, and heartburn. Swelling and eventually skin tightening and contractu...

Claims


Application Information

Patent Timeline
IPC IPC(8): C12Q1/68
CPCC12Q1/68C12Q2600/158C12Q1/6883C12Q2600/106G01N2800/52
Inventor LAFYATIS, ROBERT A.
Owner LAFYATIS ROBERT A
Why Eureka
Try Eureka