Spectroscopic analyzer and spectroscopic analysis method

a spectroscopic analyzer and analyzer technology, applied in chemical methods analysis, correlation spectrometry, instruments, etc., can solve the problem of not being able to assign the spectrum peak depending on the sample, and achieve the effect of reducing the probability of sample contamination

Inactive Publication Date: 2011-12-15
YOKOGAWA ELECTRIC CORP
View PDF0 Cites 12 Cited by
  • Summary
  • Abstract
  • Description
  • Claims
  • Application Information

AI Technical Summary

Benefits of technology

[0010]Exemplary embodiments of the present invention provide a spectroscopic analyzer and a spectroscopic analysis method capable of analyzing the characteristics of a sample easily and in a short time even if there is not enough knowledge about the spectra of near-infrared region and infrared region.
[0029]According to the invention, the integrated spectrum data is acquired by combining of the spectrum of near-infrared region measured by the first measurement section and the spectrum of infrared region measured by the second measurement section, and then the difference spectrum data of the reference spectrum data measured in advance and the integrated spectrum data is calculated. Using the difference spectrum data, the two-dimensional correlation operation is performed to acquire the correlation (two-dimensional correlation) between the spectrum of near-infrared region and the spectrum of infrared region. For this reason, even a user who does not have enough knowledge about the spectrum of near-infrared region and the spectrum of infrared region can easily understand the relationship between the spectrum of near-infrared region and the spectrum of infrared region just by referring to the graph showing the two-dimensional correlation between the spectrum of near-infrared region and the spectrum of infrared region.

Problems solved by technology

In contrast, the spectroscopic analyzer using near-infrared light is characterized in that a thick sample can be analyzed as the transmittance of near-infrared light is higher than that of infrared light, but it is not easy to assign the spectrum peak depending on a sample component as the widths of acquired spectra are large and overlap each other.

Method used


Image

  • Spectroscopic analyzer and spectroscopic analysis method
  • Spectroscopic analyzer and spectroscopic analysis method
  • Spectroscopic analyzer and spectroscopic analysis method

Examples


Embodiment Construction

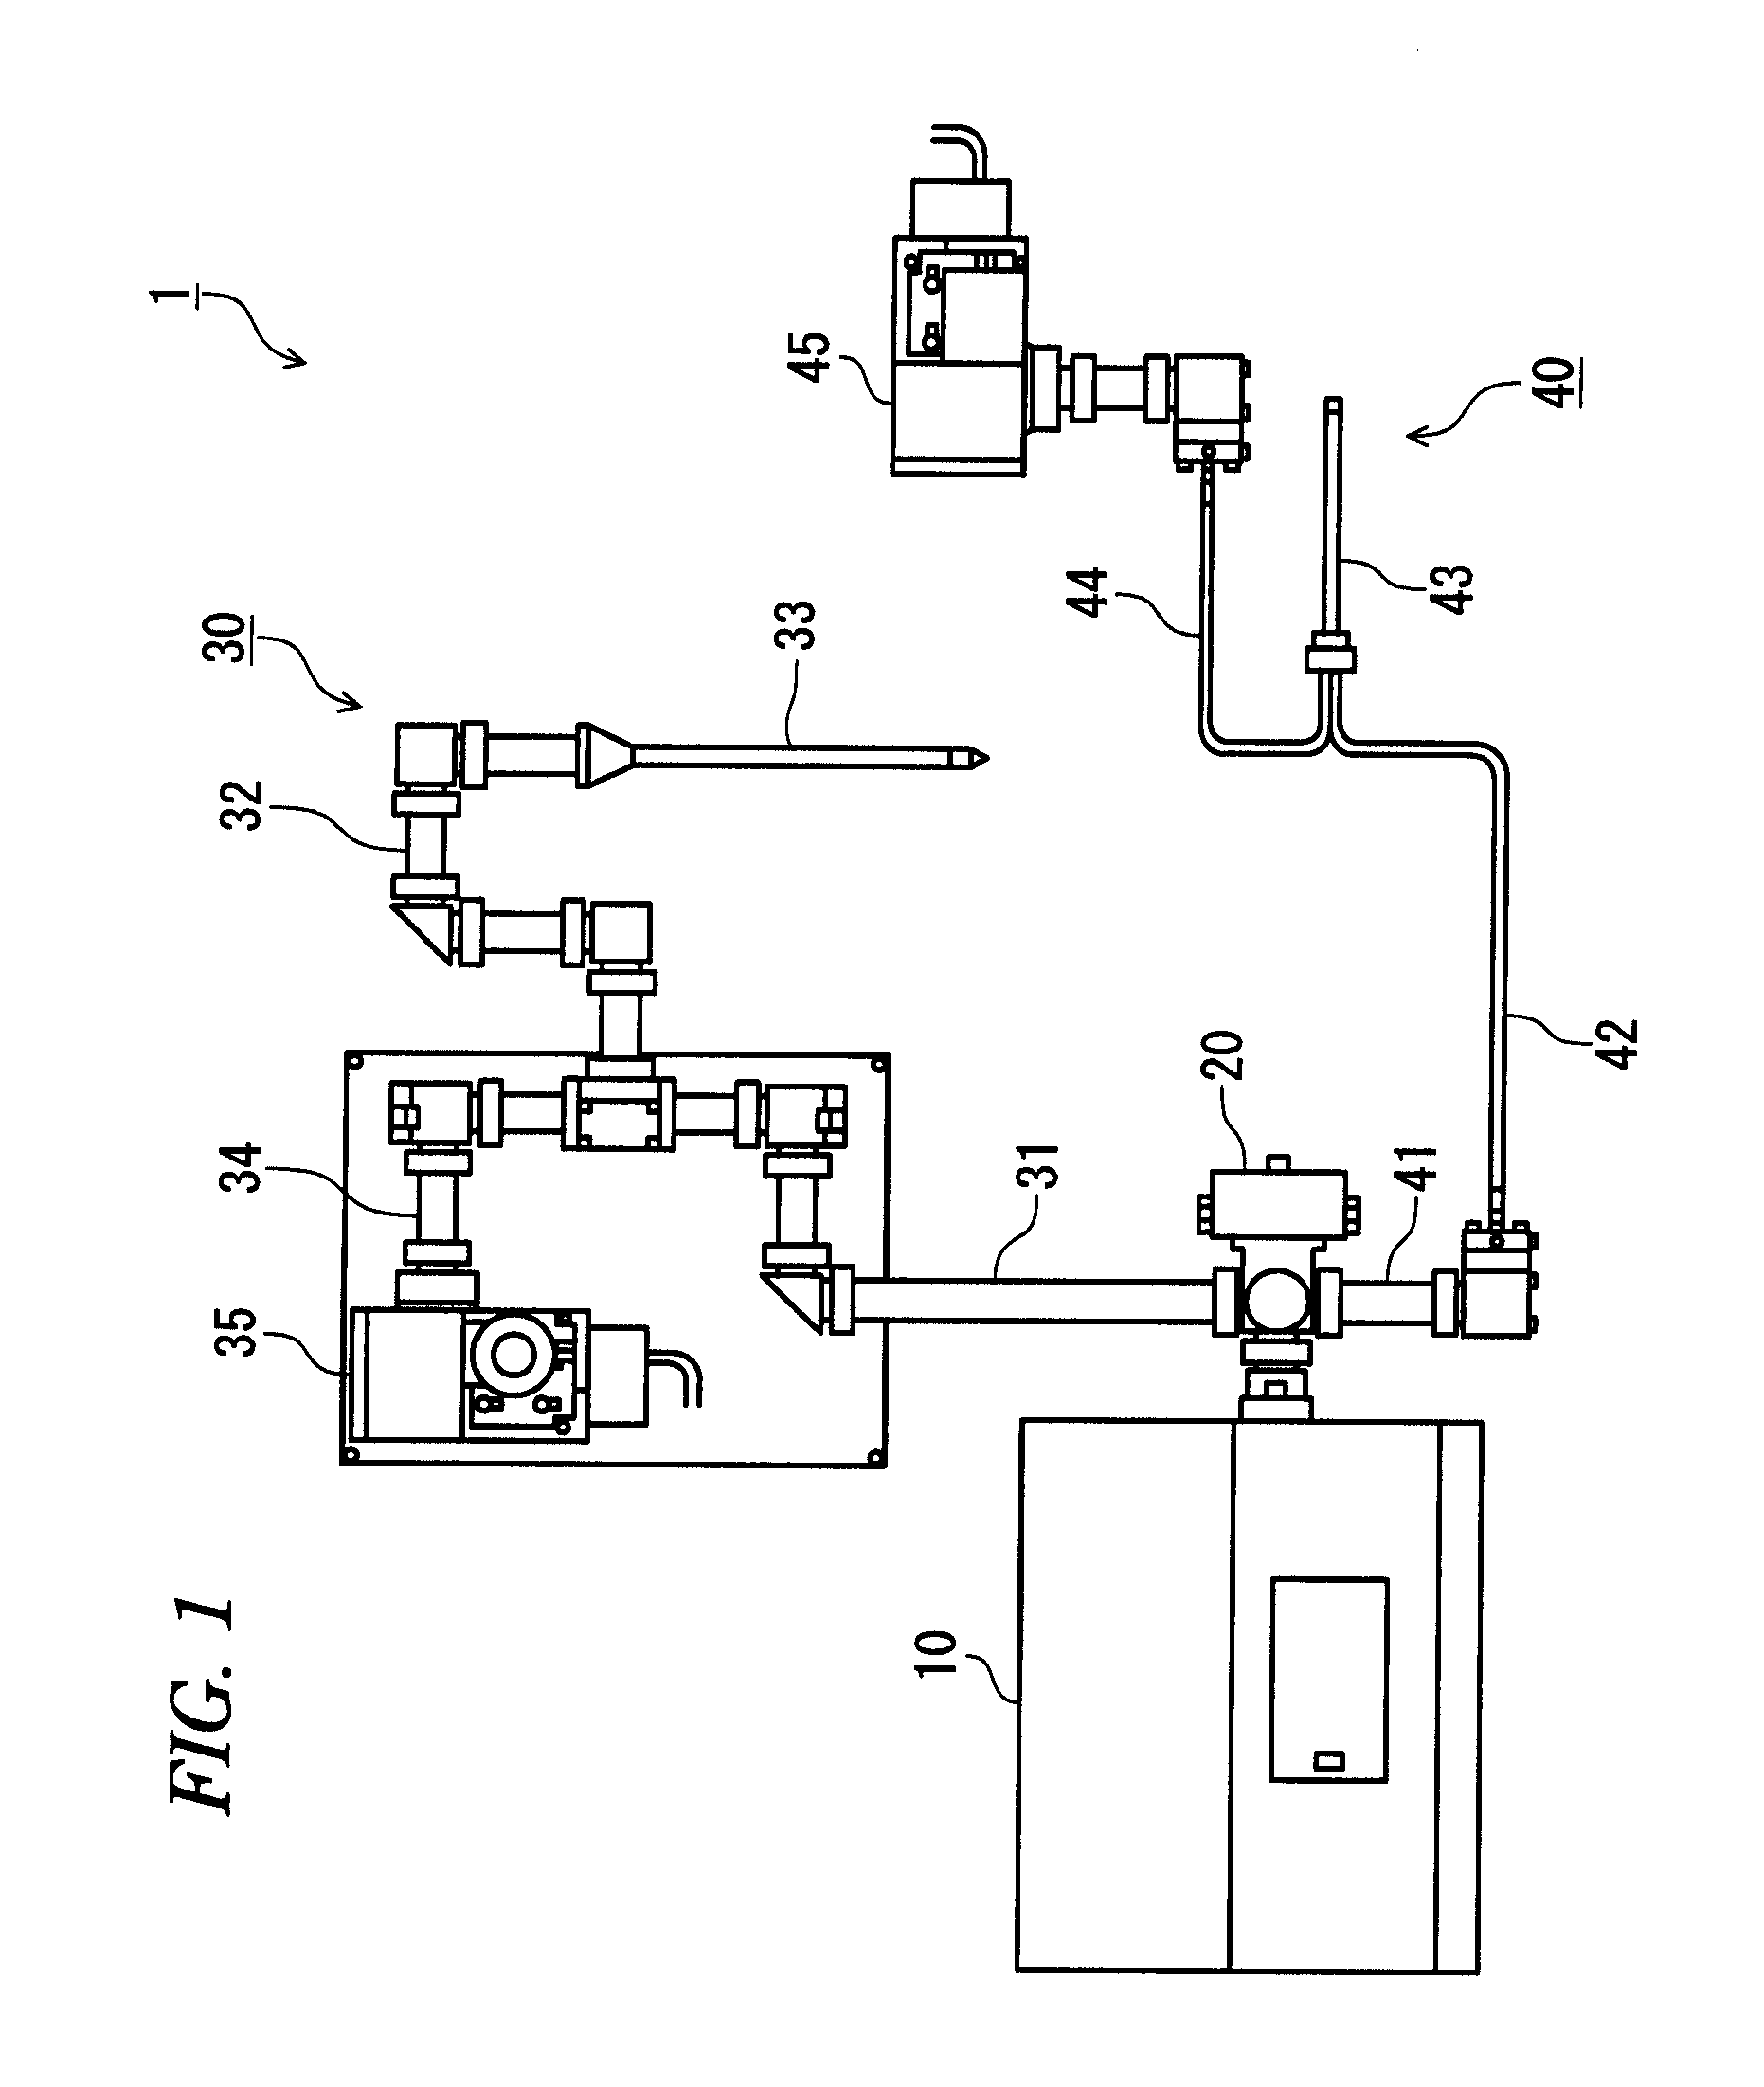
[0036]Hereinafter, a spectroscopic analyzer and a spectroscopic analysis method according to an embodiment of the invention will be described in detail with reference to the accompanying drawings. FIG. 1 is a view showing the configuration of a spectrum measuring section provided in the spectroscopic analyzer according to an embodiment of the invention. In addition, although the spectroscopic analyzer of the present embodiment is largely divided into a spectrum measuring section shown in FIG. 1 and an analysis section which performs analysis using the measurement result of the spectrum measuring section, the analysis section is not shown in FIG. 1.

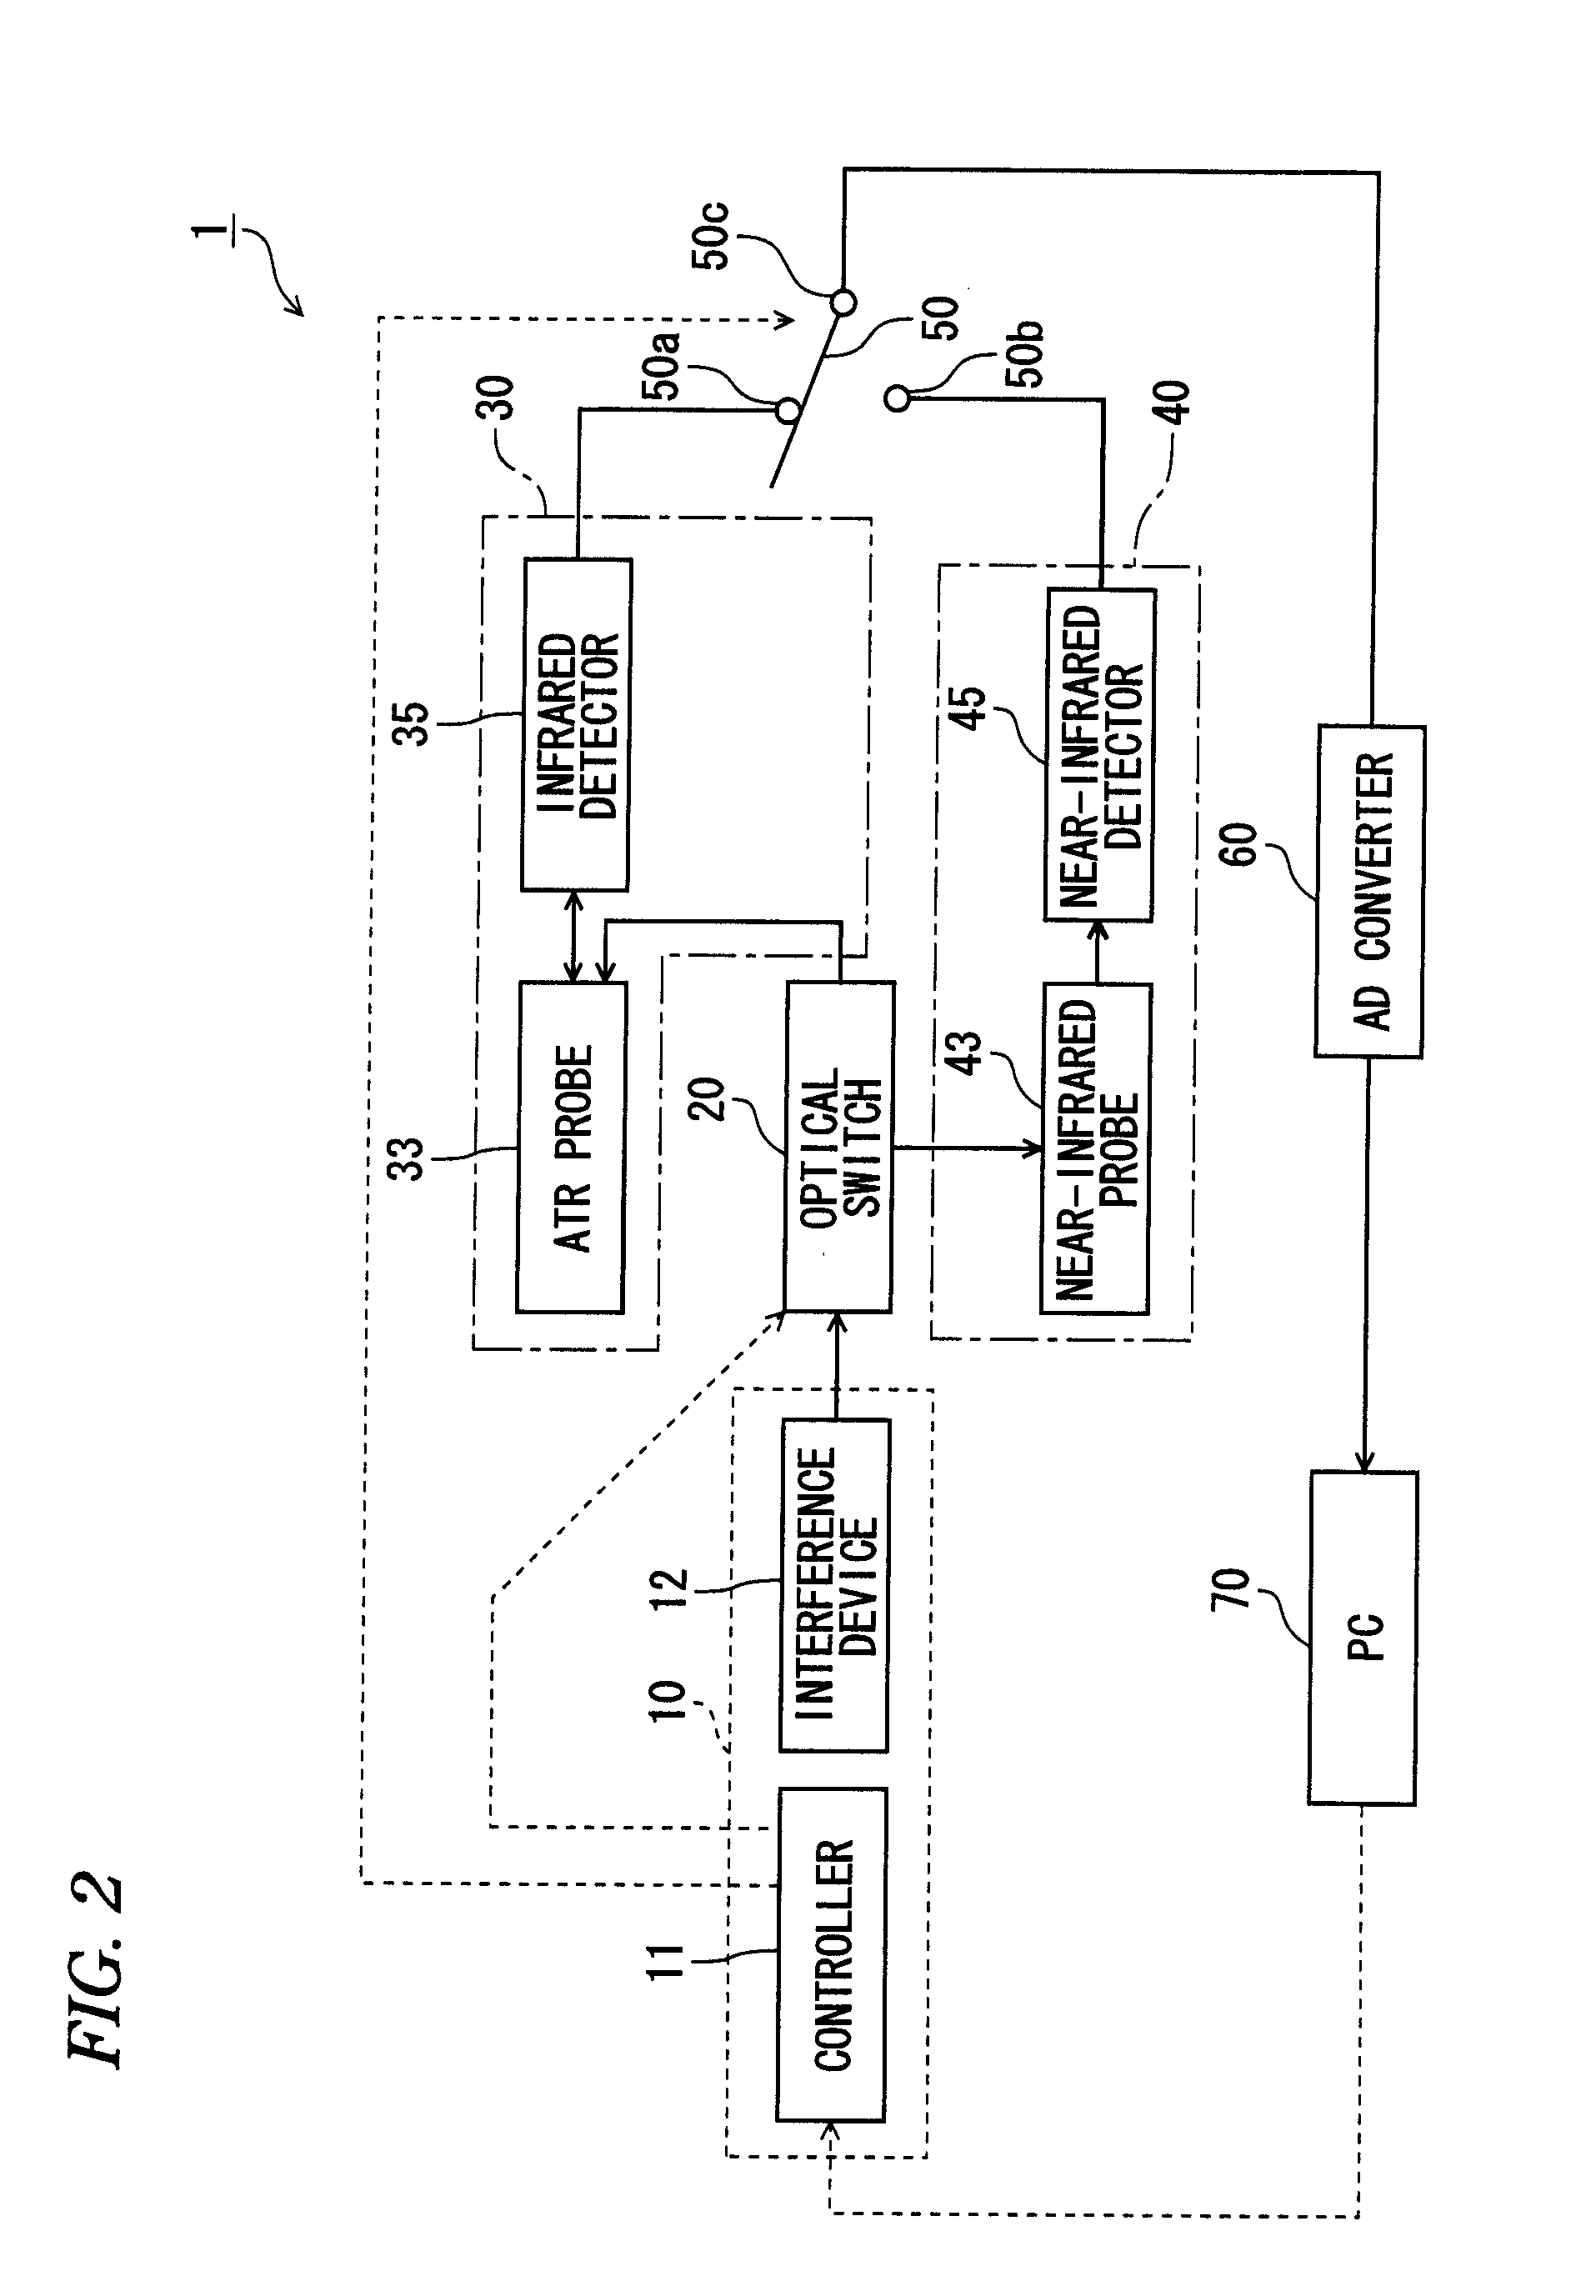
[0037]As shown in FIG. 1, the spectrum measuring section provided in the spectroscopic analyzer 1 of the present embodiment includes an FTIR (Fourier Transform Infrared Spectroscopy) 10, an optical switch 20, an infrared spectrum measuring section 30 (second measurement section), and a near-infrared spectrum measuring section 40 (first mea...


PUM

PropertyMeasurementUnit
wavelengthaaaaaaaaaa
spectroscopic analyzeraaaaaaaaaa

Abstract

A spectroscopic analyzer includes a first measurement section which measures a spectrum of near-infrared region by irradiating a sample with near-infrared light, a second measurement section which measures a spectrum of infrared region by irradiating the sample with infrared light, and an analysis section which analyzes characteristics of the sample using the spectra measured by the first and second measurement sections. The analysis section includes a first calculation module which acquires a integrated spectrum by combining the spectrum of near-infrared region and the spectrum of infrared region, a second calculation module which calculates a difference spectrum of a reference spectrum measured in advance and the integrated spectrum, and a third calculation module which calculates correlation between the spectrum of near-infrared region and the spectrum of infrared region by performing a two-dimensional correlation operation using the difference spectrum.

Description

TECHNICAL FIELD[0001]The present disclosure relates to a spectroscopic analyzer and a spectroscopic analysis method using near-infrared light and infrared light.RELATED ART[0002]The spectroscopic analyzer is an apparatus which analyzes the characteristics (contained component and the like) of a sample from the spectrum acquired by irradiating the sample with near-infrared light (with a wavelength of 0.7 to 2.5 [μm]) or infrared light (with a wavelength of 2.5 to 25 [μm]). The spectroscopic analyzer using infrared light is characterized in that highly precise analysis can be performed because a sharp spectrum with good separation depending on sample components is acquired, but only a sample which is so thin that infrared light can be transmitted therethrough can be analyzed. In contrast, the spectroscopic analyzer using near-infrared light is characterized in that a thick sample can be analyzed as the transmittance of near-infrared light is higher than that of infrared light, but it ...

Claims


Application Information

Patent Timeline
Patent Type & Authority Applications(United States)
IPC IPC(8): G06F19/00G01J3/28G01N21/35G01N21/3577G01N21/359
CPCG01J3/457G01N21/359G01N2021/3595G01N21/8507G01N2021/3155G01N21/552
Inventor WATARI, MASAHIROOZAKI, YUKIHIRO
Owner YOKOGAWA ELECTRIC CORP
Why Eureka
Try Eureka