
Method and system for segmenting a brain image

a brain image and image technology, applied in image analysis, image enhancement, instruments, etc., can solve the problems of affecting the image quality of ct images, increasing their variability, and usually a loss of contrast between gray and white matter, and achieve the effect of reliable discrimination of the csf region

Inactive Publication Date: 2012-04-26
AGENCY FOR SCI TECH & RES
View PDF1 Cites 18 Cited by
  • Summary
  • Abstract
  • Description
  • Claims
  • Application Information

AI Technical Summary

Benefits of technology

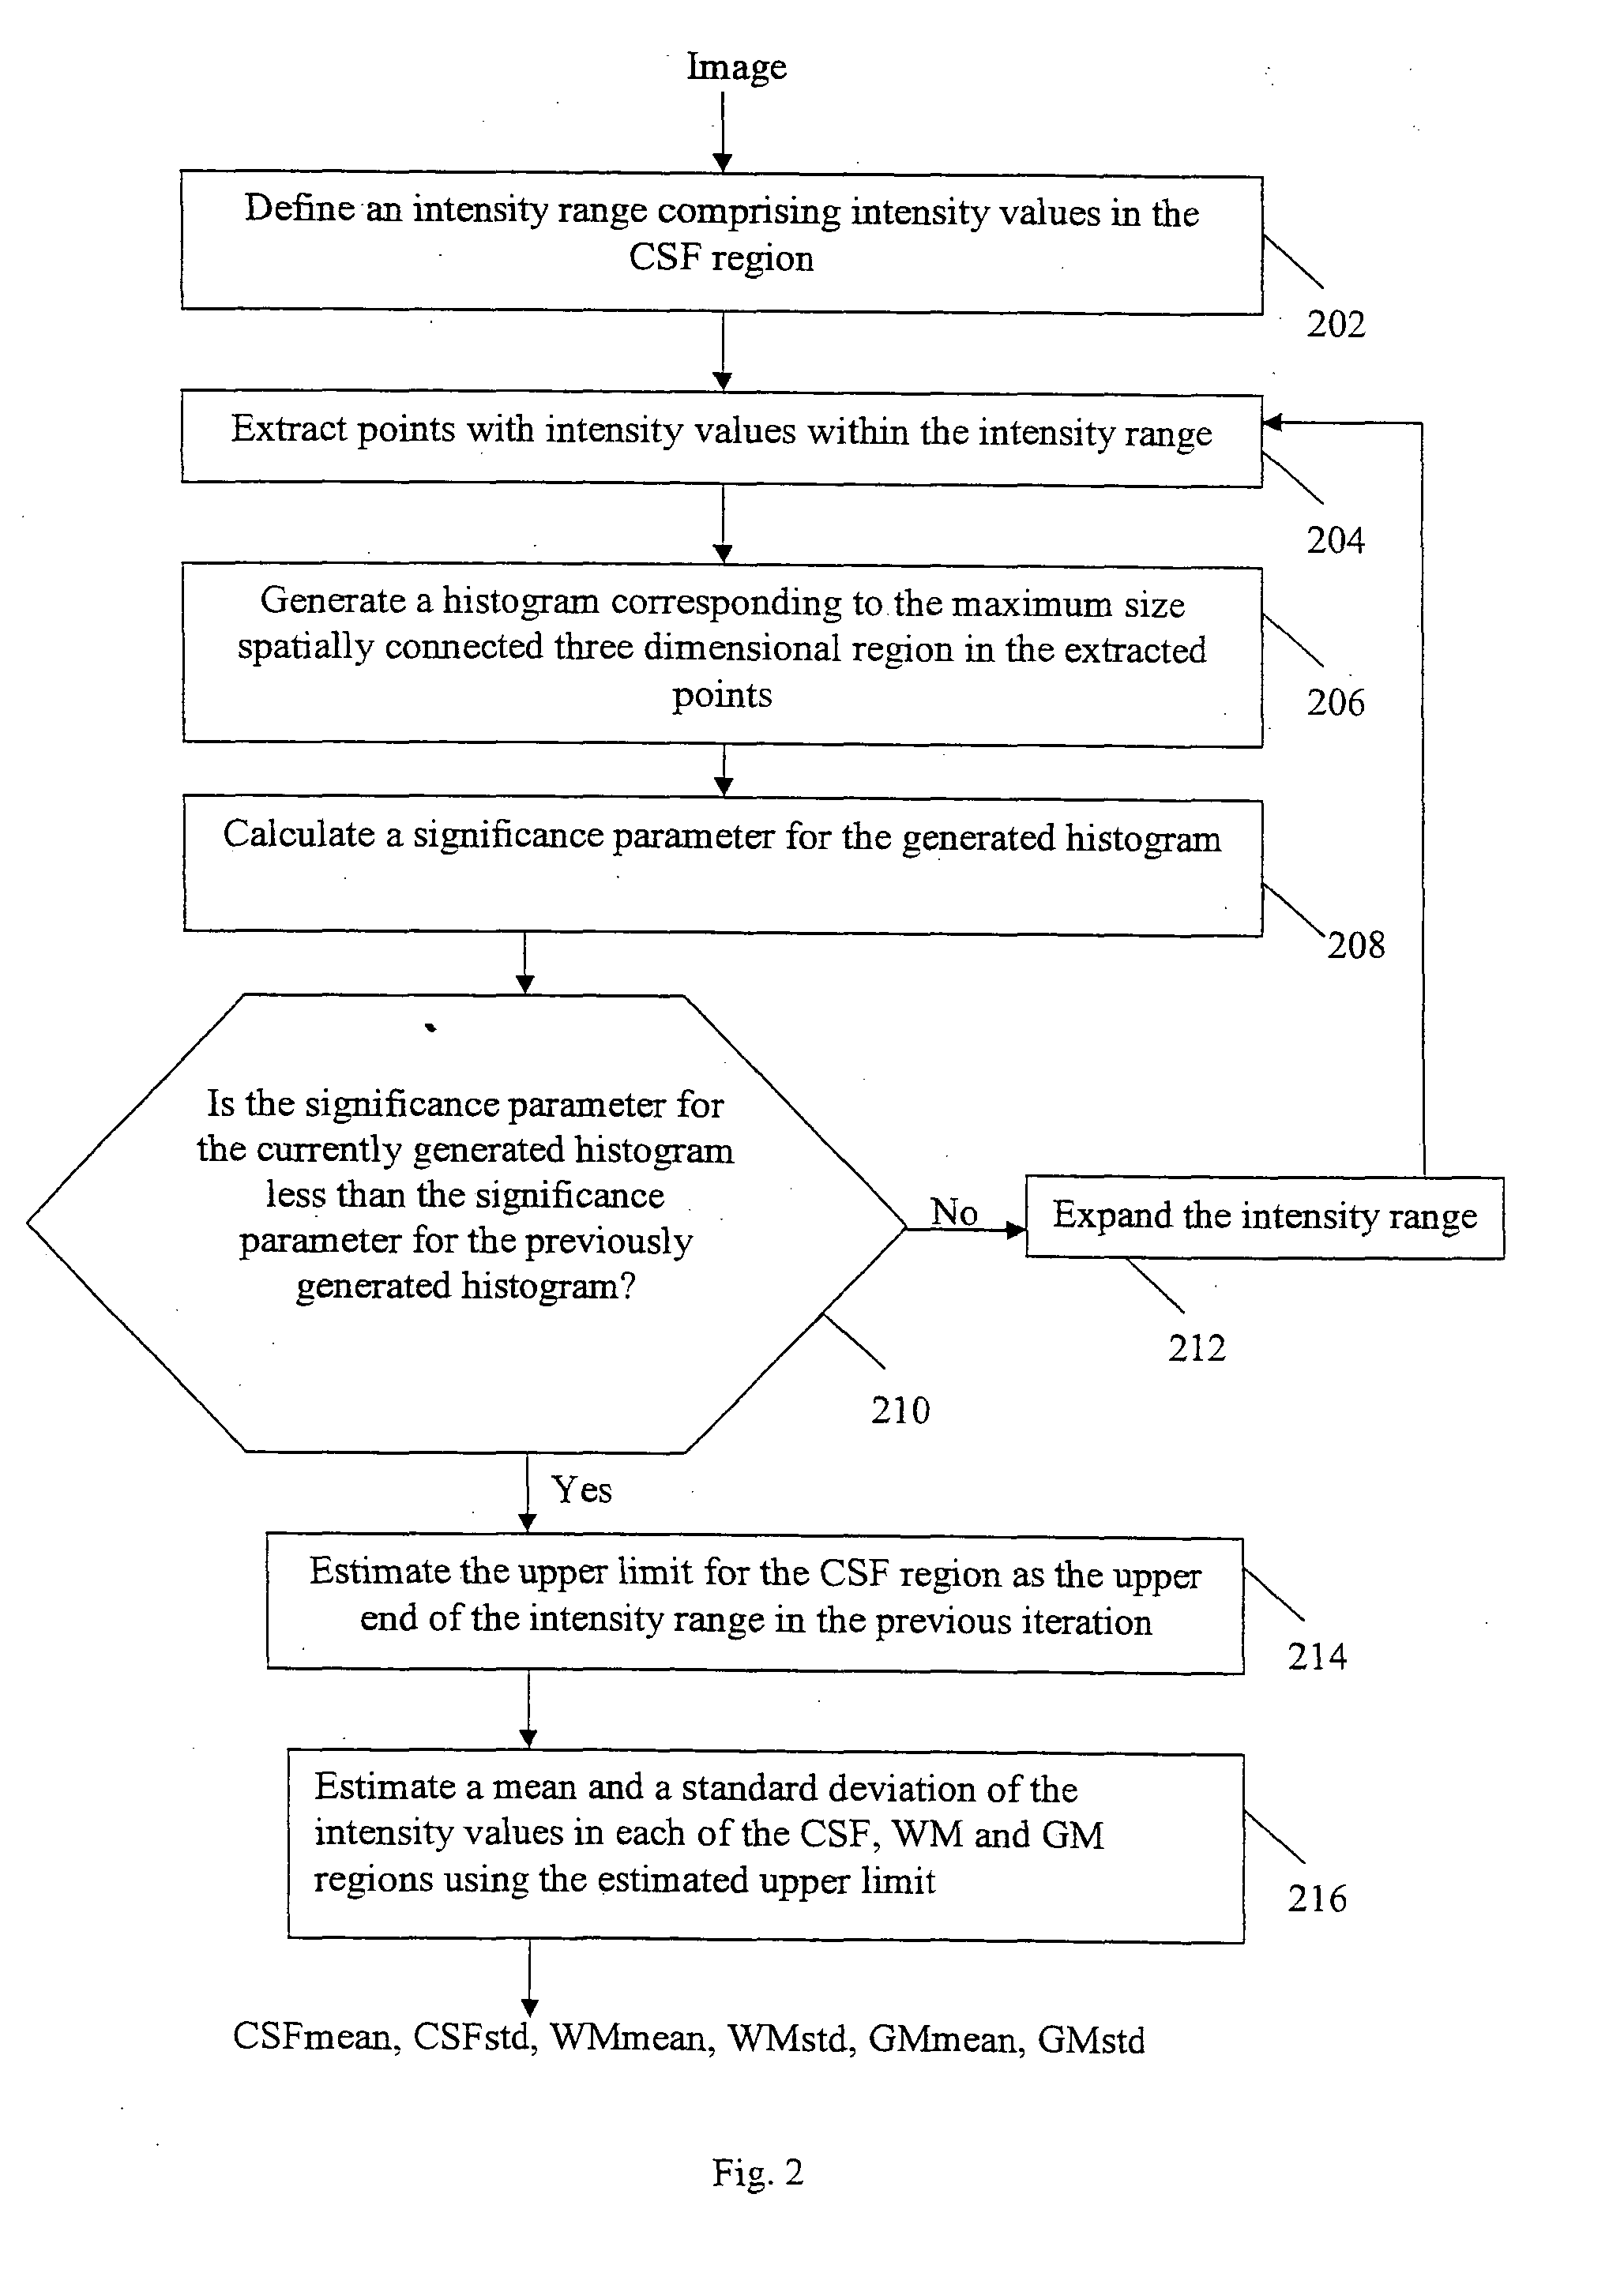
[0007]In general terms, the present invention proposes, as part of a method for segmenting a brain image composed of intensity values at multiple points, estimating an upper limit for the intensity values of a CSF region in the image, by selecting a value for this upper limit such that the points of the image having an intensity value less than this upper limit and greater than zero include a subset of the points which form a spatially connected group of maximum size and which have a peaked intensity distribution. In other words, the invention exploits both the expected spatial distribution and expected intensity distribution of the CSF region. This makes it possible for the method to provide reliable discrimination of the CSF region even in CT images with poor image quality.

Problems solved by technology

Unfortunately, inherent instrumentation effects in CT images often affect the image quality of the CT images and increase their variability.
Further, due to infarction, there is usually a loss of contrast between gray and white matter in CT images [Choi et al.
Moreover, the contrast between gray matter (GM) and white matter (WM) is very low, hence increasing the difficulty in segmenting the CT images.
Thus, simply using hard coded threshold values to segment CT images can lead to substantial errors.
However, the method in Hu et al 2007 uses arbitrary parameters and has no quantitative measure of performance.
Moreover, such segmentation algorithms have their limitations when used on an organ composed of different tissue types (e.g. the brain).
In addition, although genetic algorithms have been proposed for segmentation purposes, there are often issues with the convergence criteria and the huge computation time of these algorithms [Maulik 2009].
Also, most commercially available algorithms are not developed with CT images in mind due to the poor image quality of CT images.

Method used


Image

  • Method and system for segmenting a brain image
  • Method and system for segmenting a brain image
  • Method and system for segmenting a brain image

Examples


Embodiment Construction

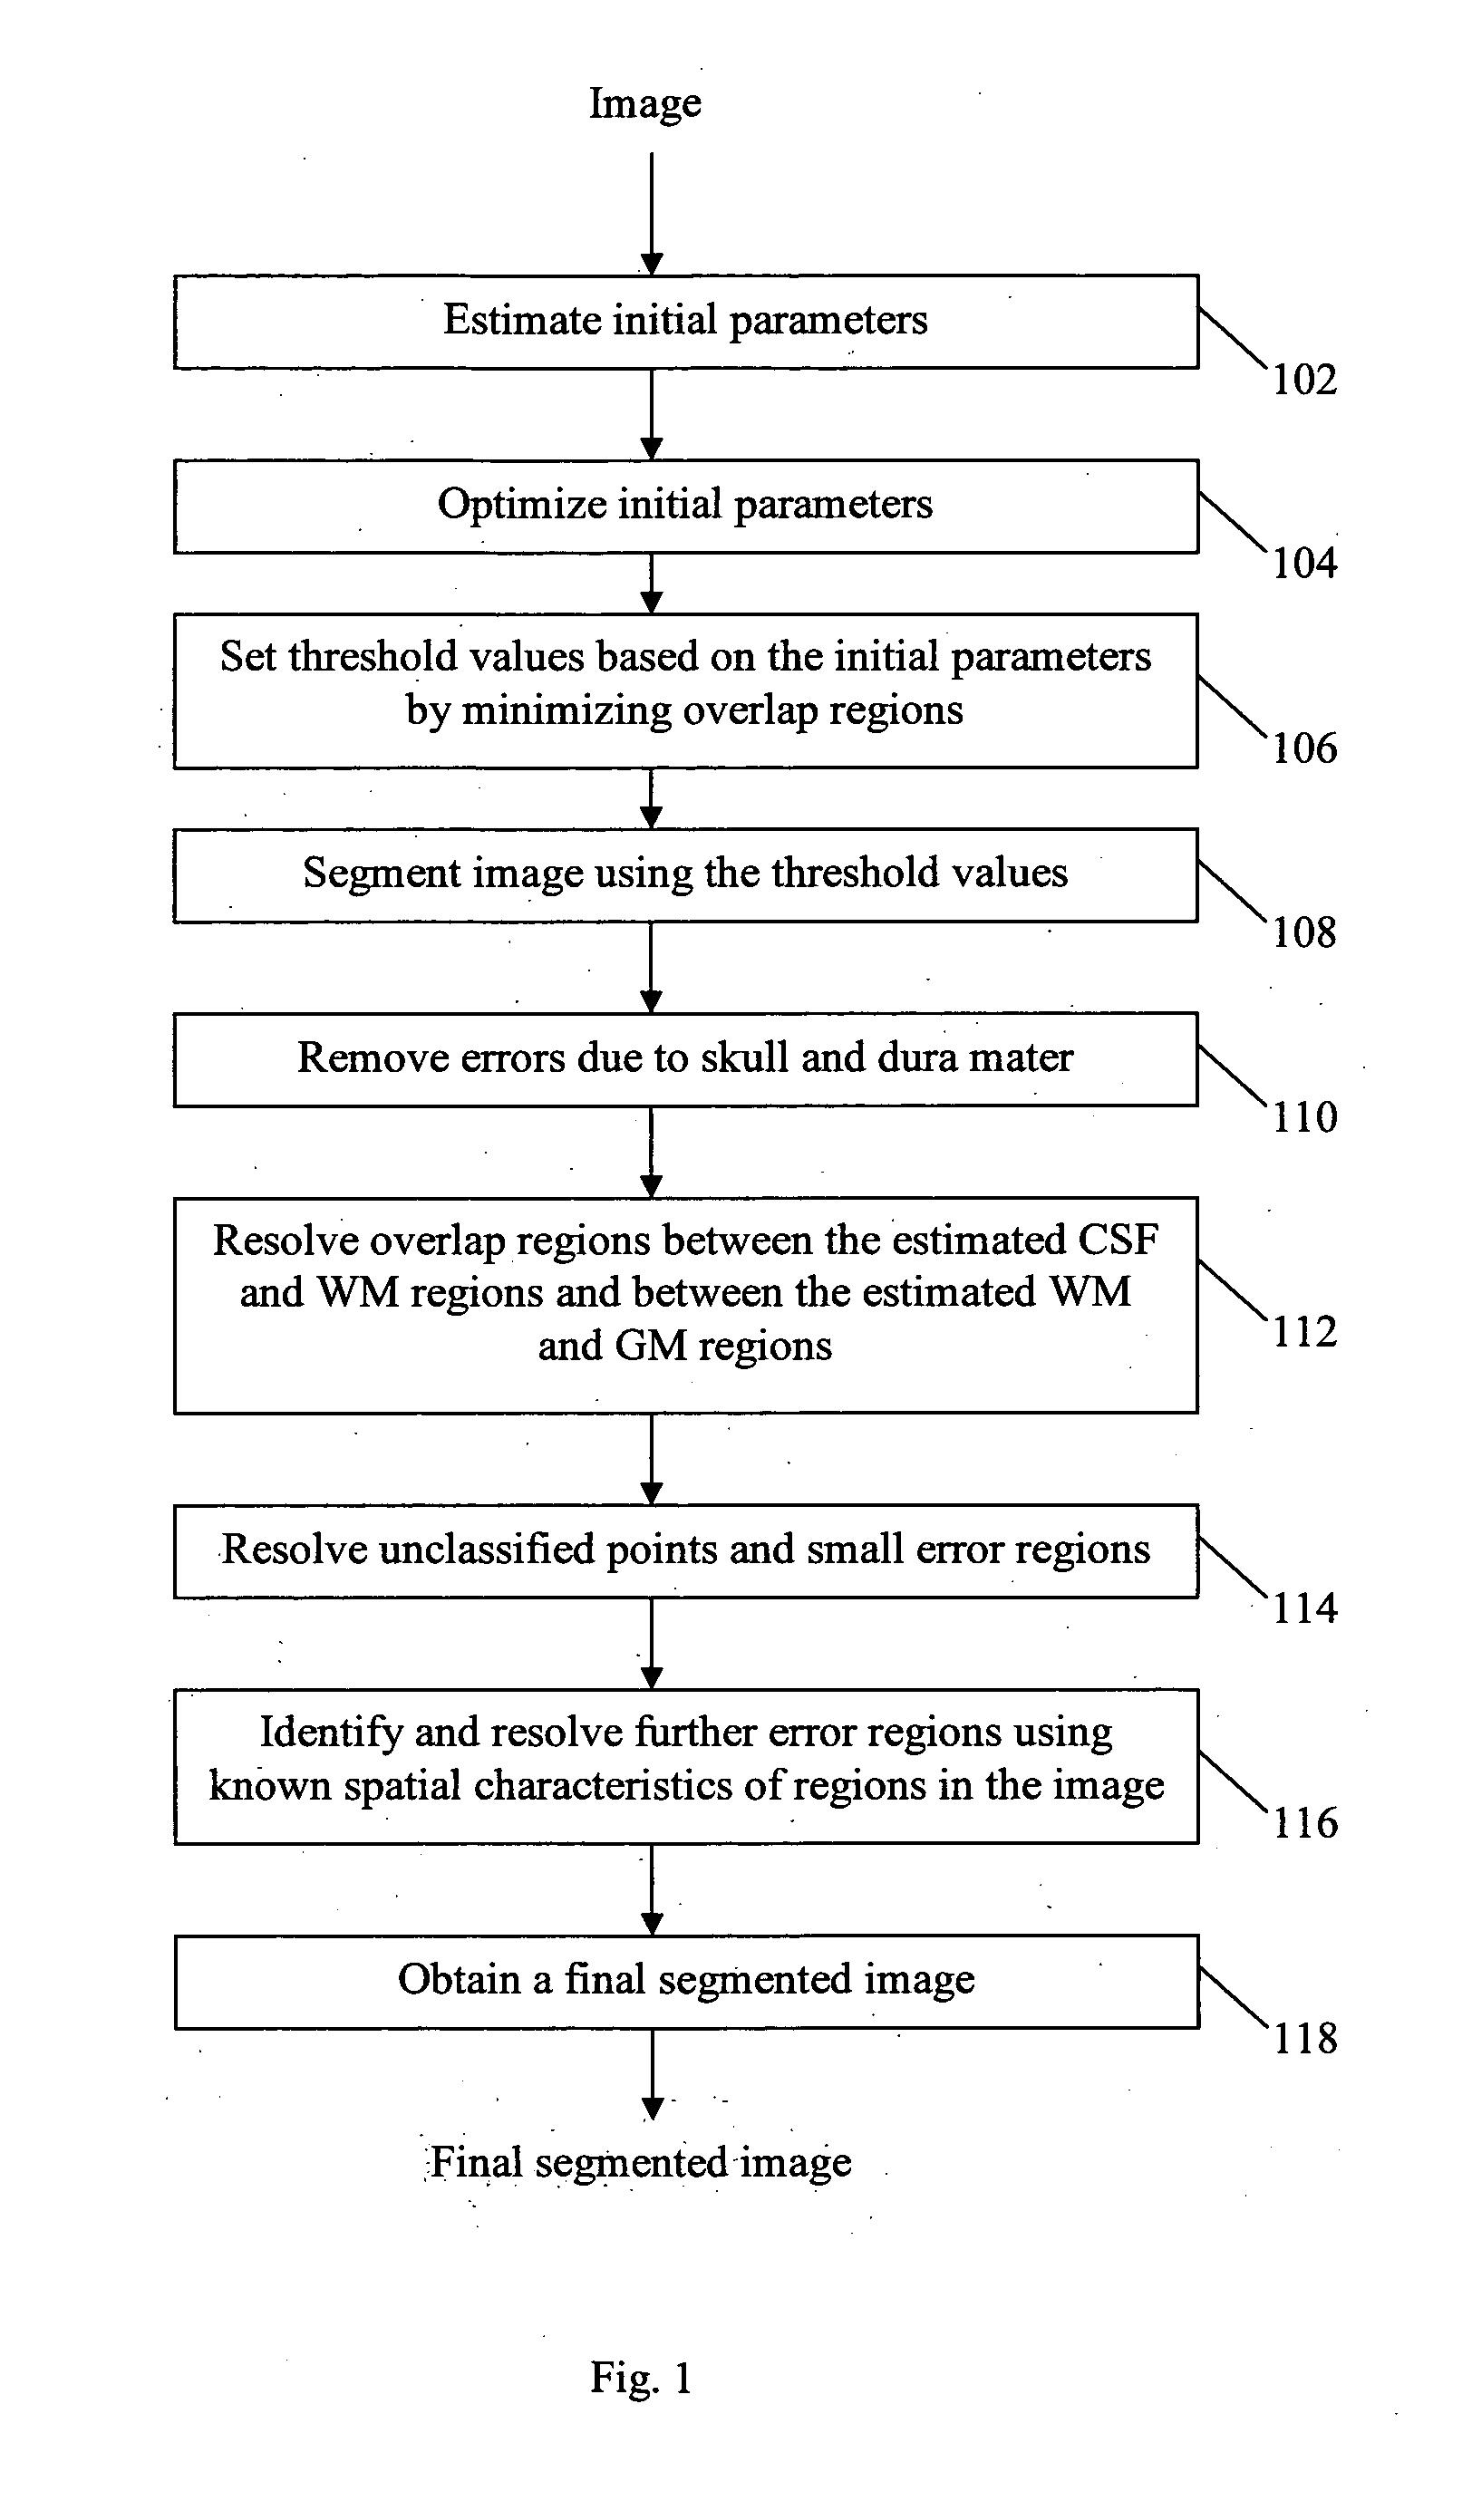
[0028]Referring to FIG. 1, the steps are illustrated of a method 100 which is an embodiment of the present invention, and which segments a brain image into a CSF region, a WM region and a GM region. The brain image comprises intensity values at respective points and is a 3D image since method 100 exploits the fact that in three-dimension and within a parenchyma region in a brain, the ventricle region is the largest connected component. The intensity values may be in Hounsfield units, or may be converted into Hounsfield units as a first step of the method. The points may be voxels of the 3D image.

[0029]The brain image which is the input to method 100 may be a CT brain image. However, the brain image may be of a different image modality (e.g. an MRI image). In step 102, a set of initial parameters are estimated and in step 104, some of the estimated initial parameters are optimized. Next, in step 106, threshold values are set based on the estimated initial parameters and in step 108, ...


PUM


Abstract

A method is proposed for segmenting a brain image into a CSF region, a WM region and a GM region. An upper limit for the intensity values of a CSF region in the image is estimated such that the points of the image having an intensity less than this upper limit include a subset of the points which form a spatially connected group and which have a peaked intensity distribution. In other words, the invention exploits both the expected spatial distribution and expected intensity distribution of the CSF region. This makes it possible for the method to provide reliable discrimination of the CSF region even in CT images with poor image quality. Various methods are proposed for using the upper limit, and for improving the segmentation accuracy.

Description

FIELD OF THE INVENTION[0001]The present invention relates to a method and system for segmenting a brain image. The segmented brain image may in turn be used for identifying stroke in a patient.BACKGROUND OF THE INVENTION[0002]Accurate gray and white matter segmentation of CT (Computer Tomography) images is important in the estimation of cerebrospinal fluid, white and gray matter regions, which in turn is useful in the prediction of clinical outcomes. For example, when identifying stroke from CT scan images, it is very important that the cerebrospinal fluid (CSF) and the white matter (WM) intensity thresholds are accurately identified. This is because, the infract intensity range is close to the intensity ranges of the hypo-dense WM (i.e. lower values of intensity amongst WM intensities) and the hyper-dense CSF (i.e. higher values of intensity amongst CSF intensities).[0003]Unfortunately, inherent instrumentation effects in CT images often affect the image quality of the CT images an...

Claims


Application Information

Patent Timeline
IPC IPC(8): G06K9/34G06V10/28
CPCG06K9/38G06T7/0081G06T7/0087G06T2207/10072G06T2207/20148G06T2207/30016G06T2207/10081G06T7/11G06T7/143G06T7/136G06V10/28
Inventor GUPTA, VARSHANOWINSKI, WIESLAW L.
Owner AGENCY FOR SCI TECH & RES
Learn More