Methods for automatic peak finding in calorimetric data

a technology of automatic peak finding and calorimetric data, applied in the field of calorimetric data analysis, can solve problems such as introduction of user-related variability

Active Publication Date: 2012-05-31
MALVERN PANALYTICAL INC
View PDF0 Cites 2 Cited by
  • Summary
  • Abstract
  • Description
  • Claims
  • Application Information

AI Technical Summary

Benefits of technology

[0007]These and other features, aspects, and advantages of the present invention will become better understood when the following detailed description is read with reference to the accompanying drawings in which like characters represent like parts throughout the drawings, wherein:
[0008]FIG. 1 is a flow chart for an example method for automatic peak fittings for calorimetric data;
[0009]FIG. 2 is a flow chart for another example method for automatic peak fittings for calorimetric data;
[0010]FIG. 3 is a graph of an example of calorimetric data for automatic peak fitting; and
[0011]FIG. 4 is a graph for determining the RMS with regard to the number of peaks fitted in the calorimetric data of FIG. 3.

Problems solved by technology

However, in low-signal / high-noise data, multiple peaks become indistinguishable to the user, forcing the user to assume a single peak.
Further, a manual procedure also introduces user-related variability.

Method used


Image

  • Methods for automatic peak finding in calorimetric data
  • Methods for automatic peak finding in calorimetric data
  • Methods for automatic peak finding in calorimetric data

Examples


Embodiment Construction

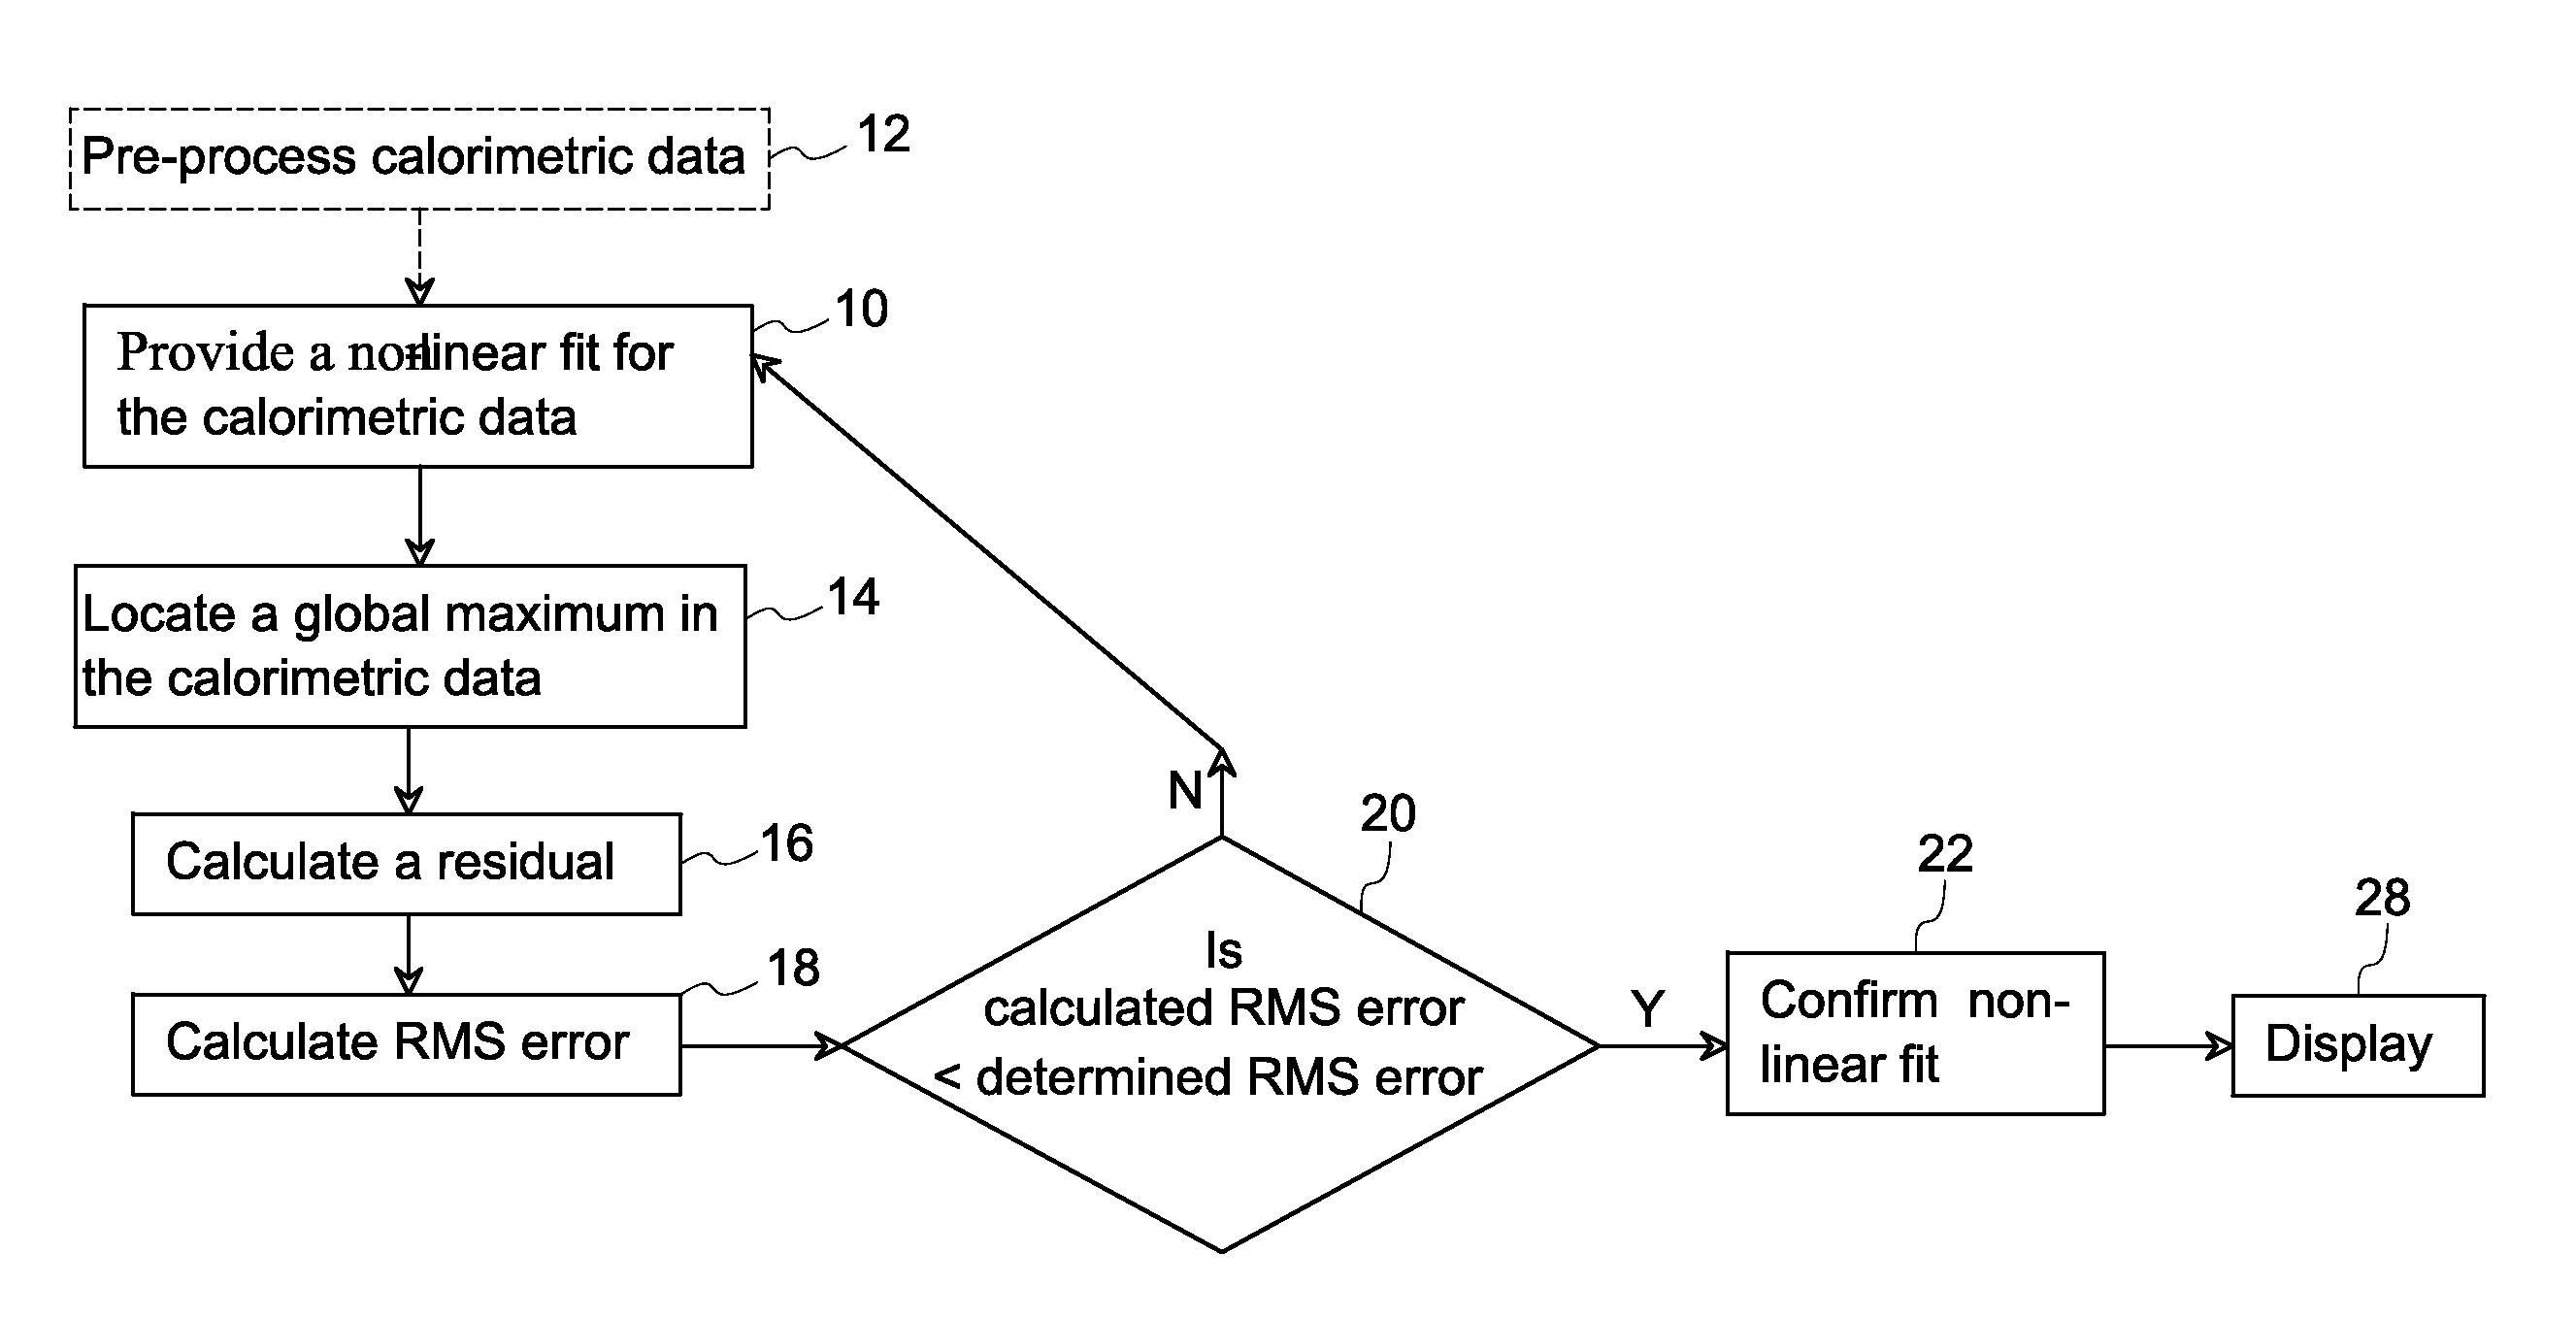
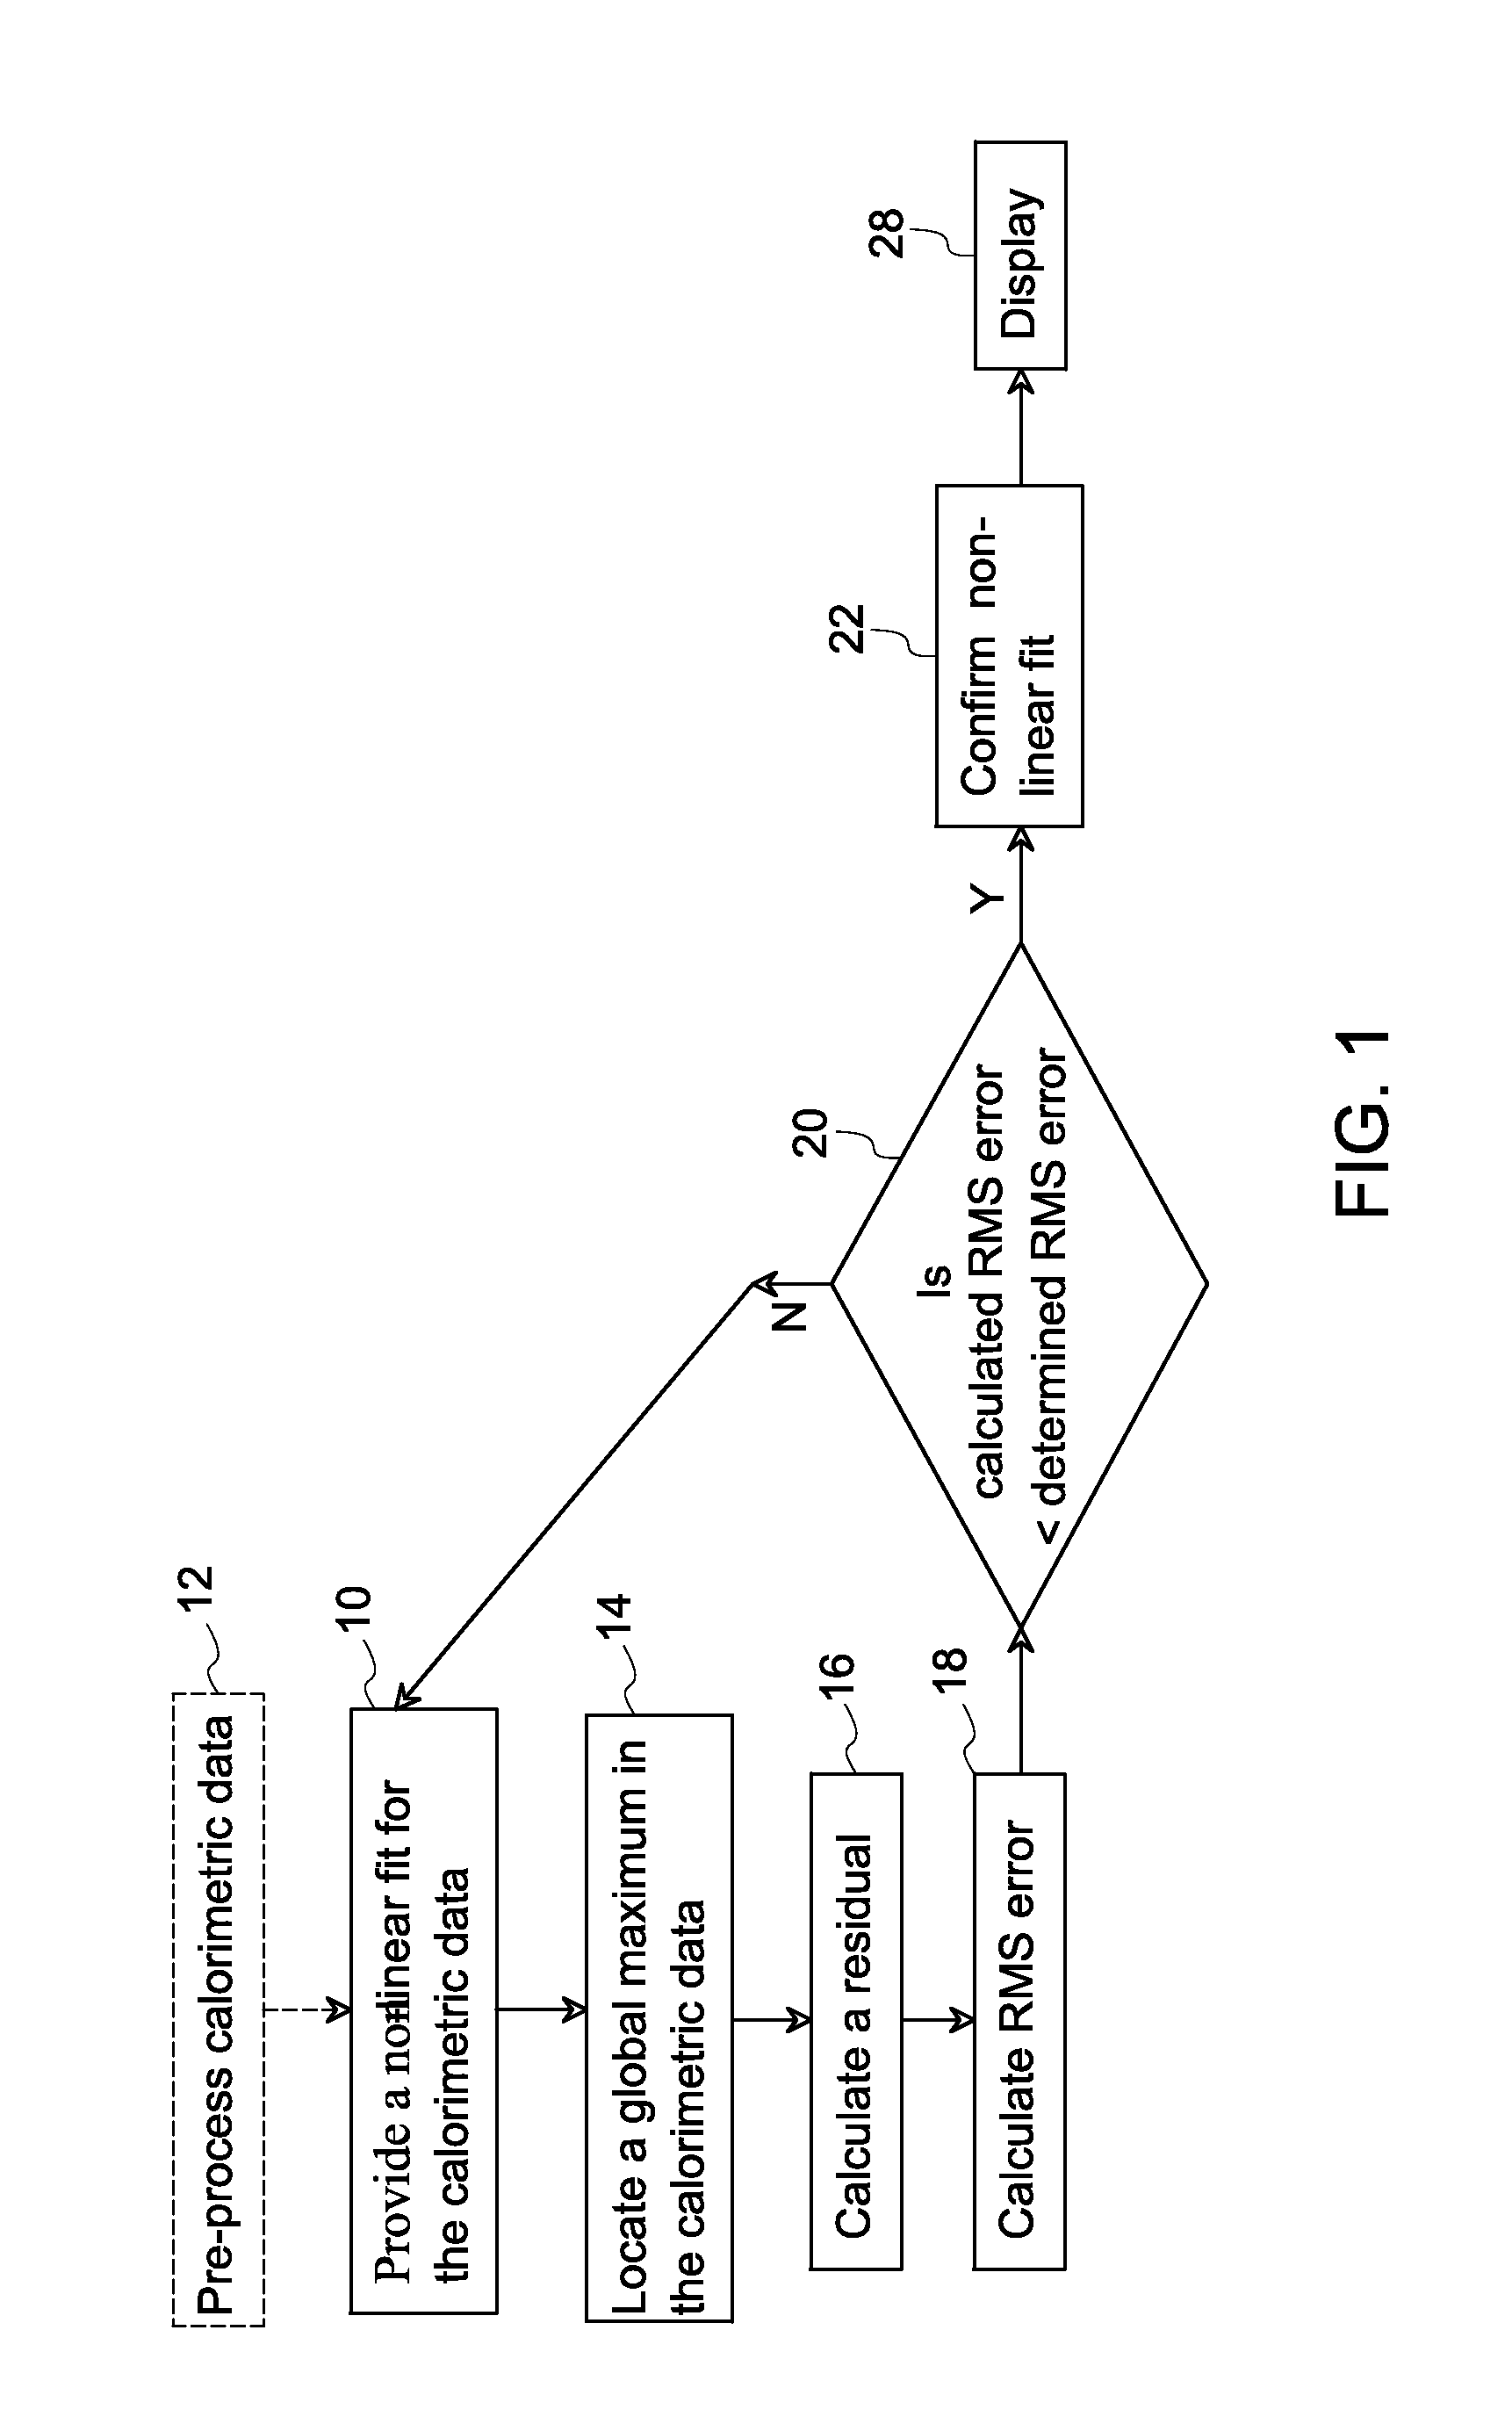
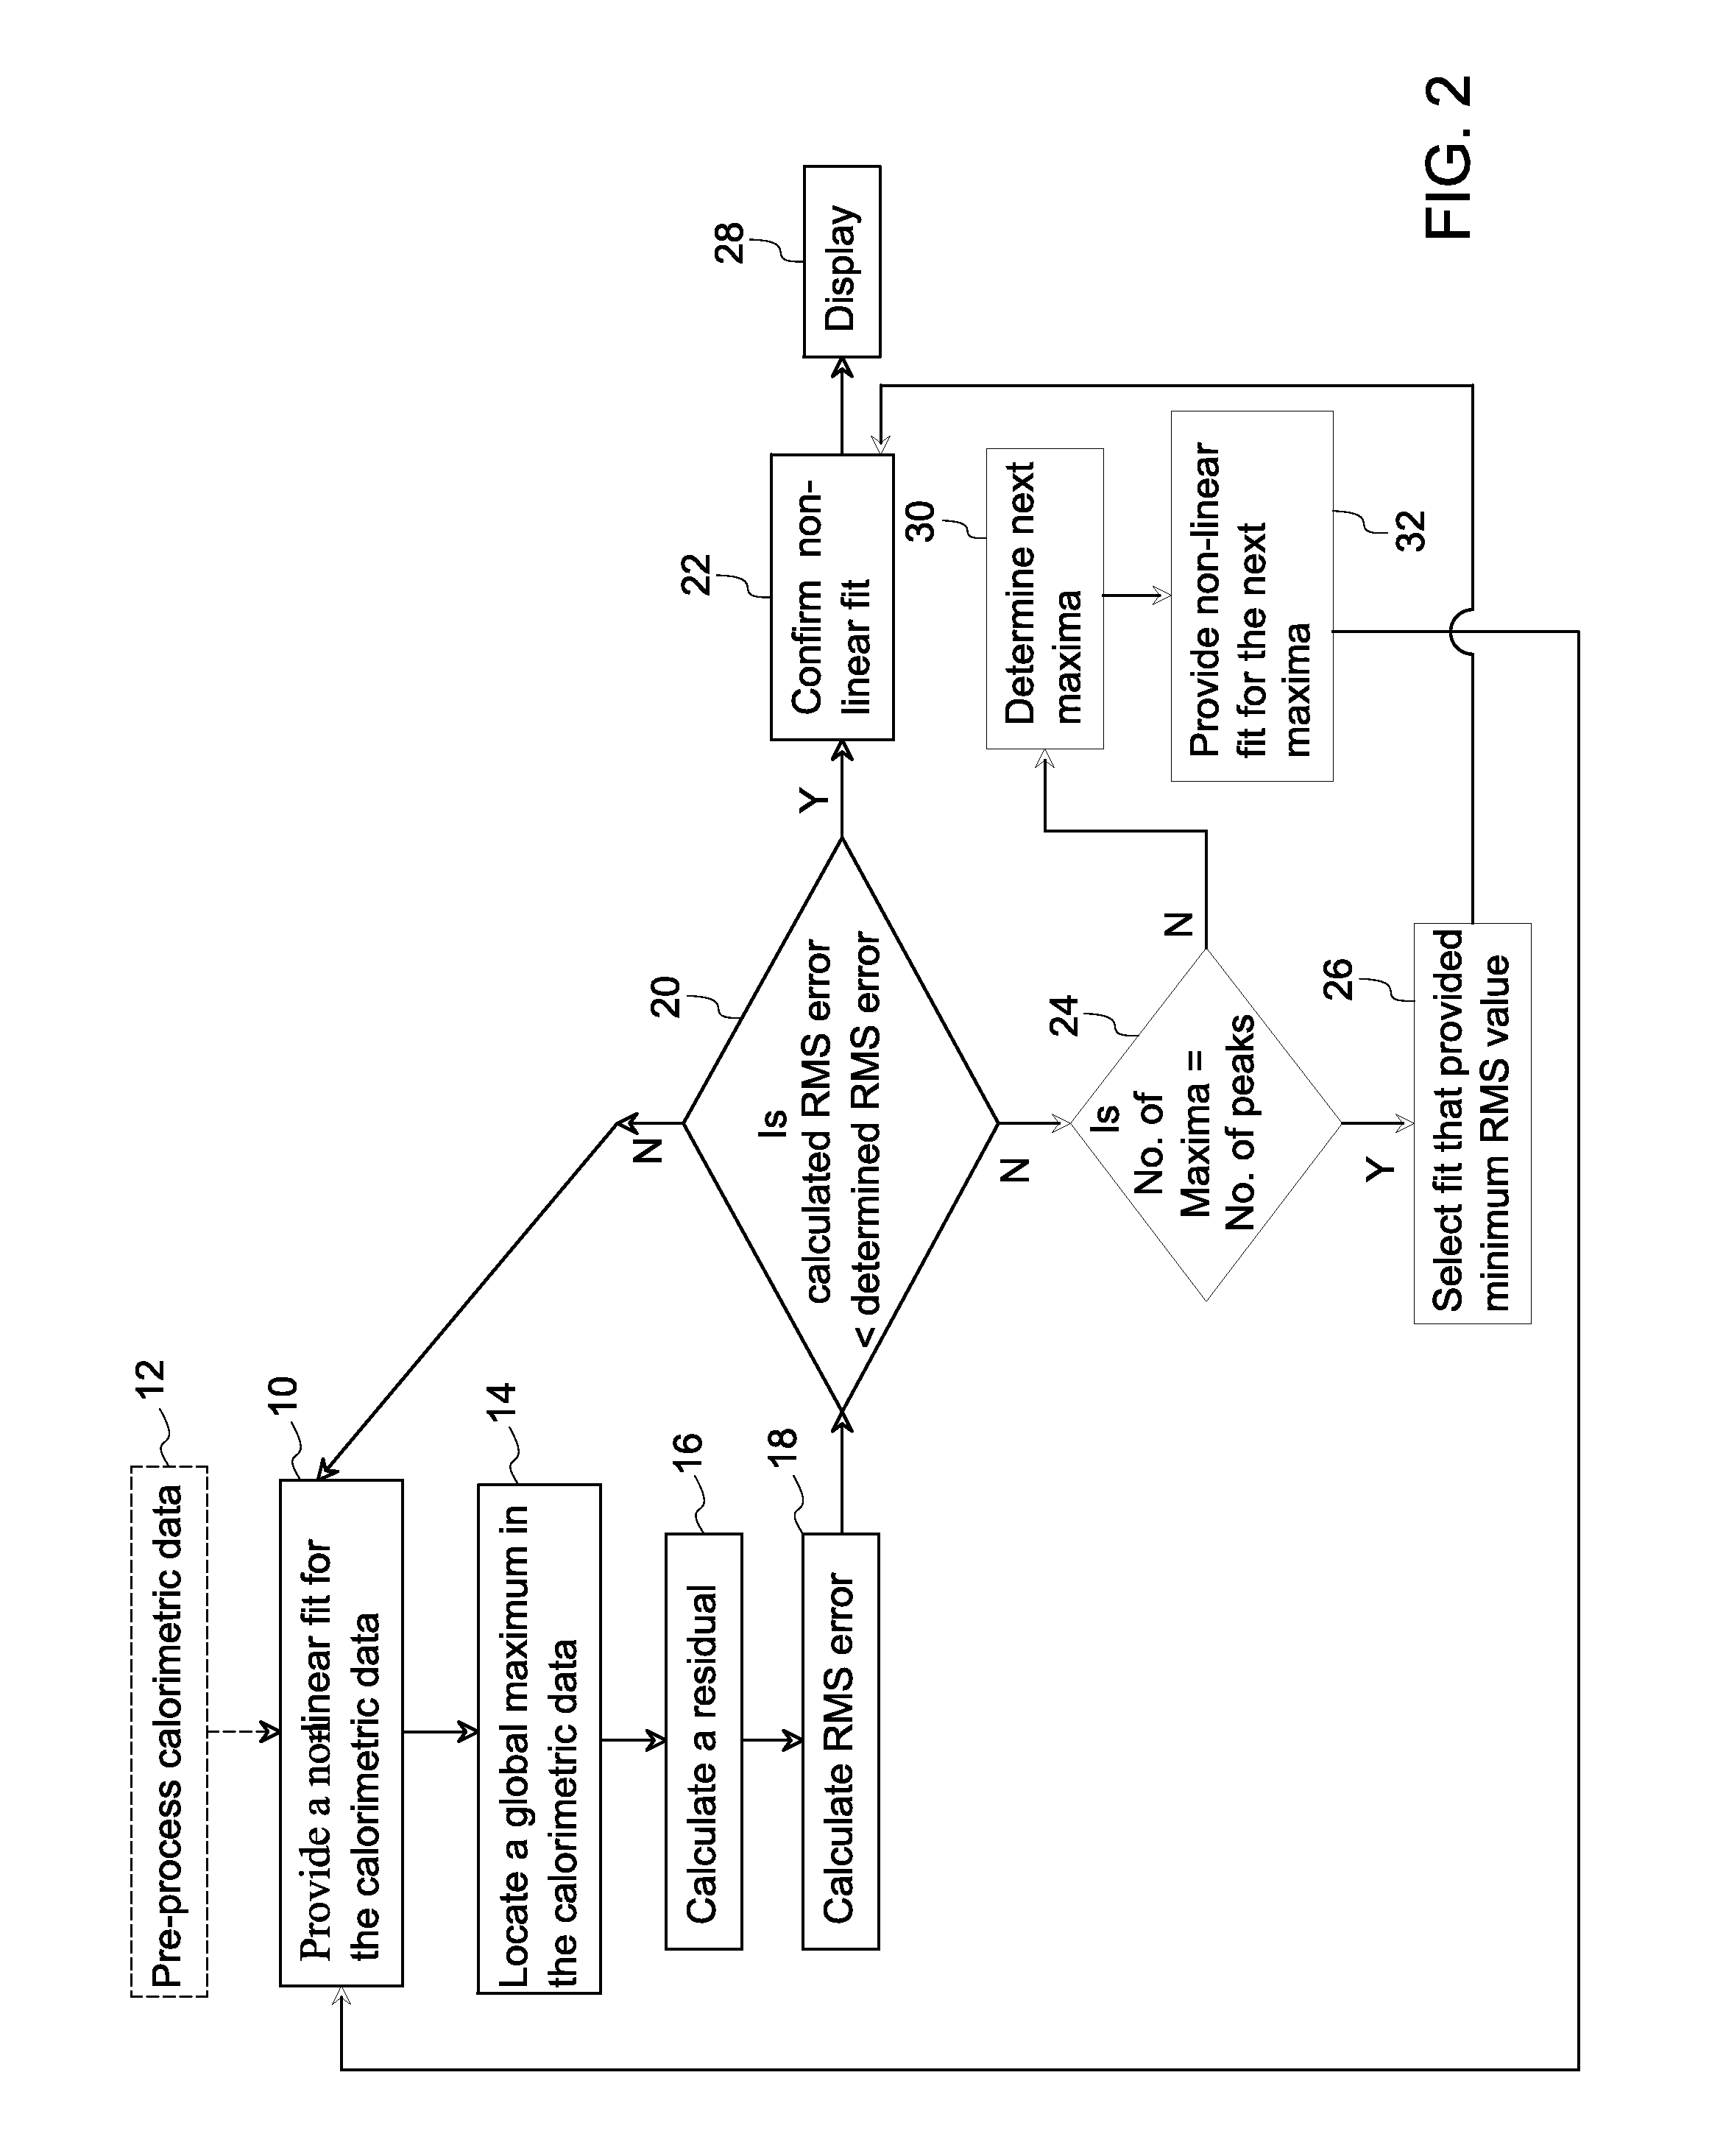
[0012]One or more examples of the methods of the invention relate to analyzing calorimetric data with minimal or no user input for determining the number and location of calorimetric peaks, including peaks that are not easily visible to human eye. In certain examples, the method for automatically determining a position of one or more calorimetric peaks comprises performing a non-linear fit for the position of the maximum peak, subtracting the non-linear fit from the calorimetric data to obtain a residual, calculating an error based on the residual; comparing the error with a predetermined error; and providing another non-linear fit if the error is greater than the predetermined error.

[0013]Although one or more examples of the methods are used to analyze calorimetric data, the methods may accommodate and model other data types having similar distribution. The peaks in the calorimetric data may be determined using the method where the peaks are otherwise invisible to a user or operato...


PUM

PropertyMeasurementUnit
molar entropy changeaaaaaaaaaa
residualaaaaaaaaaa
physical phenomenonaaaaaaaaaa

Abstract

In one embodiment, a method for automatically determining a position of one or more calorimetric peaks in a set of calorimetric data is provided. The method comprises a) providing a non-linear fit for the calorimetric data, b) calculating a residual by subtracting the non-linear fit from the calorimetric data, c) calculating an error based on the residual, d) comparing the error with a predetermined error, and e) providing another non-linear fit if the error is greater than the predetermined error.

Description

BACKGROUND[0001]The invention relates to methods for analyzing calorimetric data obtained from calorimetric instrument, and in particular, to methods for automatically identifying peaks and / or peak positions in calorimetric data.[0002]Differential scanning calorimetry (DSC) is a thermo-analytical technique that is used for thermal analysis. DSC is used across a range of applications, both as a routine quality test and as a research tool. For example, DSC may be used to study stability of compounds, security screening, drug analysis or drug analysis.[0003]In calorimetric applications, several peak-finding methods are used to identify multiple peaks in calorimetric data. Most of these methods use user-supplied initial guesses for the number of peaks and each peak location. In the manual procedure, the user visually evaluates the single-peak fit and decides whether an additional peak might exist. However, in low-signal / high-noise data, multiple peaks become indistinguishable to the use...

Claims


Application Information

Patent Timeline
Patent Type & Authority Applications(United States)
IPC IPC(8): G06F15/00G06F17/18G01K17/00
CPCG01N25/4813G06F17/18G01N25/4866G06K9/0053G06F2218/10
Inventor CHAN, HEATHER YEE-MEI
Owner MALVERN PANALYTICAL INC
Why Eureka
Try Eureka