Systems and methods for flood risk assessment

a flood risk and flood risk technology, applied in the field of risk assessment, can solve the problems of 1600 deaths, higher flood risk for properties located near flood sources with lower elevations, and cost more in property damage, so as to reduce the uncertainty of flood risk assessment

Inactive Publication Date: 2012-10-11
CORELOGIC SOLUTIONS
View PDF2 Cites 30 Cited by
  • Summary
  • Abstract
  • Description
  • Claims
  • Application Information

AI Technical Summary

Benefits of technology

[0009]In various embodiments, a flood frequency versus flood elevation curve for a property point may be derived using points of flood elevation for corresponding flood frequency derived from flood maps (e.g., geospatial flood risk zoning maps). The points may be statistically determined points that are verifiably discrete. The derived flood frequency versus flood elevation curves may be used to reduce the uncertainty in flood risk assessment (e.g., for insurance companies calculating policy premiums).
[0011]In various embodiments, flood elevation lines and / or flood boundaries (e.g., pre-existing or derived) may be adjusted to improve the accuracy of the derived points. For example, flood elevation lines may be adjusted on top of digital elevation maps to correlate the endpoints of the flood elevation line with points on the digital elevation map with similar elevations as the elevation associated with the flood elevation line. In some embodiments, other points on the flood elevation lines and / or other points on the flood map may be adjusted using the digital elevation map. In some embodiments, flood boundaries may also be corrected (e.g., by using the endpoints of corrected flood elevation lines).

Problems solved by technology

Worldwide, floods may be the number one cause of losses from natural events.
Flood risk may be a function of flood hazards (e.g., hurricanes and / or damage to a levee or dam), property exposure to these hazards, and the damage vulnerability of properties during a flood.
In the United States, floods may account for significant property and business interruption losses affecting thousands of enterprises each year, which may cost more in property damages than other natural disasters.
In 2005, the flooding from Hurricane Katrina alone caused over $40 billion in property damage, led to over 1600 deaths, and affected over 250,000 businesses according to the United States Census Bureau.
In an SFHA, properties located near flood sources with lower elevations may have a higher flood risk than properties near SFHAs boundaries at a higher elevation.
Beyond the 100 yr flood zone, properties may also suffer flood damage.

Method used


Image

  • Systems and methods for flood risk assessment
  • Systems and methods for flood risk assessment
  • Systems and methods for flood risk assessment

Examples


Embodiment Construction

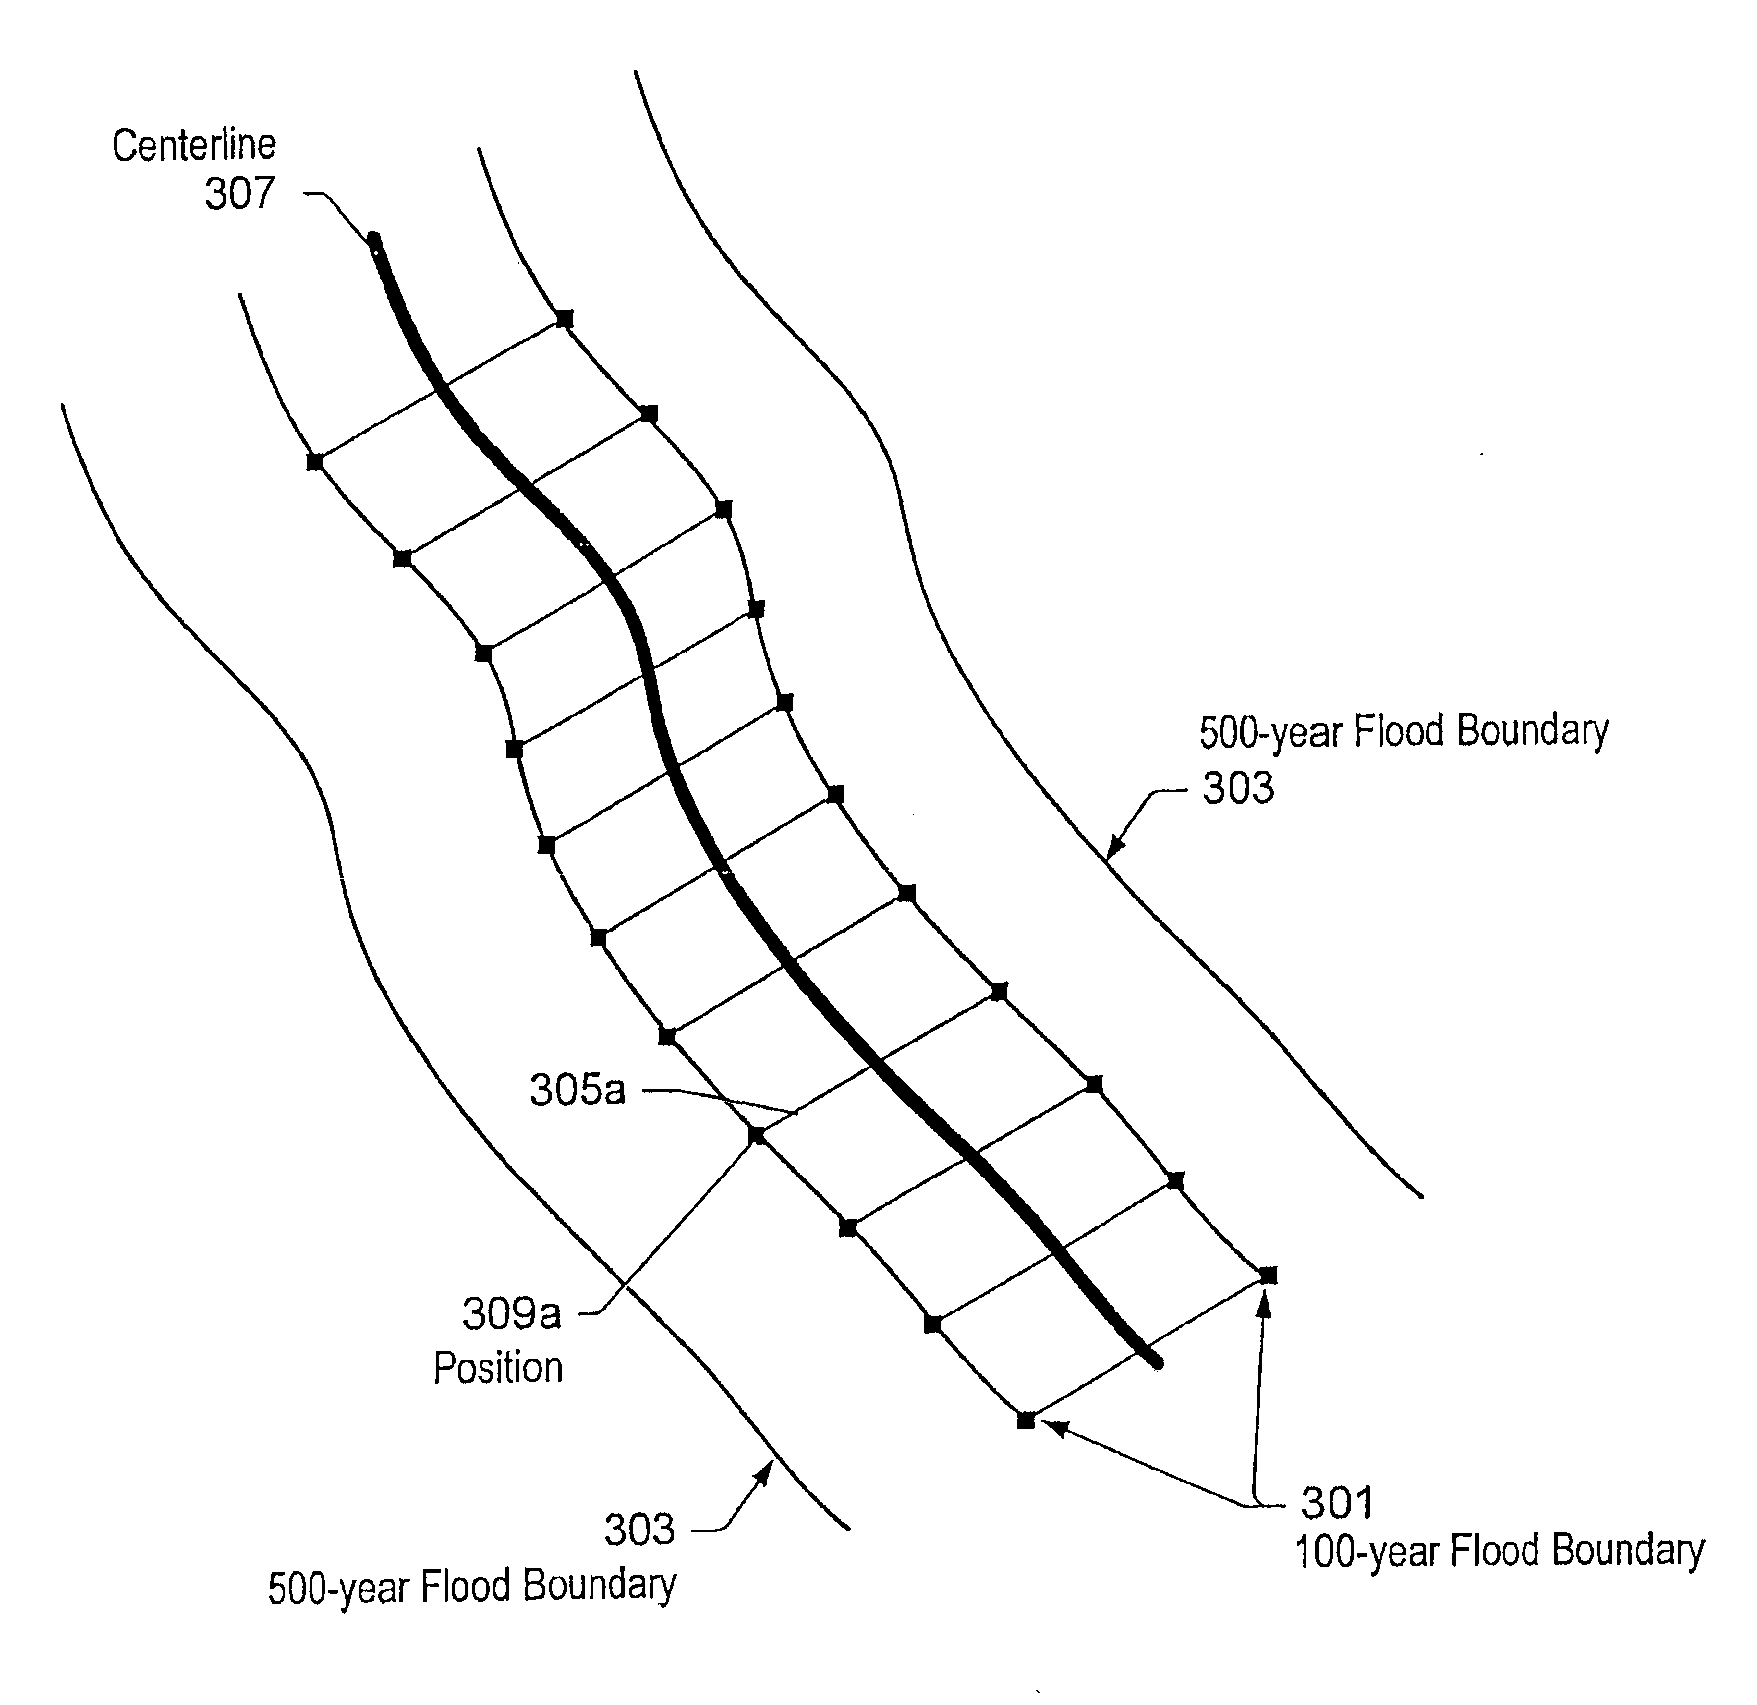
[0061]In various embodiments, a flood frequency versus flood elevation (flood depth) curve may be computed for a property point (e.g., a geocoded point location defined using geospatial coordinates, such as a latitude and a longitude, a georeferenced point (e.g., referenced to a coordinate system), an address, a building at an address, or other points of interest (POI)) in a flood risk area. In some embodiments, the flood frequency versus flood elevation curves may be determined for several property points in a portfolio. While FEMA is suggested as a possible source of flood maps herein, it is to be understood that the methods described herein may be used for property points worldwide (e.g., not constrained to the United States). For example, other flood map sources may be used to assist in analyzing property points located outside the United States. The flood frequency may refer to a flood level that has a specified percent chance of being equaled or exceeded in a given year. For e...


PUM


Abstract

In various embodiments, points from flood maps (e.g., geospatial flood risk zoning maps) may be used in generating a flood frequency versus flood elevation curve for reducing the uncertainty in the flood risk assessment. In some embodiments, geospatial flood elevation lines for flood elevation lines at different flood frequency levels may be defined based on elevation datasets where there are inconsistencies between the elevation datasets and flood maps that were generated. The flood frequency versus flood loss curve may be derived based on the computed flood frequency versus flood elevation curve, digital elevation datasets, and collected damage curve. In some embodiments, the flood risk rating may also be derived and a flood risk assessment report may be generated.

Description

CROSS REFERENCE TO RELATED APPLICATIONS[0001]This application is a Continuation of and is based upon and claims the benefit of priority under 35 U.S.C. §120 for U.S. Ser. No. 13 / 051,789, filed Mar. 18, 2011, which is a Continuation of U.S. Ser. No. 11 / 974,911, filed Oct. 16, 2007, now U.S. Pat. No. 7,917,292, the entire contents of which is incorporated herein by reference.PRIORITY[0002]This application claims benefit of priority of U.S. Provisional Patent Application Ser. No. 60 / 852,379 titled “Systems and Methods for Flood Risk Assessment”, filed on Oct. 17, 2006, whose inventor is Wei Du, which is hereby incorporated by reference in its entirety as though fully and completely set forth herein.BACKGROUND OF THE INVENTION[0003]1. Field of the Invention[0004]The present invention relates generally to risk assessment and, more specifically, to flood risk assessment.[0005]2. Description of the Related Art[0006]Worldwide, floods may be the number one cause of losses from natural events...

Claims


Application Information

Patent Timeline
Patent Type & Authority Applications(United States)
IPC IPC(8): G06F19/00
CPCG06Q90/00Y02A10/40
Inventor DU, WEI
Owner CORELOGIC SOLUTIONS
Why Eureka
Try Eureka