Supply Chain Analysis

a supply chain and analysis technology, applied in forecasting, instruments, data processing applications, etc., can solve the problems of different handling requirements, difficult identification, complex problem of analyzing a supply chain using vsm, etc., to achieve efficient analysis of the dynamic control of inventory, reduce the effect of data inpu

Inactive Publication Date: 2013-01-17
EMPIRICA CONSULTING
View PDF0 Cites 79 Cited by
  • Summary
  • Abstract
  • Description
  • Claims
  • Application Information

AI Technical Summary

Benefits of technology

[0020]The invention aims to provide a more efficient way of analyzing the complexity of a real supply chain, preferably without having to reference every product within a portfolio, in order to make visible a full range of interdependent issues in the way inventory is being managed and controlled in the end-to-end supply chain. An additional aim is to allow a non-specialist user to efficiently analyze the dynamic control of the inventory, because once the data is input the method performs calculations that result in output recommendations rather than merely data analysis. The recommendations can then be used by a relatively less skilled person (for example compared to a person sufficiently skilled to fully understand the way in which the calculations are performed) to carry out certain tasks relating to testing and improving operation of the supply chain.

Problems solved by technology

Such solutions may be obvious once identified but may be difficult to identify, particularly if the supply chain is complicated.
Analyzing a supply chain using VSM can become a complex problem involving multiple conflicting criteria across competing organizations in a given supply chain.
For example, certain products such as aerosols have different handling requirements from other products such as detergents, due to safety issues relating to pressurized containers.
Analysis of the supply chain using conventional methods, which tends to lump together all products in a supply chain, might not thereby identify bottlenecks present that relate to some but not all of the products in the chain.
A further problem with existing methods is that of handling forecasting of stocking requirements.
Inaccurate forecasting can lead to over-stocking or under-stocking of products, both of which lead to inefficiencies in the supply chain.
Under-stocking can result in loss of sales, for example a known forthcoming promotion not being taken properly into account, resulting in shelf availability for the promoted product falling below an optimum level and a resulting loss of sales.
End-to-end supply chains therefore typically involve complexity and uncertainty, due to their multi-dimensional and inter-dependent nature.
Analysis of a supply chain using conventional methods tends to over-simplify and over-aggregate the details of the supply chain, which results in the prescription of only a limited range of solutions or fails to identify important issues affecting overall business performance.
Lean manufacturing approaches generally interpret inventory as waste, which is not always appropriate; for example, in FMCG (Fast-Moving Consumer Goods) supply chains, a certain level of inventory is often required for a supply chain to operate effectively.

Method used


Image

  • Supply Chain Analysis
  • Supply Chain Analysis
  • Supply Chain Analysis

Examples


Embodiment Construction

[0052]Aspects and embodiments of the invention are described in further detail below by way of example and with reference to the enclosed drawings in which:

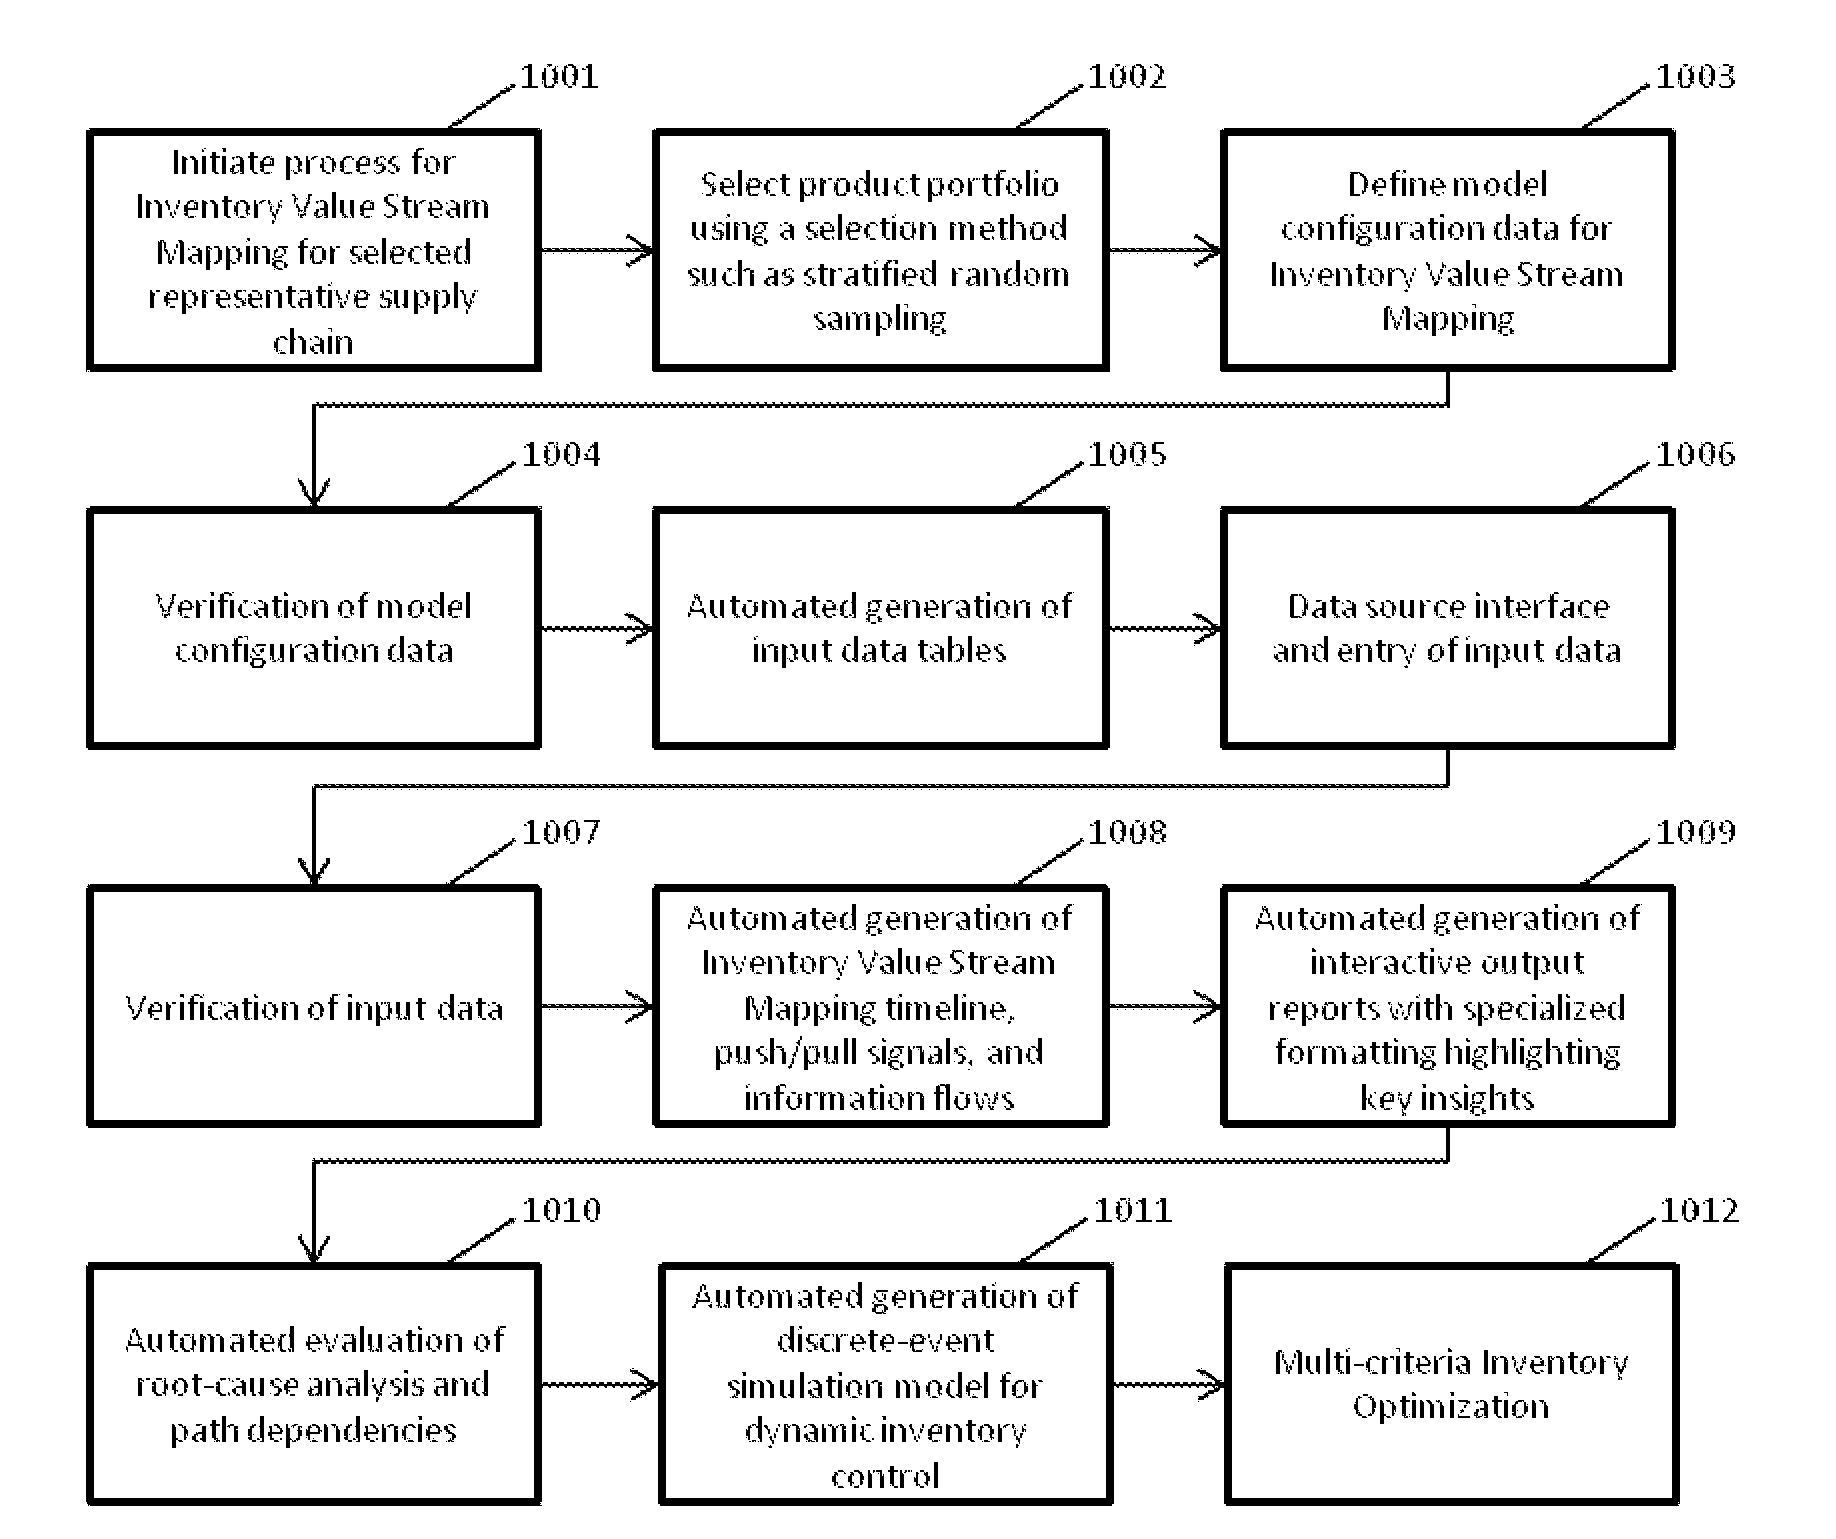
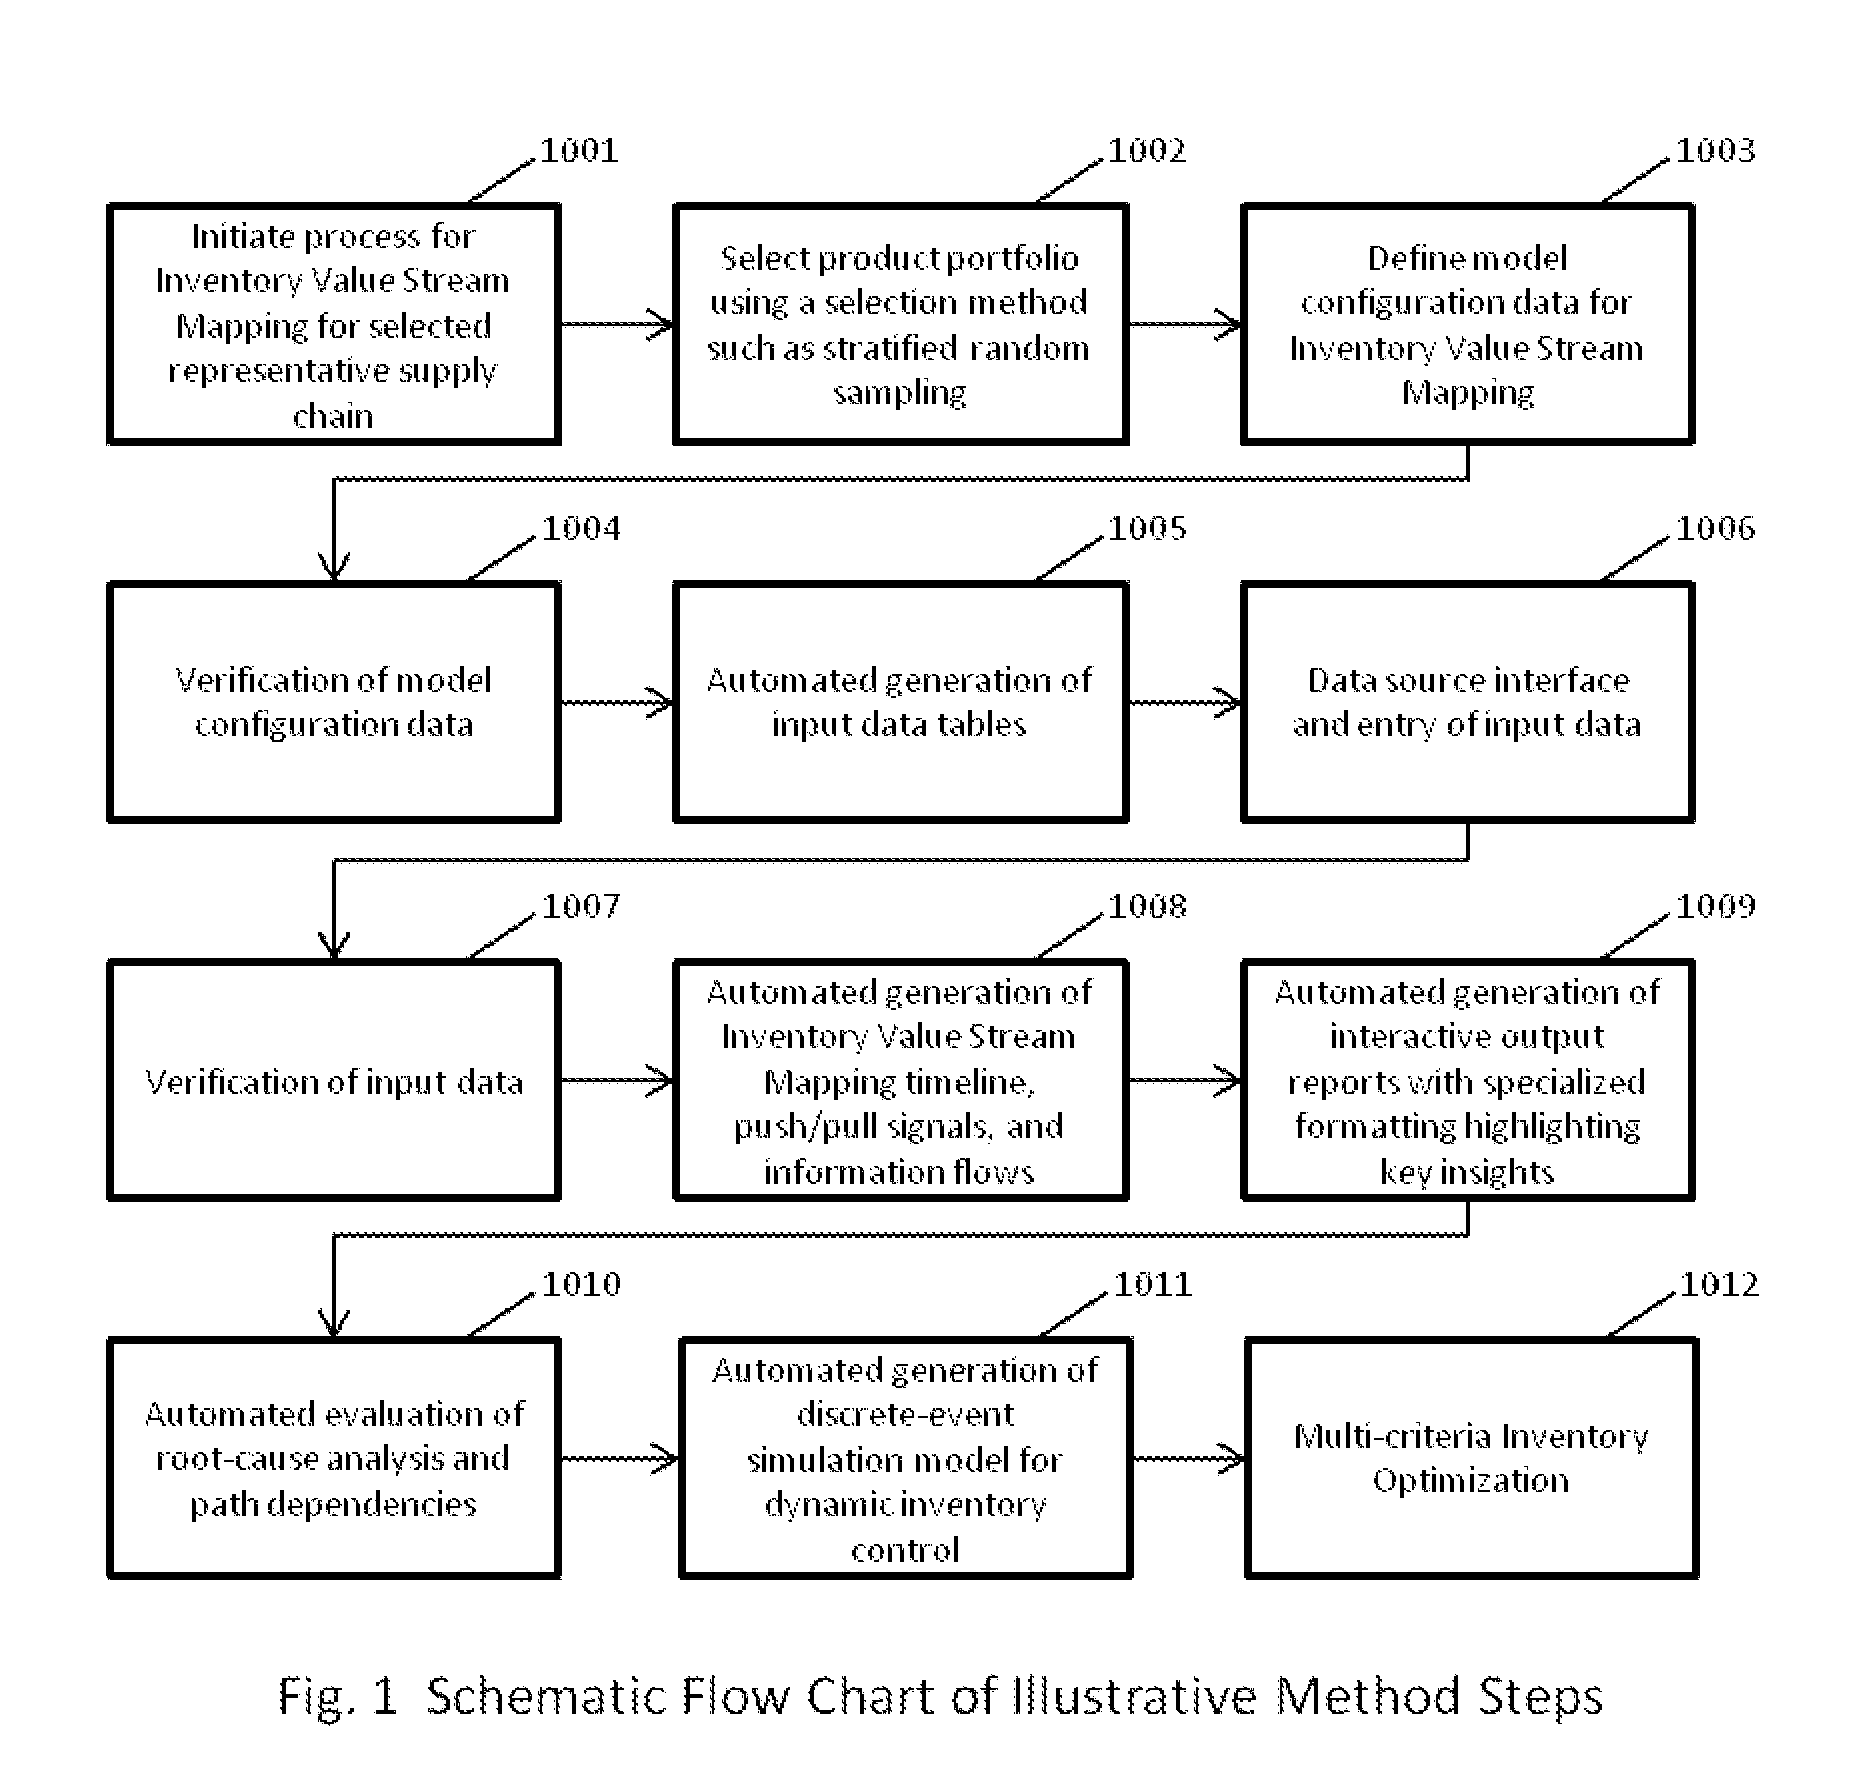
[0053]FIG. 1 is a schematic flow chart of illustrative method steps;

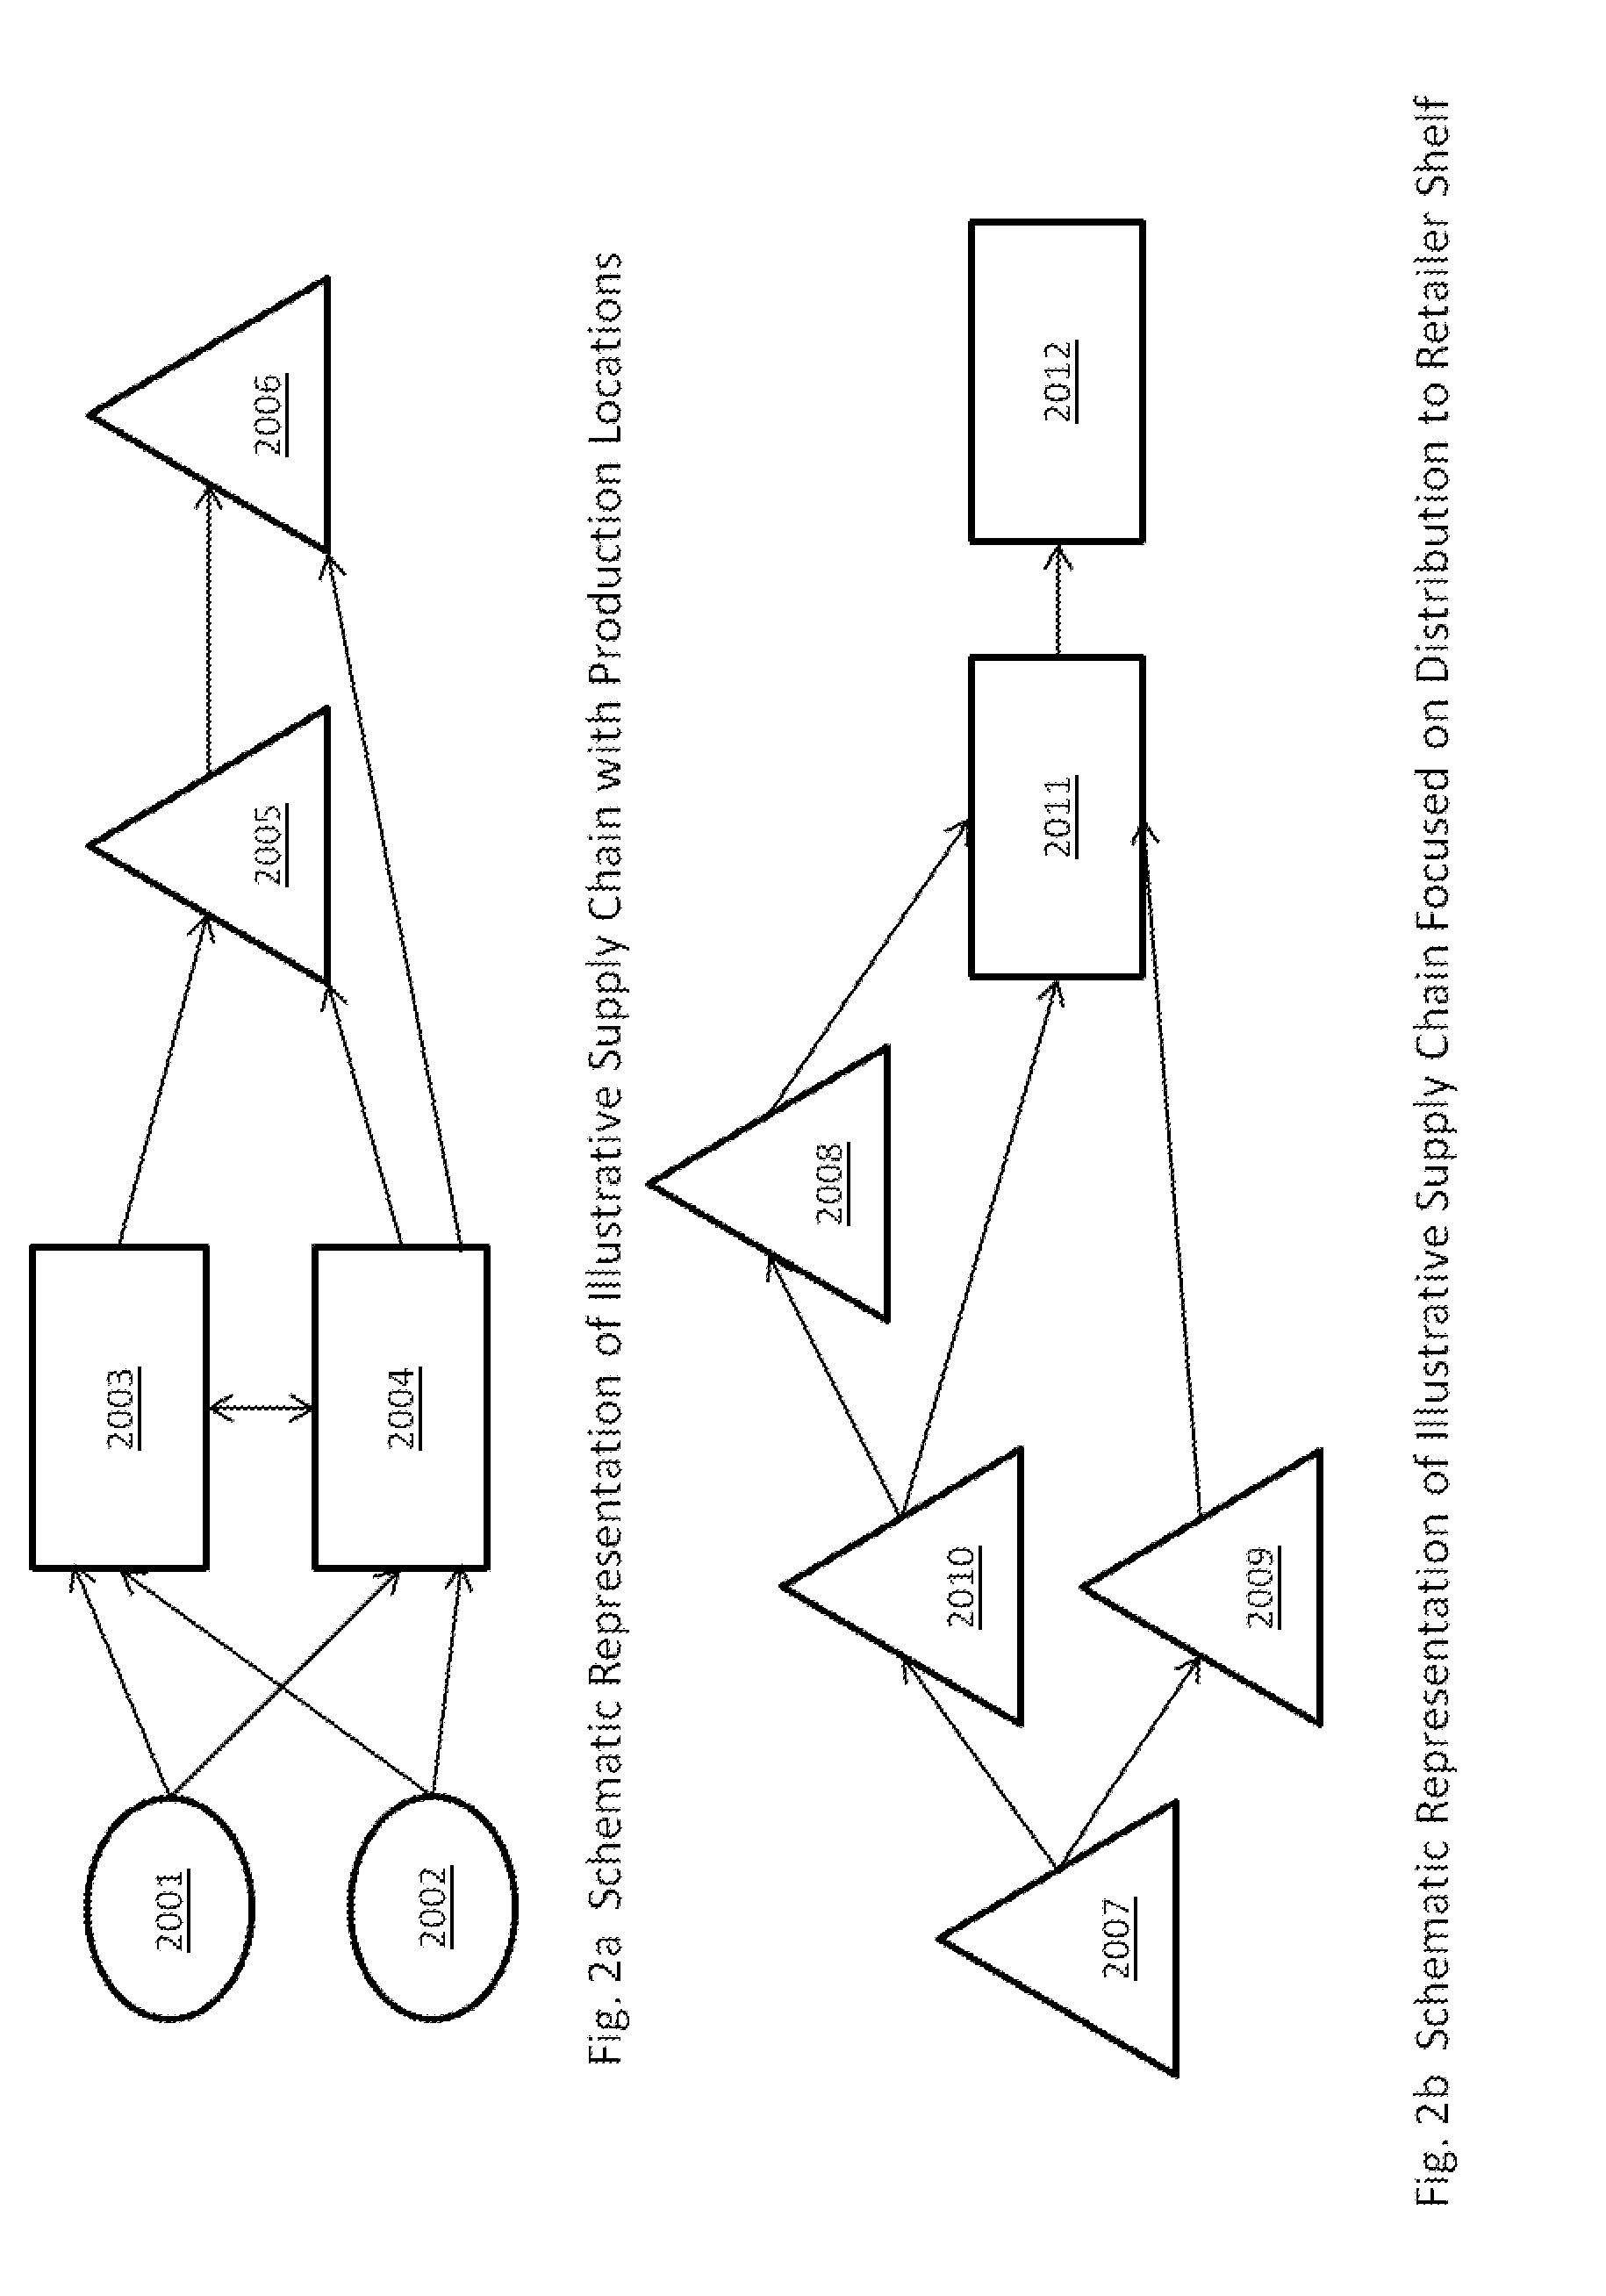
[0054]FIGS. 2a and 2b are schematic representations of illustrative supply chains;

[0055]FIG. 3 is a table containing definitions of a selected subset of a product portfolio for an exemplary supply chain;

[0056]FIG. 4 is a table containing definitions of locations for the exemplary supply chain;

[0057]FIGS. 5a and 5b are tables containing definitions of supply routes between each of the locations in the exemplary supply chain, FIG. 5b is a similar table, but with units of measure;

[0058]FIG. 6 is a schematic representation of the exemplary supply chain;

[0059]FIG. 7 shows various tables containing input data relating to movement timing and order cycle times for the exemplary supply chain;

[0060]FIGS. 8a and 8b show tables containing input data relating to inventory ove...


PUM


Abstract

The disclosure relates to analyzing and visualizing flows in a supply chain context for the purpose of inventory optimization. Embodiments disclosed include a method of analyzing a process flow in a supply chain context, the method comprising: inputting (3402) a first set of data to an application residing on a processor, relating to products, locations and supply routes connecting the different locations in the supply chain; the application generating (3403) from the first set of data an input data array; inputting (3404) a second set of data relating to measured and forecast flows of products through the supply chain over a defined time period; the application calculating (3405) from the data a series of measures of operation of the supply chain; and, based on one or more of the measures being outside a predefined range, the application generating (3406) an output indicating recommendations for adjusting operation of the supply chain.

Description

FIELD OF THE INVENTION[0001]The invention relates to analyzing and visualizing process flows in a supply chain context for the purpose of inventory optimization.BACKGROUND[0002]Value Stream Mapping (VSM) is a known technique from lean manufacturing that is used for analyzing and designing production lines with the aim of optimizing inventories and reducing waste, mapping material and information flow. This optimization technique is typically locally driven, involving analysis of only one aspect of what may be a larger production system and supply chain. VSM can, however, also be used in a larger context of an entire supply chain; for example, from a starting point of a manufacturing facility through to a retail shelf.[0003]Inventory optimization in general aims to achieve customer service targets at minimum sustainable cost; or in other words, the right amount of inventory, in the right places, to meet customer service and revenue goals. This requires vigilance and effective invento...

Claims


Application Information

Patent Timeline
Patent Type & Authority Applications(United States)
IPC IPC(8): G06Q10/06G06Q10/04
CPCG06Q10/087G06Q10/06G06Q10/06315
Inventor MELDRUM, PETER FOX
Owner EMPIRICA CONSULTING
Why Eureka
Try Eureka