Business Performance Forecasting System and Method

Active Publication Date: 2013-03-07
PREVEDERE
View PDF64 Cites 80 Cited by
  • Summary
  • Abstract
  • Description
  • Claims
  • Application Information

AI Technical Summary

Benefits of technology

The patent describes a method for identifying economic indicators that can be used for business forecasting. The method involves collecting and analyzing various sets of data to determine their correlation. By dragging and rerendering the data in a new time domain, and adding in correlated time values, the method allows for a visual representation of the data and allows for the identification of specific patterns and relationships between the data sets. The technical effect of this patent is a more efficient and effective way for businesses to analyze economic data and make informed decisions.

Problems solved by technology

Despite this enormous influence exerted by external factors on a company's operations, the current state of the art leaves the companies with little or no systematic and fluid method for understanding how external market forces impact their businesses.
When, through much effort, a company does uncover some external factors that may be a driving force for a facet of its operations, it still lacks the ability to leverage this information for strategic planning.
As a result, most corporations are not adequately prepared to address changes in economic conditions as they occur resulting in lost opportunity or degraded company performance.
The current systems and methods designed to answer these questions pose several problems that are not solved by the prior art.
First, data aggregation is a difficult and time-consuming task.
The current methods of data aggregation suffer from the problem of disuniformity; that is, the external metrics and internal metrics must be converted to a similar format suitable for conducting indicator analyses.
Some partial solutions have been attempted, but none achieve the goal of quickly preparing data sets for analyses without the need to prepare the data.
Furthermore, the data sets are not updated automatically and in close temporal proximity to the actual release date.
While, over time, some firms will develop know-how with regard to which external metrics to analyze for insight into their own internal operations, the ability to analyze a large number of external metrics currently requires a significant time commitment.
Therefore, comparing two metrics can place a significant demand on the analyst's time, consequently restricting the number of metric pairs that can be compared.
Some of the same inefficiencies that plague the aggregation of data and the subsequently analysis thereof present further difficulties to companies.
If a firm is able to determine a set of external metrics to watch, it continues to remain difficult to act accordingly when the external metrics change over time.
Developments in the field have shown that businesses routinely underestimate or ignore the insight into internal business operations that can be gleaned from external metrics.

Method used


Image

  • Business Performance Forecasting System and Method
  • Business Performance Forecasting System and Method
  • Business Performance Forecasting System and Method

Examples


Embodiment Construction

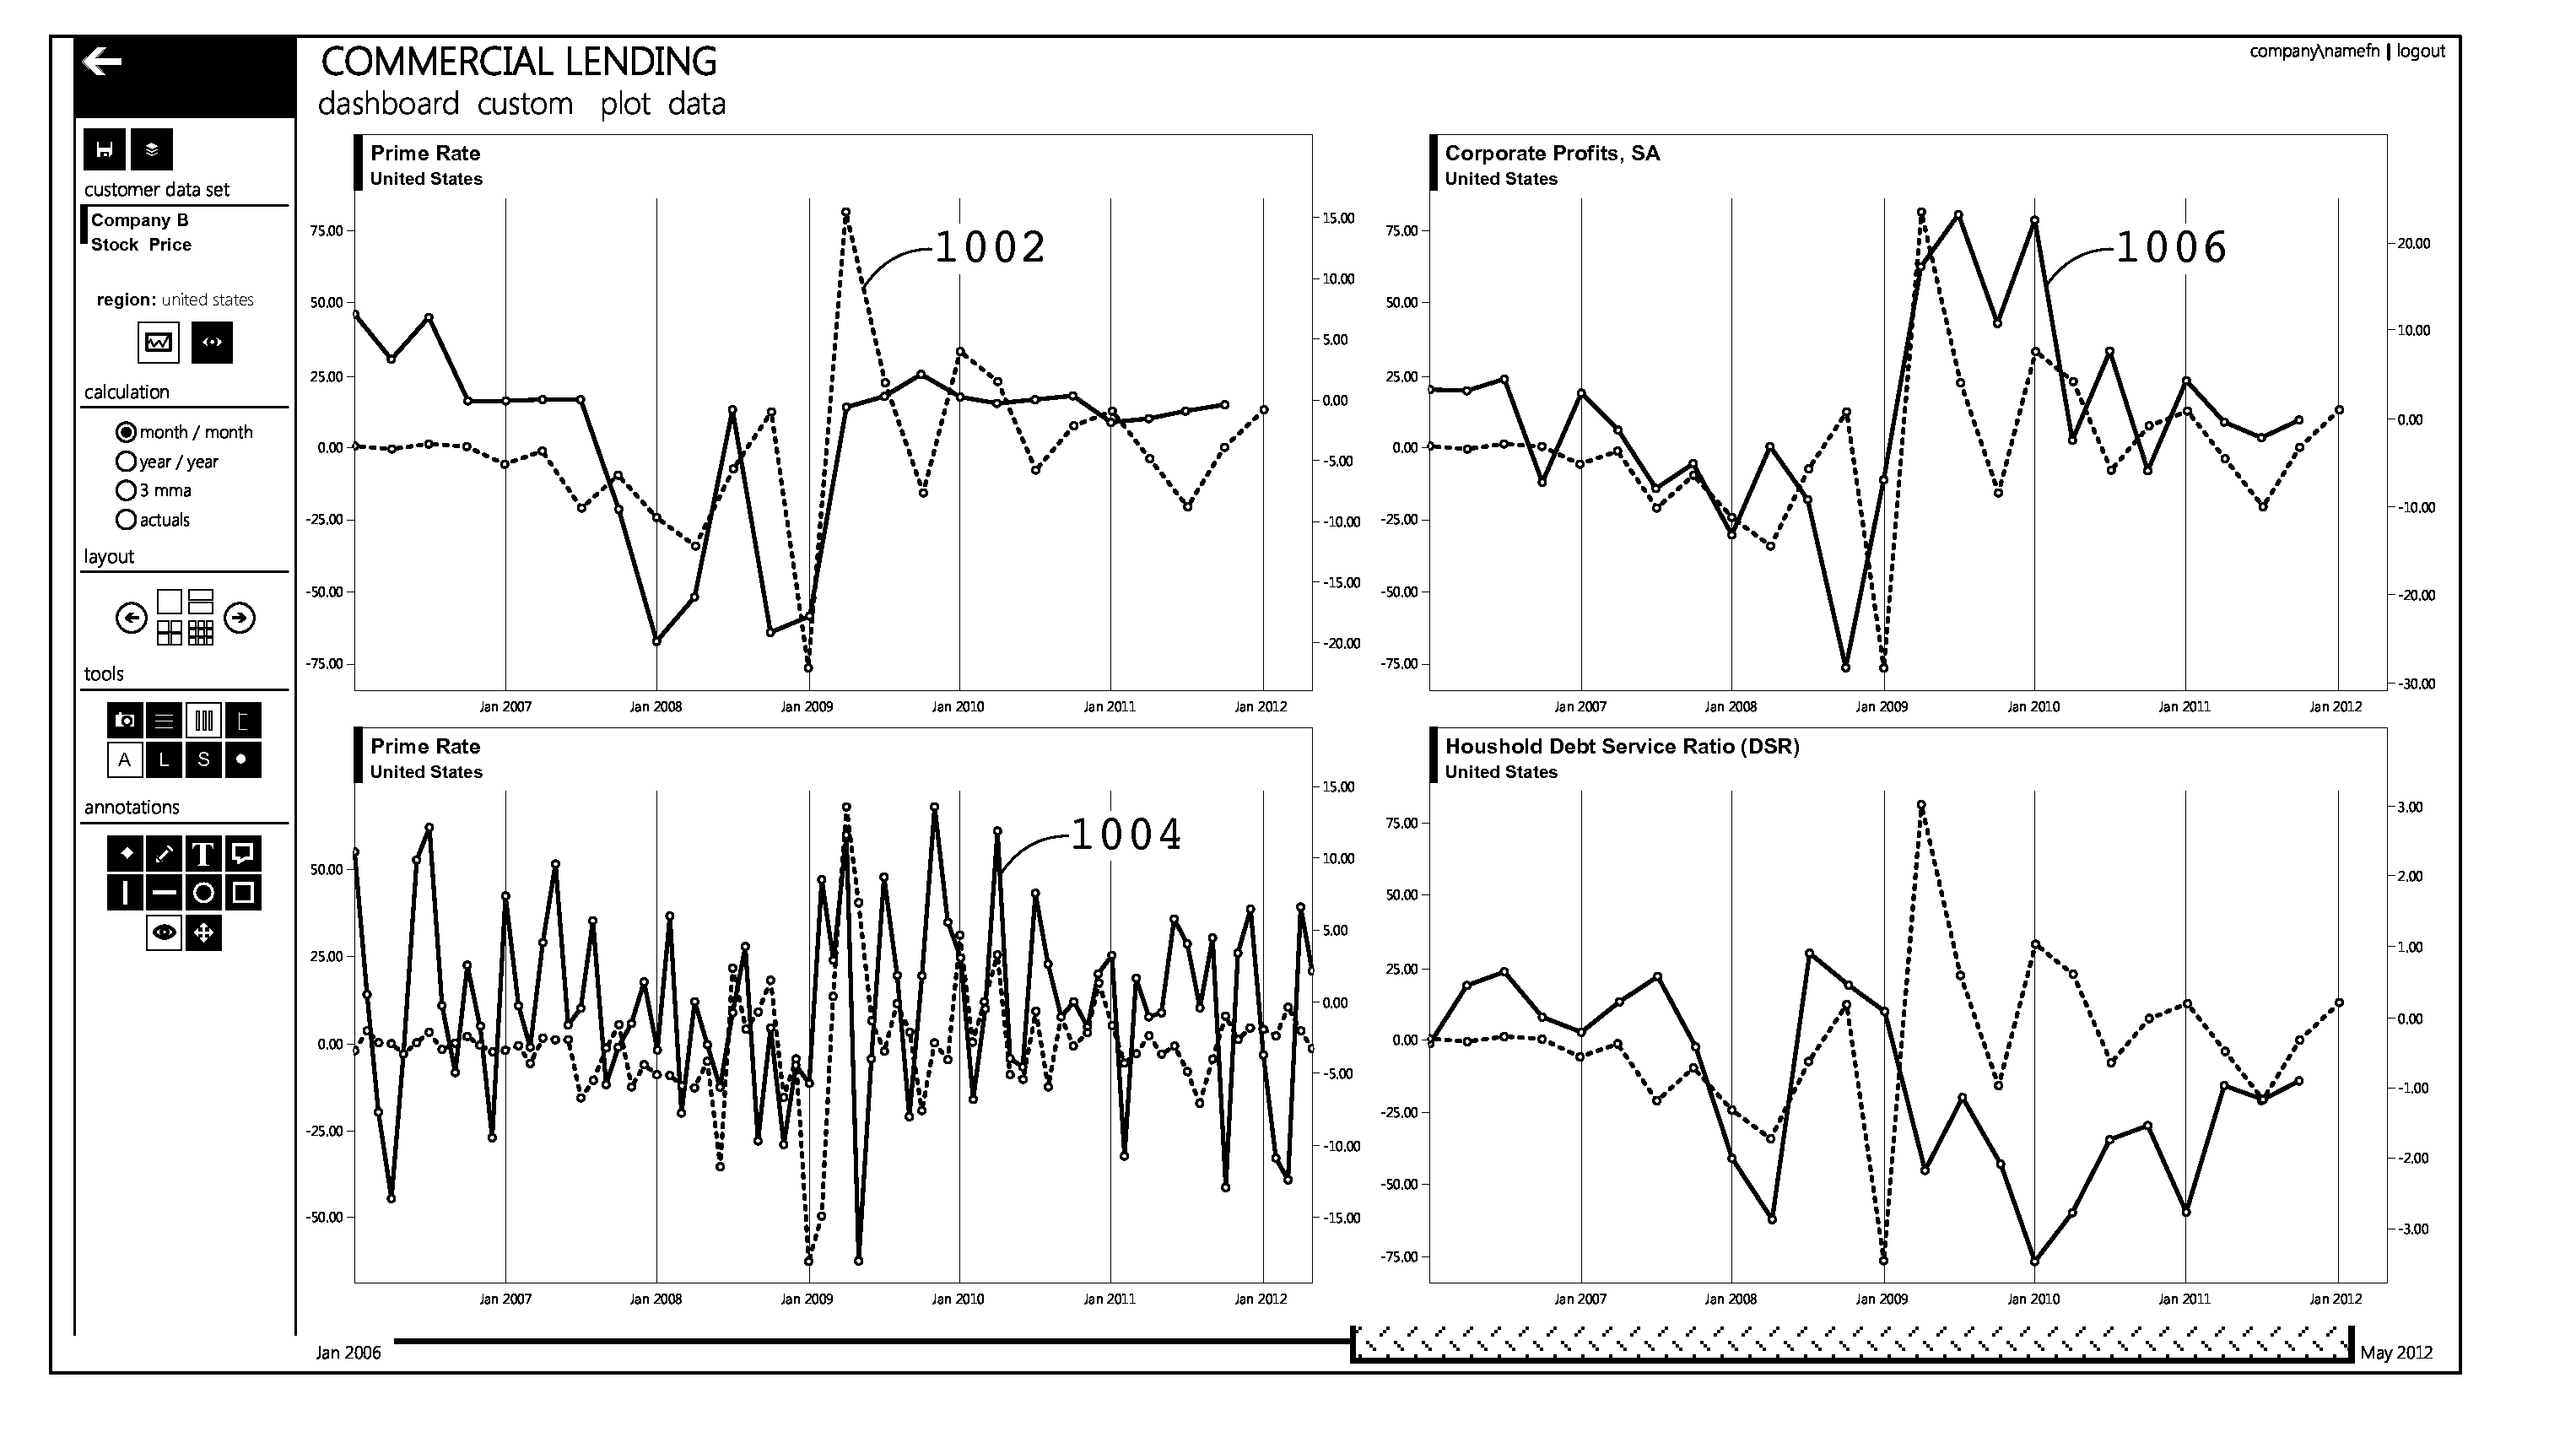
[0049]The new system and method is embodied in part by economic indicator analysis and reporting software. The system automates collection of economic, demographic, and statistical indicators that may be used to analyze business prospects and operations. Further, the system is embodied in an automated process of collection, formatting, and collation of company financial, sales volume or sales quantity data, along with a variety of other internal business metrics for a business operation. The system performs analyses of economic data series over time and is useful for identifying leading economic indicators as compared to and correlated with internal financial results or other external metrics. In a further embodiment, a method is provided for identifying the procyclic, acyclic, and counter-cyclic relationships between econometric indicators and company financial and volume data or metrics.

[0050]As such, the system provides for displaying leading indicators in user selected chart or ...


PUM


Abstract

The invention disclosed is a system for providing an aggregated econometric database with selectable sources of economic data. The econometric database is accessible to a system application that graphically displays econometric data over selected periods, and allows display of external economic data in conjunction with internal company metrics. The system applications further provide for identifying the features of indicators, economic and business forecasting, and providing alerts based on the available econometric data.

Description

CROSS-REFERENCE TO RELATED APPLICATIONS[0001]This application claims the benefit of U.S. Provisional Patent Application Ser. No. 61 / 511,527 filed Jul. 25, 2011, U.S. Provisional Patent Application and Ser. No. 61 / 512,405 filed Jul. 28, 2011, the disclosures of which are expressly incorporated herein by reference.STATEMENT REGARDING FEDERALLY SPONSORED RESEARCH[0002]None.BACKGROUND OF THE INVENTION[0003]The present invention relates generally to systems and methods for analyzing econometric data and improving business performance forecasting and decision making related thereto.[0004]According to the Harvard Business Review, approximately eighty-five percent of corporate financial performance is caused by factors external to the business, as opposed to internal actions taken by the company. In a 2009 paper, Gartner, Inc. predicted that, by 2012, more than thirty-five percent of the top 5,000 global companies would regularly fail to make insightful decisions about significant changes i...

Claims


Application Information

Patent Timeline
IPC IPC(8): G06Q30/02
CPCG06Q40/12G06Q30/0202
Inventor WAGNER, RICHARD CHADWICK
Owner PREVEDERE
Why Eureka
Try Eureka