State inference in a heterogeneous system

a heterogeneous system and state inference technology, applied in the field of state inference in a heterogeneous system, can solve the problems of difficult and unreliable heuristic or numerical combination of data, time-consuming and laborious determination of system state, and easy errors in interpretation

Inactive Publication Date: 2013-04-18
COMBINOSTICS OY
View PDF14 Cites 7 Cited by
  • Summary
  • Abstract
  • Description
  • Claims
  • Application Information

AI Technical Summary

Benefits of technology

[0009]According to a second aspect of the invention, there is provided an apparatus comprising at least one processor and memory including computer program code, the memory and the computer program code configured to define a first indicator and a second indicator in a system, the values of the first indicator and the second indicator being indicative of the state of the system of interest, form a measure of goodness for said first indicator and for said second indicator by using values of said first indicator and values of said second indicator, respectively, of a control state and a comparison state, form a difference value for said first indicator and for said second indicator in a system of interest with reference to said first and second indicators in said control and comparison states, define a composite indicator of said first indicator and said second indicator, form a measure of goodness for the composite indicator by using information indicative of said measure of goodness of said first indicator and said second indicator, form a difference value for the composite indicator in a system of interest, and arrange said composite indicator to be used in inferring the state of the system of interest.
[0010]According to an embodiment, the apparatus further comprises computer program code configured to form said difference values for said first and second indicators to be indicative of whether the system of interest is in a control state or a comparison state or in a state between the control state and the comparison state, and display difference values arranged according to their respective measures of goodness for inferring the state of the system of interest. According to an embodiment, the apparatus further comprises computer program code configured to display said difference values of said first, second and composite indicators of said system of interest to a user, wherein said difference values of said first, second and composite indicators of said system of interest are displayed with a value such as a number, a symbol, a color, a shade, a pattern, a bar or a gauge, and said difference values of said first, second and composite indicators are highlighted and / or suppressed according to the respective measure of goodness of said first, second and composite indicators using a visual cue such as size, blinking, position on the display or stacking. According to an embodiment, the apparatus further comprises computer program code configured to display said difference value of said composite indicator of said system of interest with a colour symbol on a first level in a tree structure, display said difference values of said first and second indicator of said system of interest with a colour symbol on a second level in a tree structure, and display said measures of goodness of said first, second and composite indicators of said system of interest with a size of said colour symbol. According to an embodiment, the apparatus further comprises computer program code configured to group said tree structure by forming groups of indicators that are on the same level of the tree and that are linked to a composite indicator of another level, and arrange said groups of said tree structure according to said measures of goodness so that indicators having a larger measure of goodness are arranged to appear visually together. According to an embodiment, the apparatus further comprises computer program code configured to arrange said groups of indicators to appear horizontally in a decreasing order according to the respective measures of goodness of the composite indicators, and arrange indicators inside said groups of indicators to appear vertically in a decreasing order according to their respective measures of goodness. According to an embodiment, the apparatus further comprises computer program code configured to compute the difference value of said composite indicator of said system of interest from the difference values of said first and second indicator of said system of interest, the calculation being done according to the respective measures of goodness of said first and second indicator of said system of interest, such as using a weighted average. According to an embodiment, the apparatus further comprises computer program code configured to compute the measures of goodness of said first, second and composite indicators by determining a statistical probability of said indicator being a reliable measure for determining whether the said system of interest belongs to said at least one control or comparison state. According to an embodiment, the apparatus further comprises computer program code configured to compute the measure of goodness of said composite indicator of said system of interest using attributes of said first and second indicators of said system of interest in the calculation. According to an embodiment, the apparatus further comprises computer program code configured to compute at least one said difference value by comparing an indicator of said system of interest to indicators of at least one control and comparison state, and compute at least one said measure of goodness by using a statistical distribution of said at least one control and comparison state.
[0011]According to a third aspect of the invention, there is provided a system comprising at least one processor, memory including computer program code, the memory and the computer program code configured to define a first indicator and a second indicator in a system, the values of the first indicator and the second indicator being indicative of the state of the system of interest, form a measure of goodness for said first indicator and for said second indicator by using values of said first indicator and values of said second indicator, respectively, of a control state and a comparison state, form a difference value for said first indicator and for said second indicator in a system of interest with reference to said first and second indicators in said control and comparison states, define a composite indicator of said first indicator and said second indicator, form a measure of goodness for the composite indicator by using information indicative of said measure of goodness of said first indicator and said second indicator, form a difference value for the composite indicator in a system of interest, and arrange said composite indicator to be used in inferring the state of the system of interest.
[0012]According to an embodiment, the system further comprises computer program code configured to form said difference values for said first and second indicators to be indicative of whether the system of interest is in a control state or a comparison state or in a state between the control state and the comparison state, and display difference values arranged according to their respective measures of goodness for inferring the state of the system of interest.
[0013]According to a fourth aspect of the invention, there is provided a computer program product stored on a computer readable medium and executable in a data processing device, the computer program product comprising a computer program code section for defining a first indicator and a second indicator in a system, the values of the first indicator and the second indicator being indicative of the state of the system of interest, a computer program code section for forming a measure of goodness for said first indicator and for said second indicator by using values of said first indicator and values of said second indicator, respectively, of a control state and a comparison state, a computer program code section for forming a difference value for said first indicator and for said second indicator in a system of interest with reference to said first and second indicators in said control and comparison states, a computer program code section for defining a composite indicator of said first indicator and said second indicator, a computer program code section for forming a measure of goodness for the composite indicator by using information indicative of said measure of goodness of said first indicator and said second indicator, a computer program code section for forming a difference value for the composite indicator in a system of interest, and a computer program code section for arranging said composite indicator to be used in inferring the state of the system of interest.
[0014]According to an embodiment, the computer program product further comprises a computer program code section for forming said difference values for said first and second indicators to be indicative of whether the system of interest is in a control state or a comparison state or in a state between the control state and the comparison state, and a computer program code section for displaying difference values arranged according to their respective measures of goodness for inferring the state of the system of interest.

Problems solved by technology

However, in many applications the computerized methods cannot make the final decision because of possible erroneous measurements and uncertainty in the data, or merely because the computer cannot fully mimic the knowledge and experience of an expert.
The different values and data may be at least partially conflicting, and the data may be heterogeneous so that combining the data heuristically or numerically may be difficult and unreliable.
Determining the state of the system may therefore be very time-consuming and prone to errors in interpretation.

Method used


Image

  • State inference in a heterogeneous system
  • State inference in a heterogeneous system
  • State inference in a heterogeneous system

Examples


Embodiment Construction

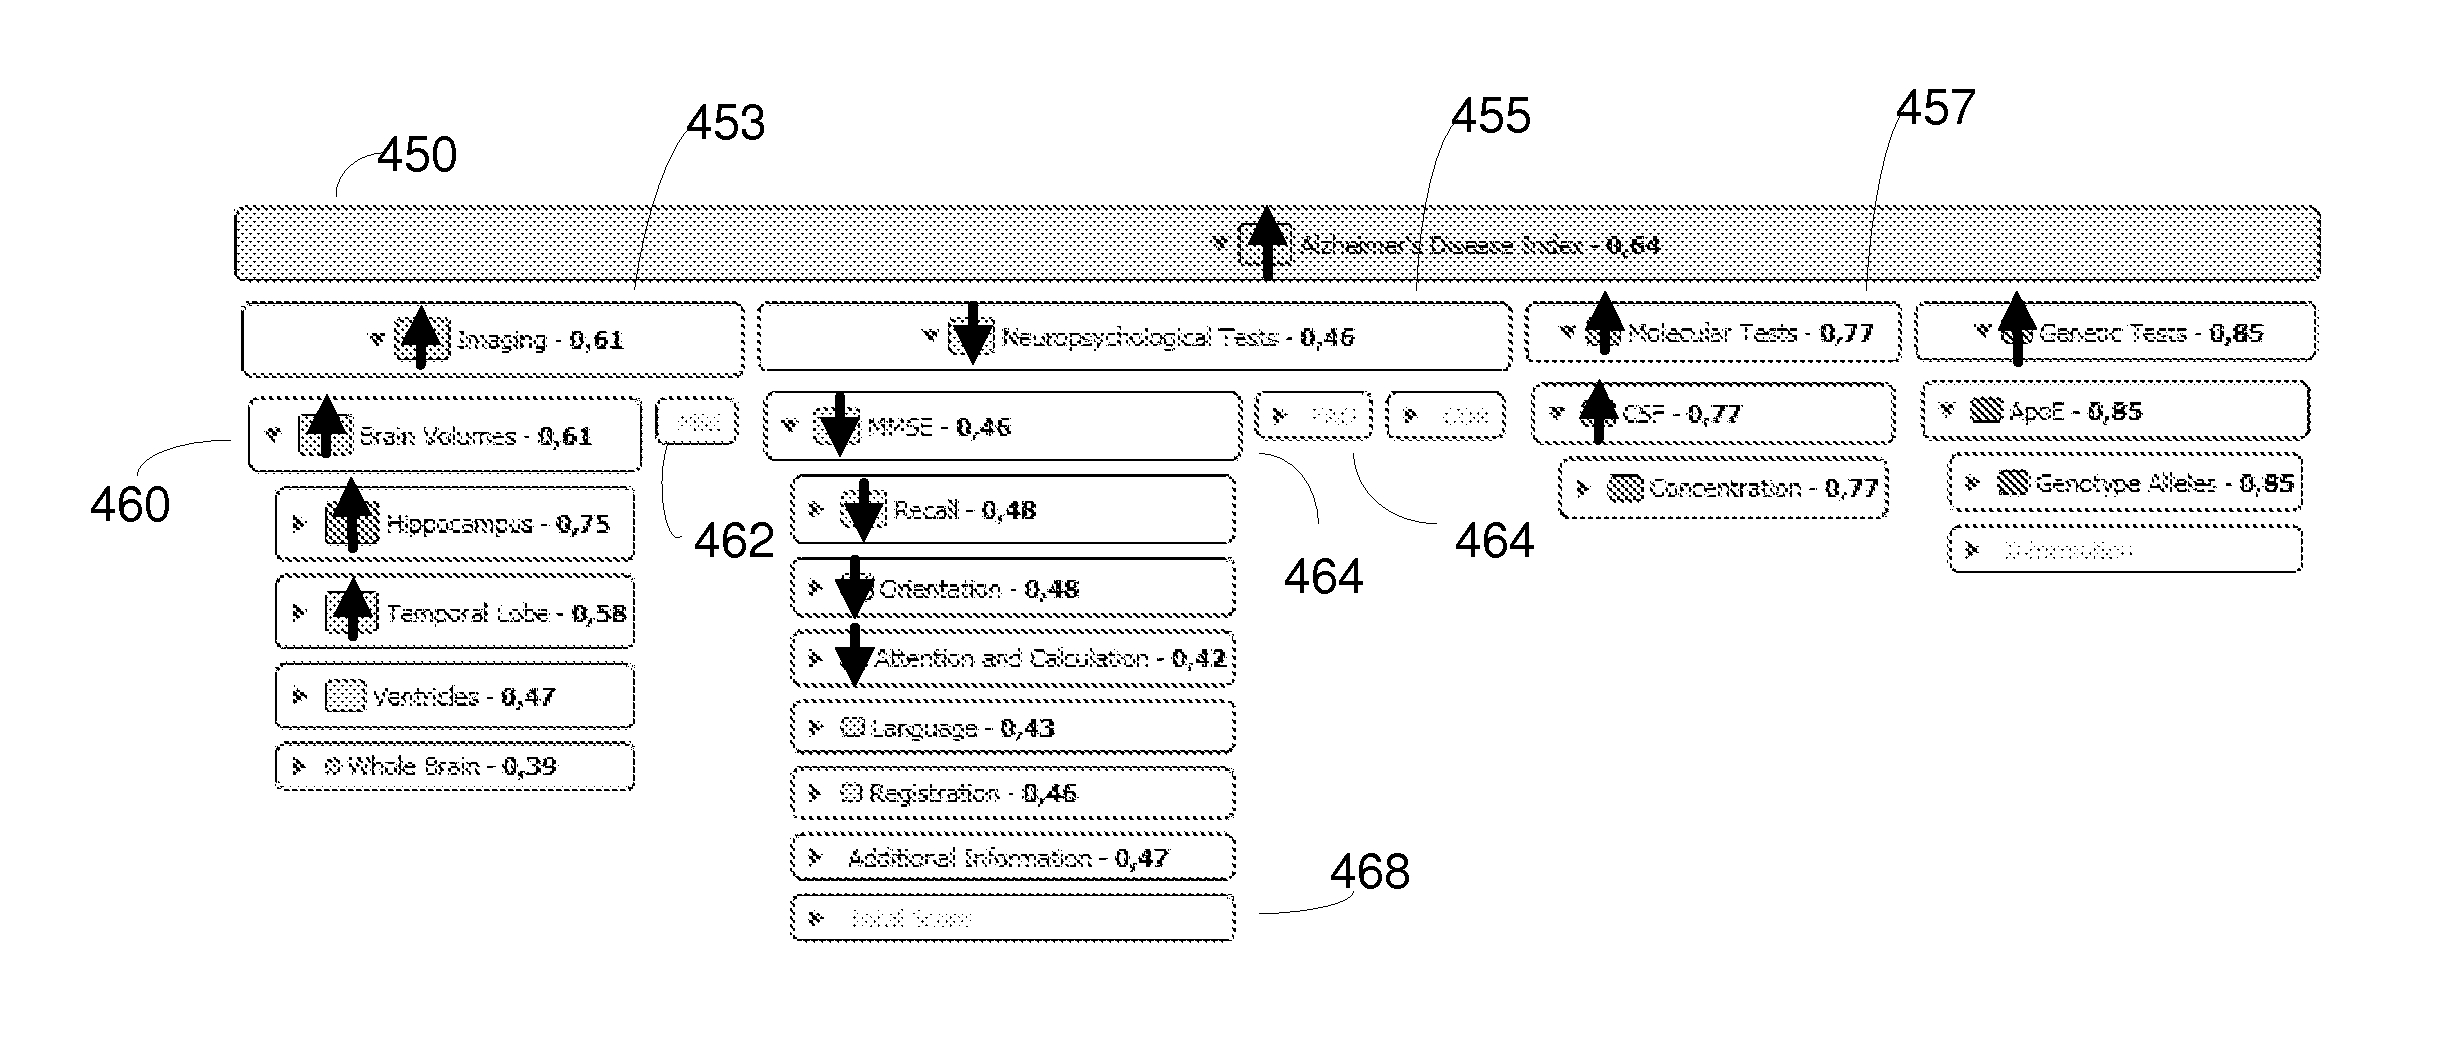
[0025]It has been noticed in the invention that databases of complex systems comprising heterogeneous data, such as medical records, population demographics, and process analysis data, often contain information that is not immediately obvious to the observer. It has also been noticed in the invention that there may be a need for novel decision support systems utilizing heterogeneous data in a plethora of environments, such as medicine, financing, and manufacturing. Such environments would benefit from a solution like the present invention to analyze available data and visualize analysis results for quick understanding of the parameters in question. The present invention provides methods for analyzing and visualizing statistical aspects of heterogeneous datasets, allowing quick inspection and state inference by field experts. The visualization methods may be useful in several fields as decision support systems, and they may also be used as a data mining tool for research. Further, it...


PUM


Abstract

The invention relates to inferring the state of a system of interest having a plurality of indicator values and possibly being heterogeneous in nature. A number of indicator values from a control state and from a comparison state are gathered. From these indicator values, classification power between the control and comparison states (measure of goodness) is computed. Difference values are computed for the indicator values from the system of interest based on the difference to the indicator values from control and comparison states. From a number of these indicators, composite indicators are formed, and composite measures of goodness and composite difference values are computed. A plurality of composite indicators may be formed at different levels. These indicators may be represented as a tree and grouped according to content, and at the same time they may be arranged according to the measure of goodness or some other value. The indicators, measures of goodness, and difference values may be visualized and shown to a user, who may use such a representation for inferring the state of the system.

Description

FIELD OF THE INVENTION[0001]The invention relates to a method of inferring the state of a system and classifying data. The invention relates to an apparatus and a system for inferring the state of a system and visualizing the state. The invention relates to the computer program product for inferring the state of a system and visualizing the state.BACKGROUND OF THE INVENTION[0002]Any arbitrary system of interest can have at least two states. The system of interest can be, for example, an apparatus, a human body, or a financial entity. Typically, the system of interest either functions correctly (normal state) or has a malfunction (error state). There may be several normal and / or error states. A good example is the healthiness of a human being: he or she can be healthy (normal state) or have a disease (error state), in which case the number of the error states may be large. The state of the system of interest defines which normal or error state the system of interest is in and how muc...

Claims


Application Information

Patent Timeline
Patent Type & Authority Applications(United States)
IPC IPC(8): G06F17/00G06F17/18
CPCG06F19/3431G06F19/345G06K9/6253G06F17/18G06K9/6296G06F17/00G06K9/6265G16H50/30G16H50/20G06F16/9027G06V10/7796G06V10/945G06F18/29G06F18/40G06F18/2193G06N7/01G06F7/24
Inventor LOTJONEN, JYRKIKOIKKALAINEN, JUHAMATTILA, JUSSI
Owner COMBINOSTICS OY
Why Eureka
Try Eureka