Ultrasound diagnostic apparatus and method of determining a time intensity curve

a technology of ultrasonic diagnostic apparatus and time intensity curve, which is applied in the direction of ultrasonic/sonic/infrasonic image/data processing, instruments, applications, etc., can solve the problems of wasting time for operators to do work, and the intensity curve generated from a series of acquired images including such a high intensity image is fals

Active Publication Date: 2013-05-09
GENERAL ELECTRIC CO
View PDF3 Cites 10 Cited by
  • Summary
  • Abstract
  • Description
  • Claims
  • Application Information

AI Technical Summary

Problems solved by technology

A problem arises in that a time intensity curve generated from a series of acquired images including such a high intensity image represents a false result according to a method of performing curve smoothing processing.
Although a time intensity curve may be generated after a high intensity image has manually been eliminated in the related art ultrasound diagnostic apparatus, a problem arises in that it takes time for an operator to do the work of finding out a high intensity image and removing it.

Method used


Image

  • Ultrasound diagnostic apparatus and method of determining a time intensity curve
  • Ultrasound diagnostic apparatus and method of determining a time intensity curve
  • Ultrasound diagnostic apparatus and method of determining a time intensity curve

Examples


first embodiment

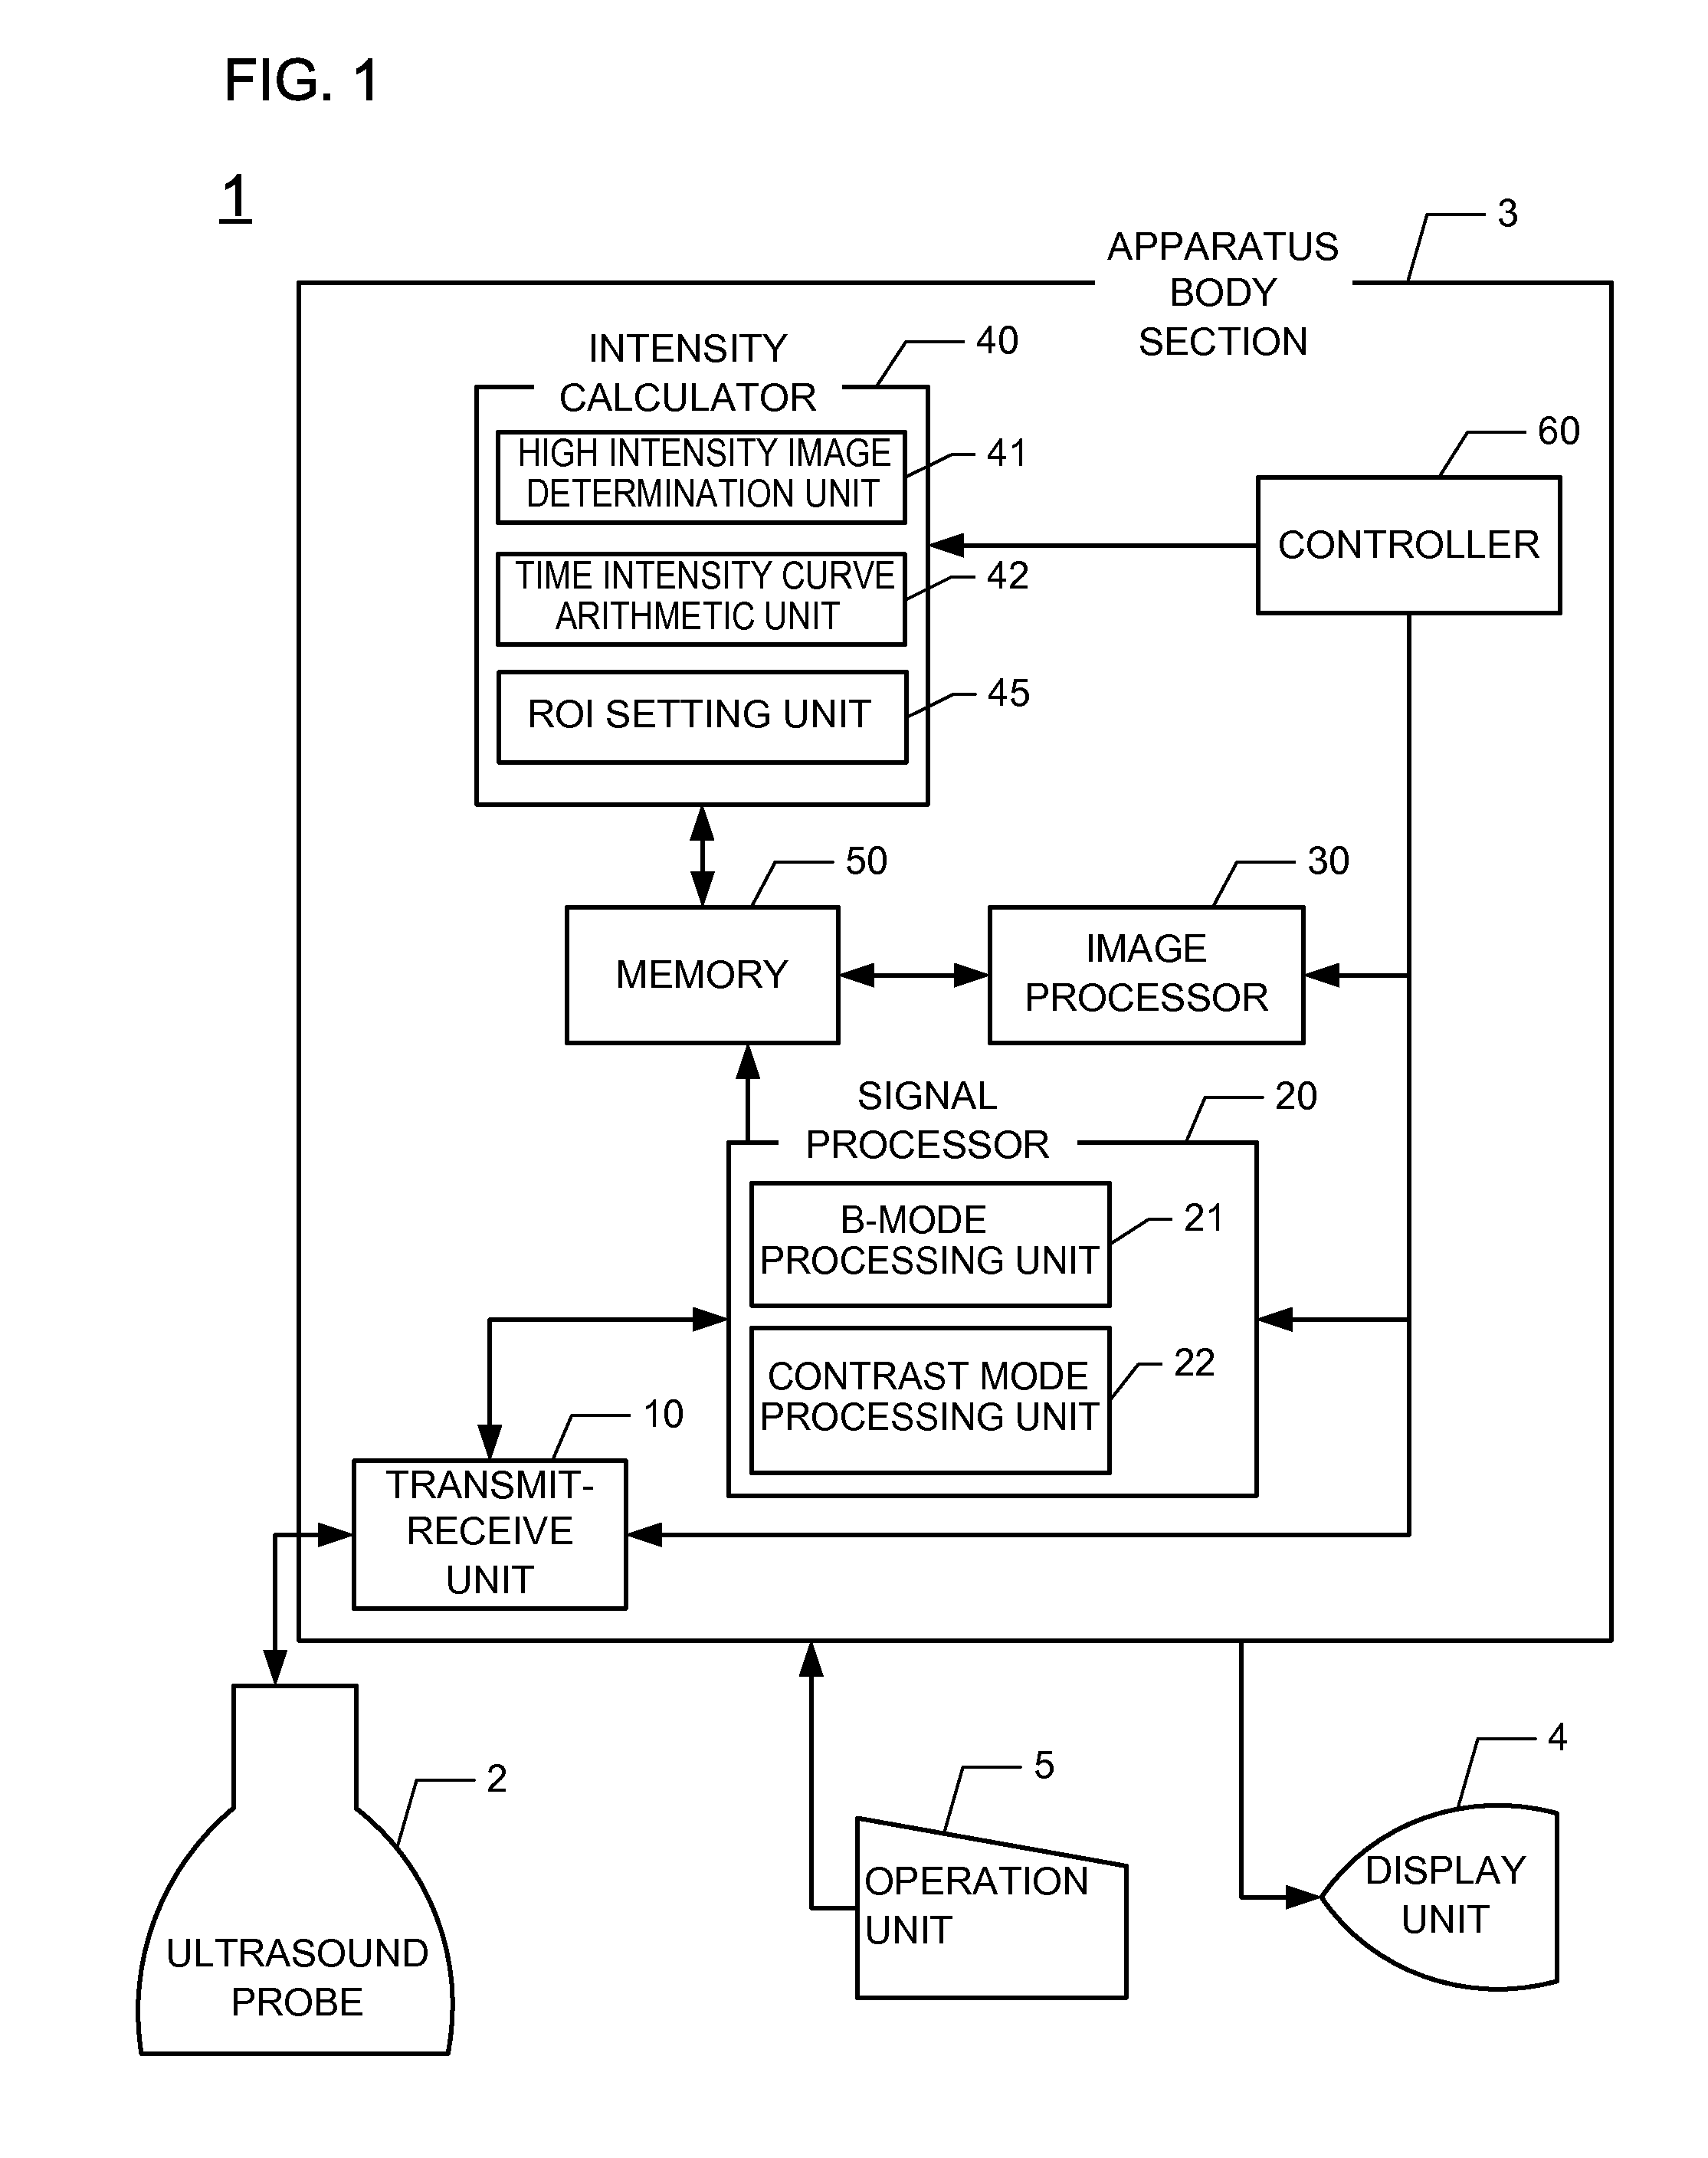
[0035]FIG. 1 is a block configuration of an exemplary ultrasound diagnostic apparatus 1. The ultrasound diagnostic apparatus 1 includes an ultrasound probe 2, an apparatus body section 3, a display unit 4 and an operation unit 5.

[0036]The transmit-receive unit 10 drives the ultrasound probe 2 in accordance with respective modes of the signal processor 20 to transmit and receive ultrasound to and from the subject. The transmit-receive unit 10 delays the piezoelectric transducer of the ultrasound probe 2 for a predetermined time so that a desired transmission / reception beam is formed. Also the transmit-receive unit 10 performs digital conversion or analog conversion on transmission and reception signals. The received signal is stored as sound ray data in an image memory of the memory 50 to be described later. The transmit-receive unit 10 changes a scan method according to the ultrasound probe 2. The scan method may include a sector scan, a linear scan and a convex scan according to th...

second embodiment

[0090]In a high intensity image, the ultrasound image G may not necessarily only be a case where the entire ultrasound image G becomes high in intensity, but may be a case where only a partial area becomes high in intensity. Even when a high intensity image exists in a partial area of the ultrasound image G, a high intensity image determination unit 41 of a second embodiment automatically eliminates the ultrasound image G. Since an ultrasound diagnostic apparatus 1 according to the second embodiment is similar in configuration to the first embodiment, the same reference numerals are used therein. Different points will be explained below.

[0091]FIG. 9A is a diagram showing a case in which a high intensity area HA exists in a partial area of an acquired ultrasound image G. Assume that an ultrasound image G having a high intensity area HA that exists in such a right half as shown in the drawing exists in a sampling of a frame f4 of the acquired ultrasound image G. Since the high intensi...

third embodiment

[0122]A description will be made of a method in which a high intensity image determination unit 41 of a third embodiment removes a high intensity image that does not reach the above-described threshold value TH1. Since an ultrasound diagnostic apparatus 1 according to the third embodiment is similar in configuration to the first embodiment, the same reference numerals are used. Different points will be explained below.

[0123]High intensity images may occur in not only one frame f shown in each of the first and second embodiments, but also in a sequence of plural frames f. FIGS. 14A and 14B are diagrams in which high intensity images continuously appear at a sequence of frames f. In FIGS. 14A and 14B, an X axis is assumed to be a frame F (time), and a Y axis is assumed to be a pixel value B. The number of frames at which high intensity images appear continuously, is 2 frames f or so upon the contrast echo although it depends on the frame rate. When there is such a frame f that a pixel...


PUM


Abstract

An ultrasound diagnostic apparatus is provided. The ultrasound diagnostic apparatus includes an image data generation unit configured to generate image data corresponding to one frame of a subject, based on sound ray data acquired by transmitting ultrasound to the subject, a high intensity image determination unit configured to compare strength of sound ray data corresponding to the one frame with a predetermined value and determine whether the one frame is a high intensity image, a setting unit configured to set a region of interest onto an image based on the image data generated by the image data generation unit, and a time intensity curve arithmetic unit configured to eliminate sound ray data corresponding to the region of interest in the high intensity image and perform an arithmetic operation on a time intensity curve in which pixel values of the region of interest set by the setting unit are made consecutive.

Description

CROSS REFERENCE TO RELATED APPLICATIONS[0001]This application claims the benefit of Japanese Patent Application No. 2011-237869 filed Oct. 28, 2011, which is hereby incorporated by reference in its entirety.BACKGROUND OF THE INVENTION[0002]The present invention relates to an ultrasound diagnostic apparatus which determines a time intensity curve about a region of interest set to an ultrasound image.[0003]A contrast agent may be injected into a body of a subject using, for example, an ultrasound diagnostic apparatus to perform imaging. Upon inspection using such a contrast agent, an inspection using a time intensity curve (TIC) may be carried out. The time intensity curve indicates a time change in the average pixel value in a region of interest (ROI) set onto an ultrasound image. Displaying the time intensity curve makes it possible to observe a change in the concentration of the contrast agent and diagnose the presence or absence of a disease in the subject or the degree thereof. T...

Claims


Application Information

Patent Timeline
Patent Type & Authority Applications(United States)
IPC IPC(8): A61B8/08
CPCA61B8/481A61B8/5276A61B8/5223A61B8/06A61B8/08A61B8/14G16Z99/00
Inventor MIYAMA, KOJI
Owner GENERAL ELECTRIC CO
Why Eureka
Try Eureka