
Spectroscopy data display systems and methods

Active Publication Date: 2013-07-04
ELEMENTAL SCI LASERS LLC
View PDF19 Cites 21 Cited by
  • Summary
  • Abstract
  • Description
  • Claims
  • Application Information

AI Technical Summary

Benefits of technology

This patent describes a method and system for analyzing a sample using laser-assisted spectroscopy. The laser beam is scanned over the sample, and the resulting aerosol of material is analyzed using a spectrometer. The system can display an image of the sample with indications of the spectroscopy data values at the location where the material was disassociated by the laser beam. This technology allows for precise and accurate analysis of samples, with minimized damage and contamination. Its technical effects include improved accuracy and resolution in sample analysis and reduced damage to the sample.

Problems solved by technology

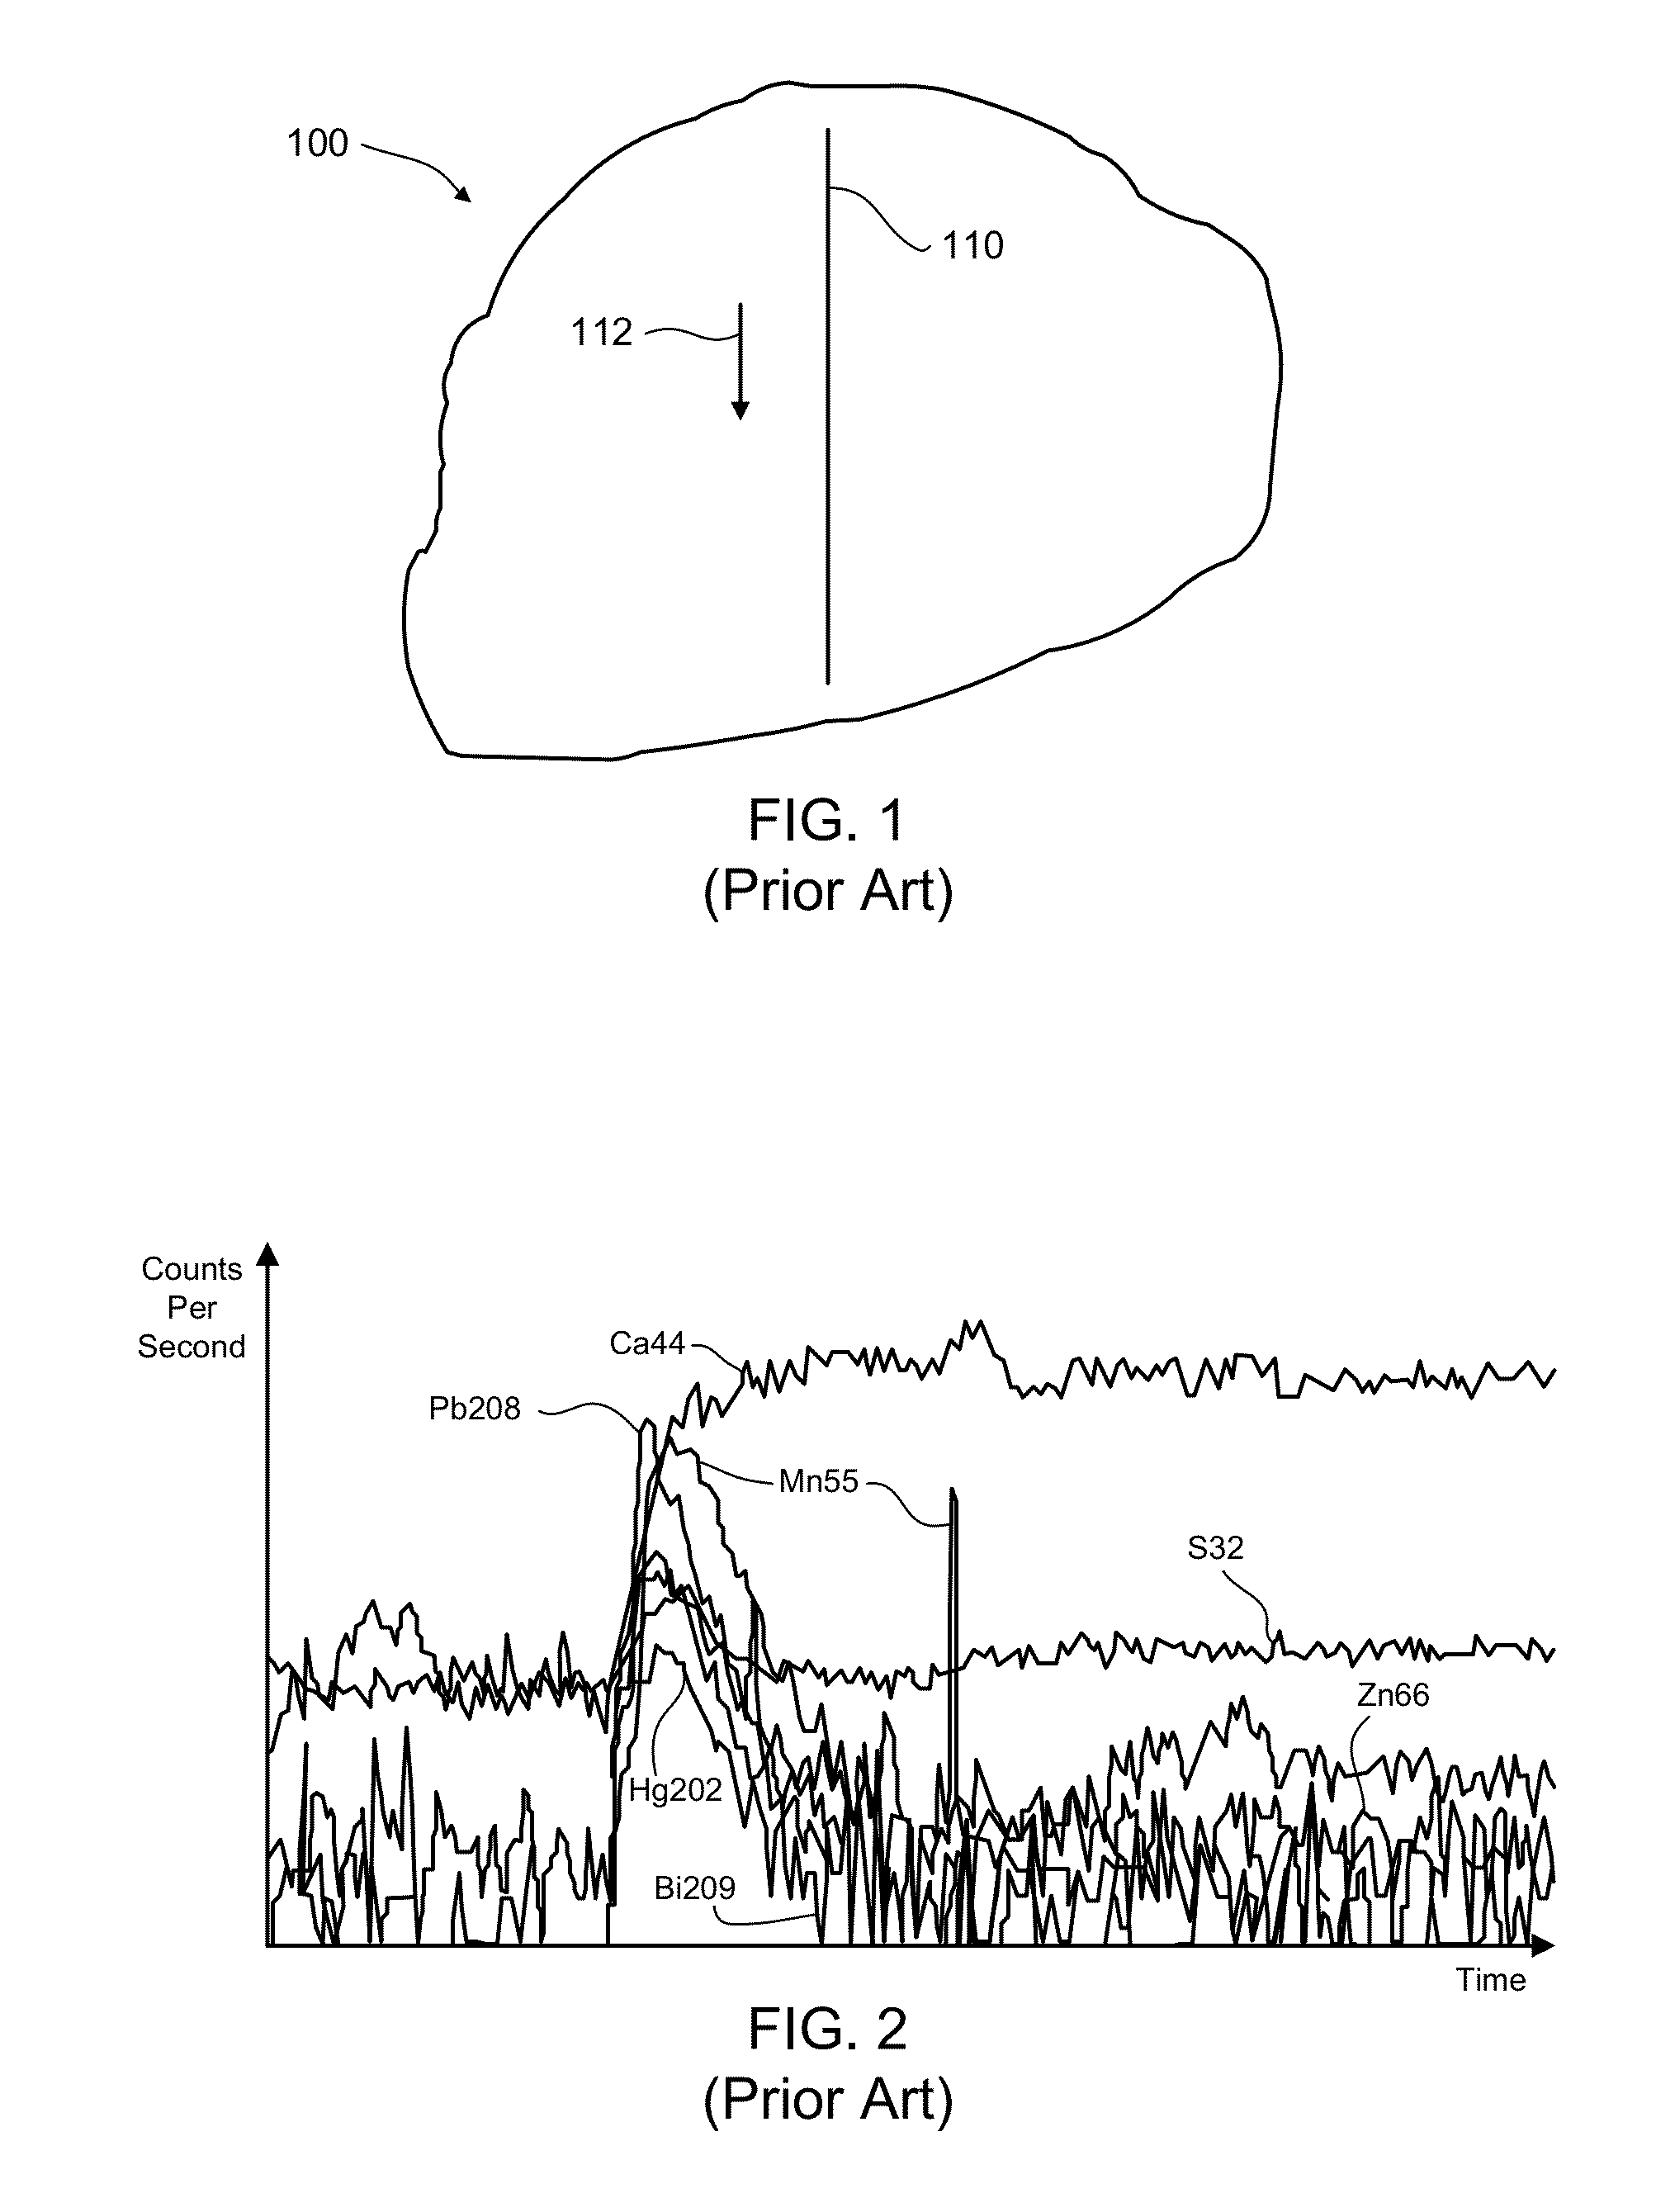
A problem with the graphs shown in FIG. 2 is that there is no correlation to physical locations on the surface of the sample 100 relative to where the material was extracted for generating the displayed data.

Method used


Image

  • Spectroscopy data display systems and methods
  • Spectroscopy data display systems and methods
  • Spectroscopy data display systems and methods

Examples


Embodiment Construction

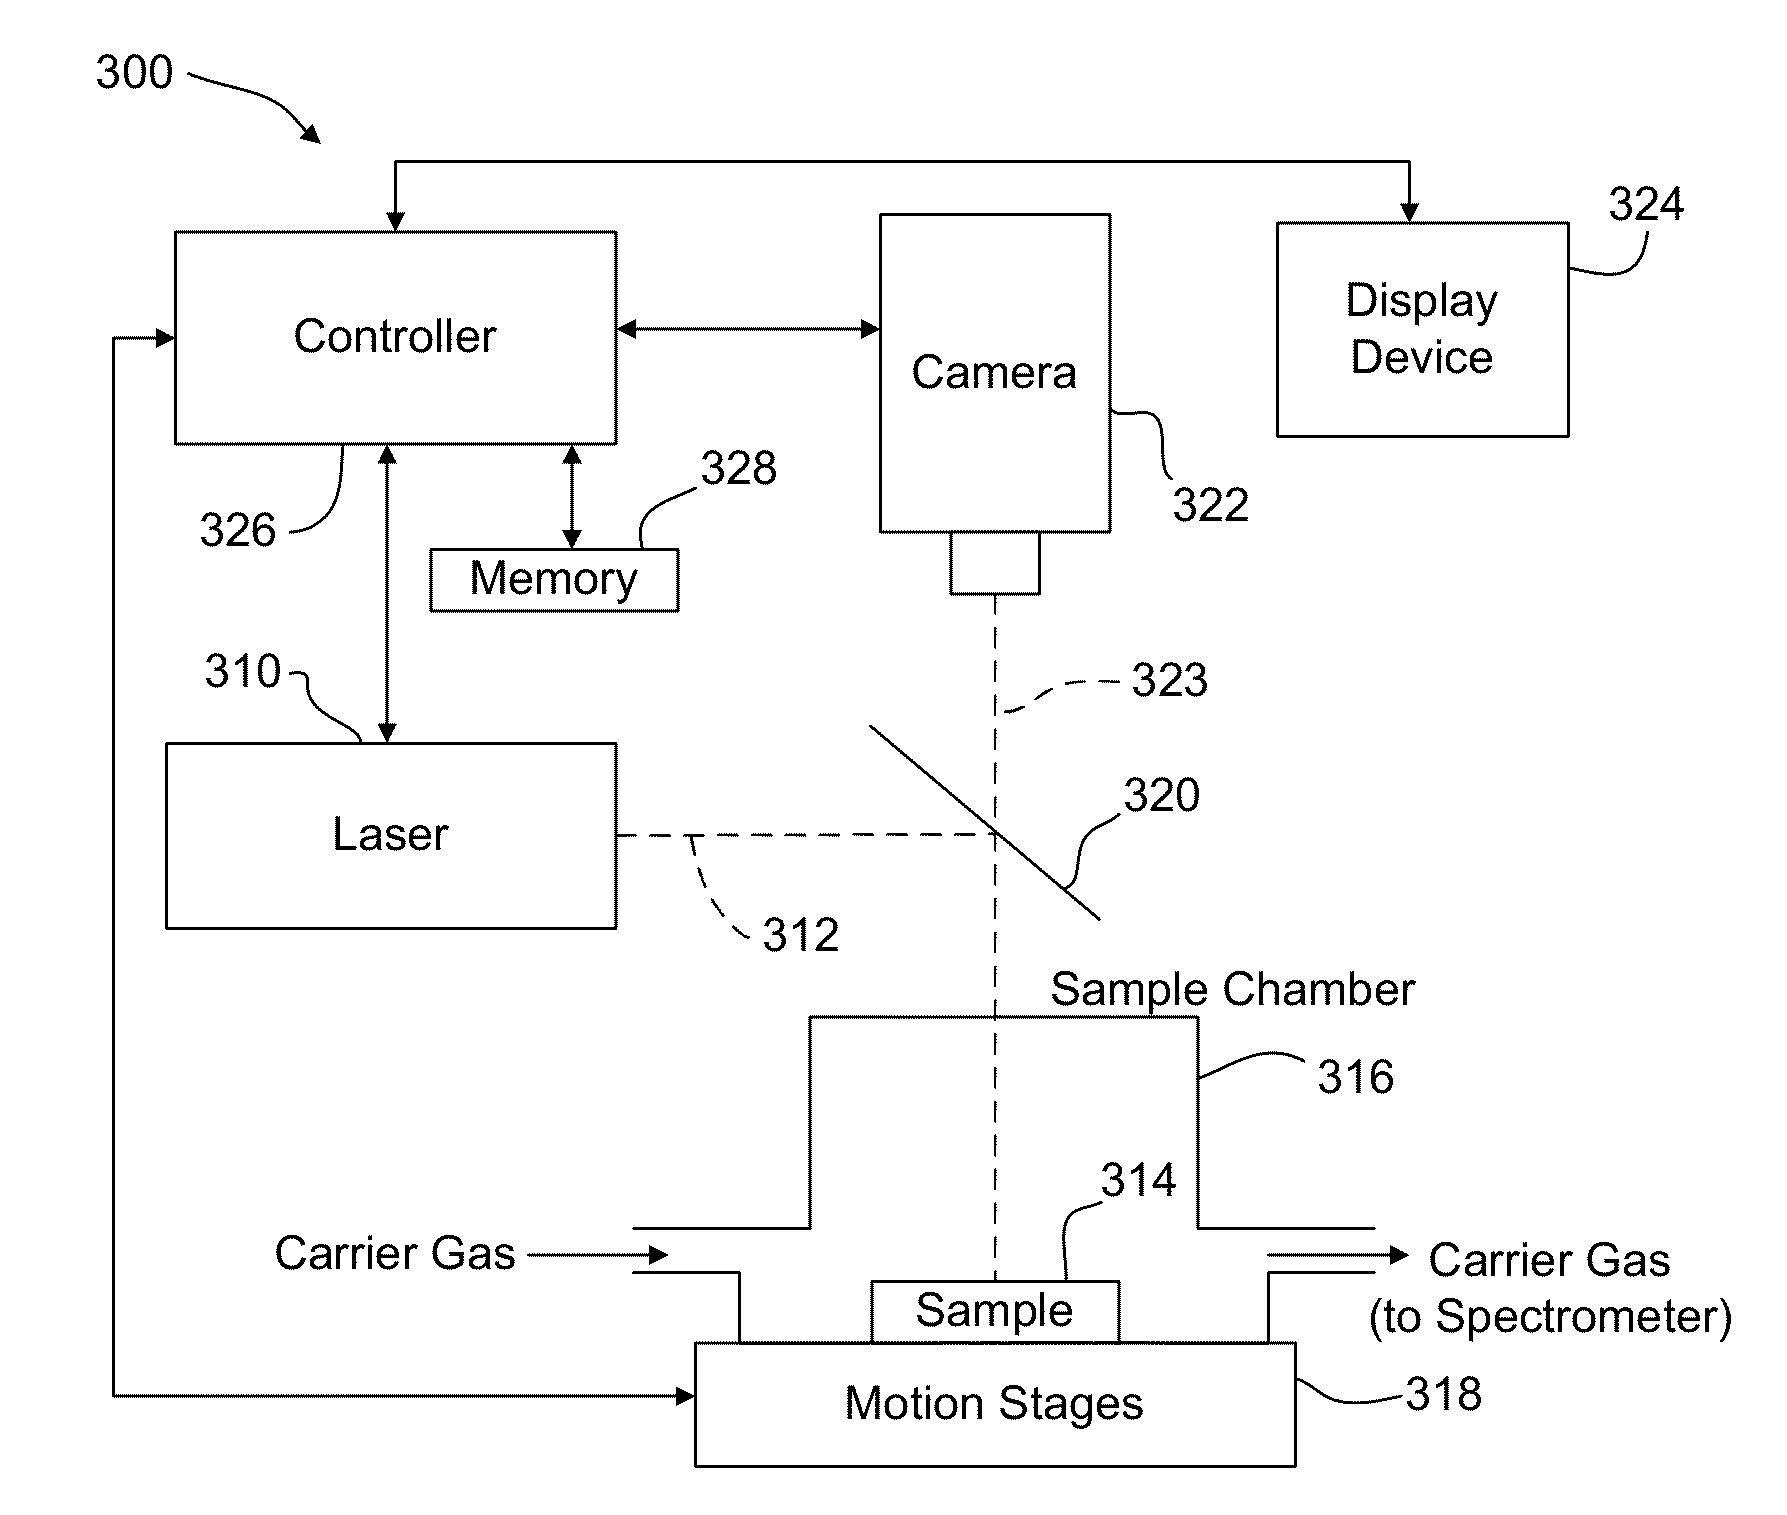
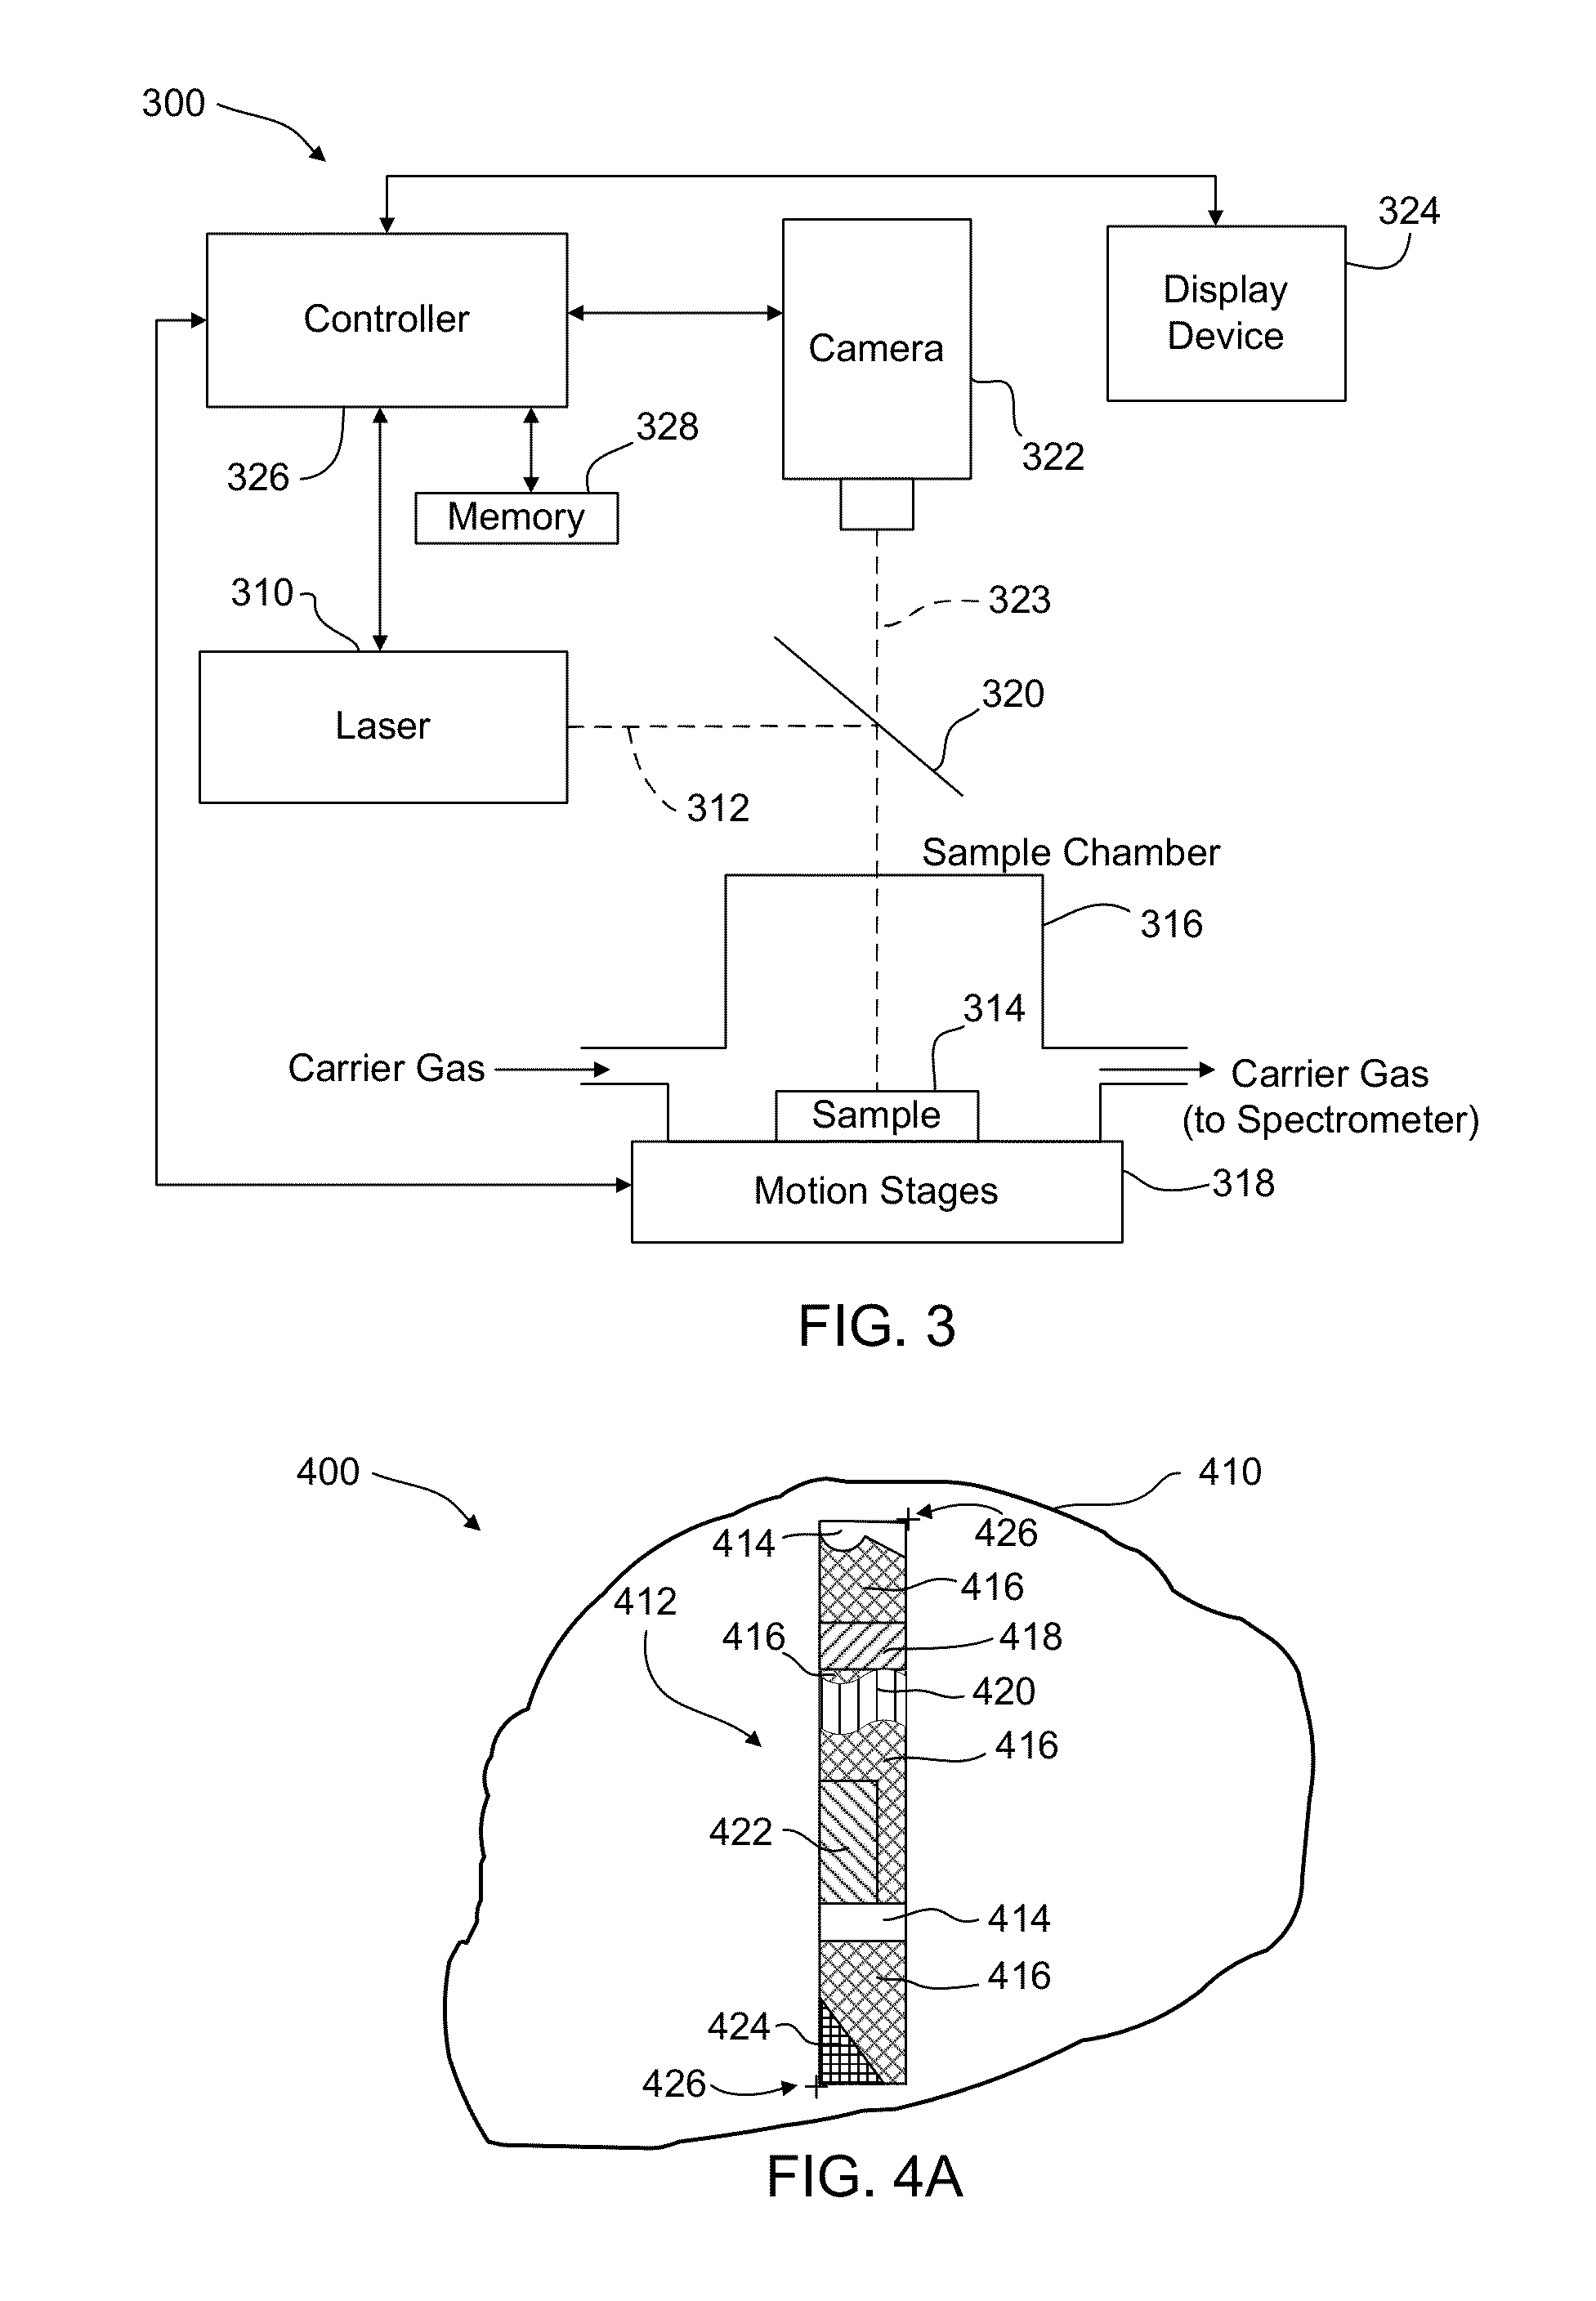
[0018]Spectroscopy data are correlated to physical locations on a sample. The correlation may use, for example, location data (e.g., X, Y, and / or Z data) of a laser beam trajectory along a surface (or below the surface) of the sample, scan velocity data, and system delay data to accurately match spectrometer output to geographic locations on or within the sample. The spectroscopy data may include elemental concentrations and / or detector responses associated with concentrations such as volts, counts, counts per second, frequency, and wavelength. The spectroscopy data may also include ratios of responses such as elemental ratios or isotropic ratios. In certain embodiments, the spectroscopy data is acquired using a laser-assisted spectroscopy (LAS) system such as laser ablation inductively coupled plasma mass spectroscopy (LA ICP-MS), laser ablation inductively coupled plasma emission spectroscopy (ICP-OES / ICP-AES), and laser induced breakdown spectroscopy (LIBS)

[0019]Indicia of the sp...


PUM


Abstract

Spectroscopy data are correlated to physical locations on a sample. A laser beam is scanned along a beam trajectory relative to the sample located in a sample chamber. The laser beam disassociates material from the sample along the beam trajectory to produce an aerosol of the disassociated material within the sample chamber. A fluid is passed through the sample chamber to transport the disassociated material to a spectrometer for determining spectroscopy data values of a selected element along the beam trajectory. The spectroscopy data values are correlated with respective locations of the sample along the beam trajectory, and an image is displayed of at least a portion of the sample including the respective locations along the beam trajectory where the material was disassociated by the laser beam. The image includes indicia of the spectroscopy data values at their correlated locations.

Description

TECHNICAL FIELD[0001]This disclosure relates to spectrometer systems. In particular, this disclosure relates to directly correlating spectroscopy data to physical locations on a sample and overlaying indicia of the spectroscopy data over an image of the sample at the corresponding locations.BACKGROUND INFORMATION[0002]Mass spectroscopy is an analytical technique that measures the mass-to-charge ratio of charged particles for determining, for example, the elemental composition of a specimen or sample of matter. Laser-assisted spectroscopy (LAS) involves directing laser energy at a sample in order to disassociate its constituent parts and make them available to a spectrometer. LAS systems apply the laser energy to the sample while passing a fluid, typically an inert gas, over the sample to capture the disassociated species and carry them to a spectroscope for processing. Example LAS systems include laser ablation inductively coupled plasma mass spectroscopy (LA ICP-MS), laser ablation...

Claims


Application Information

Patent Timeline
Patent Type & Authority Applications(United States)
IPC IPC(8): H01J49/14H01J49/04
CPCH01J49/0004H01J49/105H01J49/0463H01J49/0036G01N21/01G01N21/718G01N27/64
Inventor CLEM, WILLIAM E.WILKINS, JAY N.SUMMERFIELD, LEIF
Owner ELEMENTAL SCI LASERS LLC
Learn More