System and method for analyzing gis data to improve operation and monitoring of water distribution networks

a technology of gis data and system, applied in the field of monitoring and operating resource distribution networks, can solve the problems of increasing water scarcity, ineffective use of gis and asset data in current systems monitoring utility networks, and increasing water scarcity

Active Publication Date: 2013-08-15
TAKADU
View PDF12 Cites 140 Cited by
  • Summary
  • Abstract
  • Description
  • Claims
  • Application Information

AI Technical Summary

Benefits of technology

[0012]Methods and systems are provided for improved modeling, monitoring and operation of a utility network. One such method includes retrieving geographical information system (GIS) data, asset management data, and sensor archive data of one or more assets of the utility network. The method also includes generating one or more mathematical graph elements from the one or more assets and creating probable connections between the one or more mathematical graph elements based on the GIS and asset management data. A mathematical graph is generated based on the probable connections to obtain more complete GIS data. The mathematical graph includes one or more asset characteristics of the one or more assets. Analysis is performed on the utility network using the mathematical graph and the mathematical graph data of the utility network is stored for use by other systems within the utility network.
[0013]In some embodiments, the GIS data includes one or more GIS layers. GIS layers may further include an asset layer, a pipe layer, and a zone layer. Mathematical graph elements include at least one of nodes, edges, and polygons. The generated mathematical graph includes at least one of a directed graph, undirected graph, mixed graph, multi-graph, simple graph, weighted graph, and Cartesian graph. Analysis performed on the mathematical graph includes at least one of a graphical, geometrical, numerical, differential, functional, and algebraic analysis.
[0014]In certain embodiments, performing analysis on the utility network using the mathematical graph includes determining one or more consumption equations from the analysis of the mathematical graph. Performing analysis on the utility network using the mathematical graph may also include identifying flow monitoring zone (FMZ) characteristics of the utility network. Identifying FMZ characteristics include identifying split FMZs, almost split FMZs, single point of failure, and neighboring FMZs. Performing analysis on the utility network using the mathematical graph may also include generating warnings and suggested maintenance recommendations. Generating warnings and suggested maintenance recommendations includes presenting one or more physical locations on the mathematical graph.
[0015]Performing analysis on the utility network using the mathematical graph may also include locating optimal meter locations. Locating optimal meter locations includes presenting one or more physical locations on the mathematical graph. In one embodiment, locating optimal meter locations includes performing balanced cuts on the mathematical graph to partition a FMZ into sub-areas. In another embodiment, locating optimal meter locations includes identifying k-center nodes on the mathematical graph. Generating the mathematical graph structure including the plurality of mathematical graph elements may include arranging the plurality of mathematical graph elements on the mathematical graph based on the created connections.
[0016]In another aspect, the present invention provides for prioritizing areas for maintenance in a utility network. The method includes receiving a training set of historical leak data of the utility network. The method also includes receiving one or more feature values for the historical leak or failure data, the one or more feature values including factors that influence leakage rates and generating a model from the training set and the one or more feature values. The model is provided with one or more current leak locations within the utility network and associated feature values, and predicted leakage or failure rates are obtained for the one or more current leak locations from the model.
[0017]According to one embodiment of this aspect of the present invention, the predicted leakage rates can be utilized to determine field work priority wherein higher predicted leakage rates are given higher priority. Retrieving one or more feature values associated with the network areas comprises analyzing GIS data, asset data, and historical repair data. The one or more feature values may include age of hardware, pipe fittings, and valves. Feature values may also include network complexity. The network complexity may include the amount of pipes, fittings, valves, and service connections. The one or more feature values may further include geographical properties that contribute to more leaks being hidden, pressure based on topography and pressure meter readings, rate of leaks estimated from historical repair files and computational analysis of historical data from flow and pressure meters, leak frequency, loss rate, hidden time, and total costs. Generating a model from the one or more feature values of the training set may also include using a least one of linear regression, non-linear regression, decision trees, neural networks, k-nearest neighbor, and support vector machines.

Problems solved by technology

As populations increase across the globe they call for an increased allocation of clean water for use, resulting in increased water scarcity.
However, effective use of GIS and asset data is not being made in current systems that monitor utility networks.

Method used


Image

  • System and method for analyzing gis data to improve operation and monitoring of water distribution networks
  • System and method for analyzing gis data to improve operation and monitoring of water distribution networks
  • System and method for analyzing gis data to improve operation and monitoring of water distribution networks

Examples


Embodiment Construction

[0024]In the following description of the embodiments of the invention, reference is made to the accompanying drawings that form a part hereof, and in which is shown by way of illustration, exemplary embodiments in which the invention may be practiced. It is to be understood that other embodiments may be utilized and structural changes may be made without departing from the scope of the present invention.

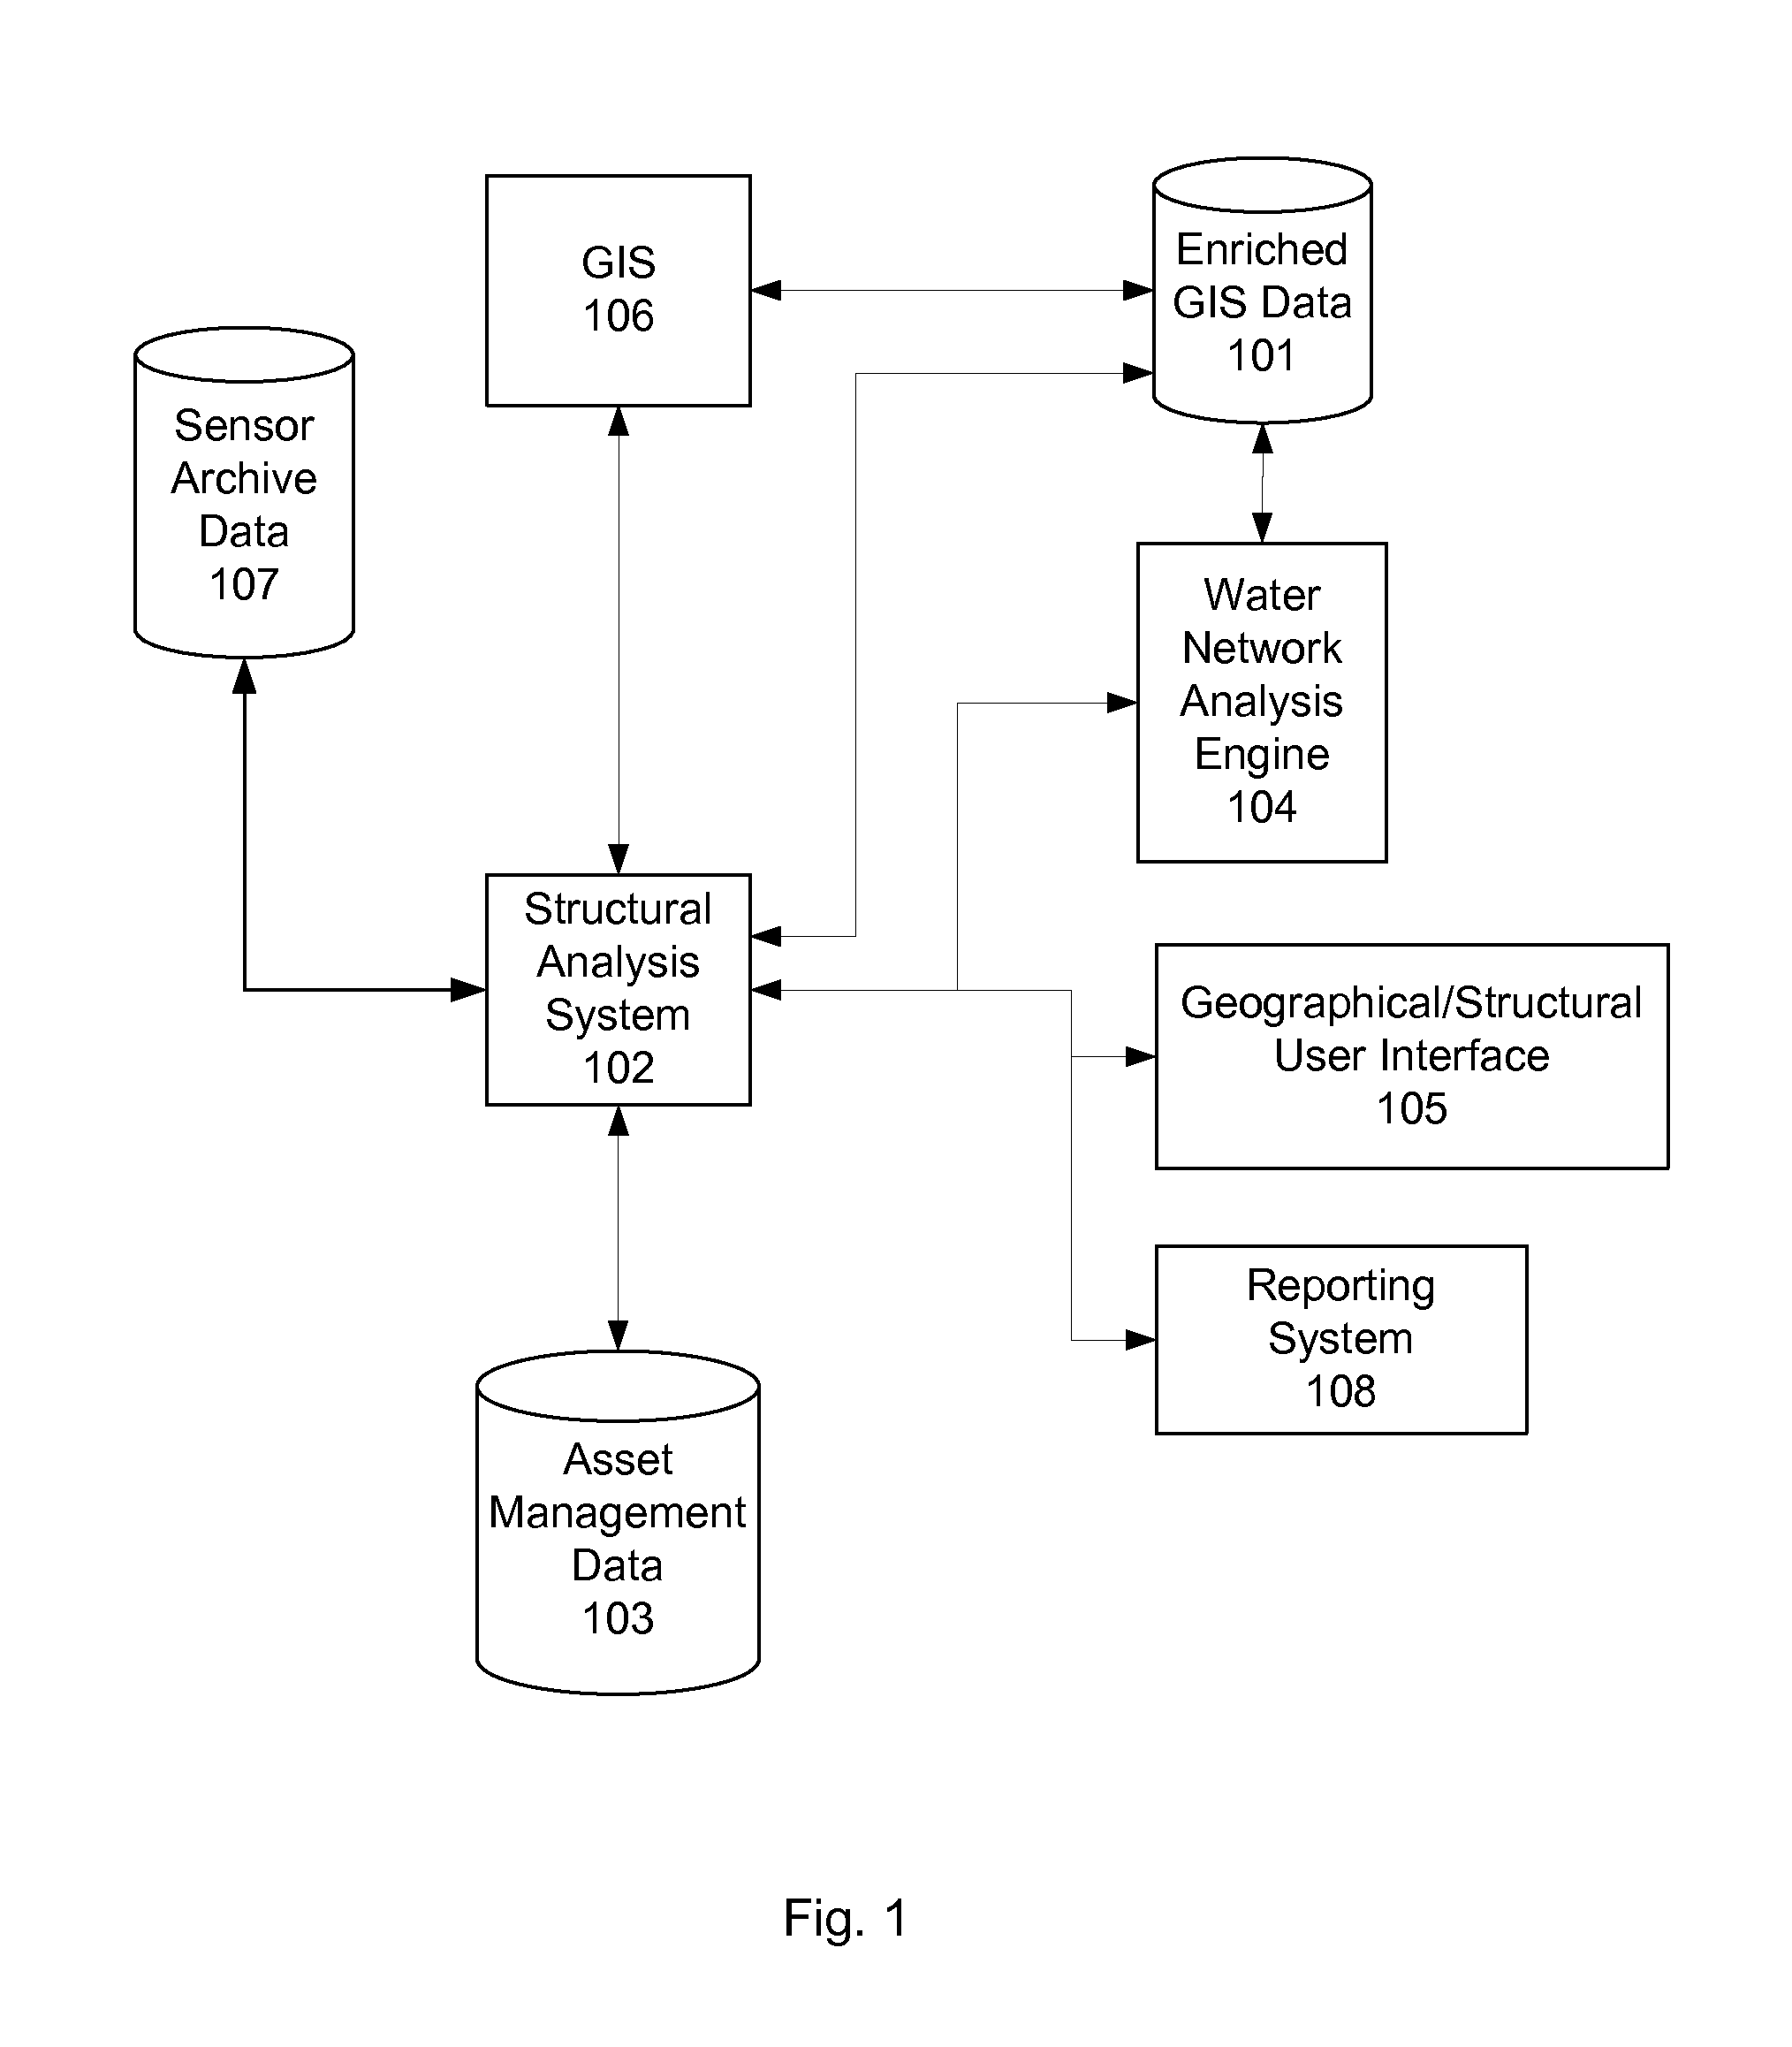
[0025]FIG. 1 presents a block diagram illustrating one embodiment of a system for analyzing and monitoring assets and their geographical layout in a water distribution system. As shown in FIG. 1, the system includes a structural analysis system 102 operable to retrieve data from several sources including asset management database 103, geographic information system (GIS) 106, and sensor archive database 107, to analyze the retrieved data in accordance with processes described herein, and to output the resulting data to enriched GIS database 101. The enriched GIS data 101 can then be ...


PUM


Abstract

A computerized method for modeling a utility network. The method includes retrieving geographical information system (GIS) data, asset management data, and sensor archive data of one or more assets of the utility network. The method also includes generating one or more mathematical elements from the one or more assets and creating probable connections between the one or more mathematical graph elements based on the GIS and asset data. A mathematical graph is generated based on the probable connections, the mathematical graph including one or more asset characteristics of the one or more assets. Analysis is performed on the utility network using the mathematical graph and the mathematical graph data is stored for use by other systems within the utility network.

Description

CROSS REFERENCE TO RELATED APPLICATIONS[0001]The present application is related to:[0002]U.S. patent application Ser. No. 12 / 717,944, entitled “SYSTEM AND METHOD FOR MONITORING RESOURCES IN A WATER UTILITY NETWORK,” filed on Mar. 5, 2010, now issued as U.S. Pat. No. 7,920,983;[0003]U.S. patent application Ser. No. 13 / 008,819, entitled “SYSTEM AND METHOD FOR IDENTIFYING LIKELY GEOGRAPHICAL LOCATIONS OF ANOMALIES IN A WATER UTILITY NETWORK,” filed on Jan. 18, 2011; and[0004]U.S. patent application Ser. No. 13 / 313,261, entitled “SYSTEM AND METHOD FOR IDENTIFYING RELATED EVENTS IN A RESOURCE NETWORK MONITORING SYSTEM,” filed on Dec. 7, 2011;the disclosures of which are hereby incorporated herein by reference in their entirety.COPYRIGHT NOTICE[0005]A portion of the disclosure of this patent document contains material, which is subject to copyright protection. The copyright owner has no objection to the facsimile reproduction by anyone of the patent document or the patent disclosure, as i...

Claims


Application Information

Patent Timeline
Patent Type & Authority Applications(United States)
IPC IPC(8): G06F17/10
CPCG06Q50/06G06Q10/0639
Inventor SCOLNICOV, HAGGAIARMON, AMITAILINHART, CHAIMBIEN, LILACH
Owner TAKADU
Why Eureka
Try Eureka