
Dynamic and Differential Analysis

a technology of differential analysis and dynamic analysis, applied in the field of dynamic and differential analysis, can solve the problems of inability to identify high gleason cancers, risk and side effects, excessive recurrence, etc., and achieve the effects of saving lives, reducing morbidity of unwarranted biopsies and overtreatment, and improving prostate cancer screening

Inactive Publication Date: 2014-05-29
SOAR BIODYNAMICS
View PDF0 Cites 0 Cited by
  • Summary
  • Abstract
  • Description
  • Claims
  • Application Information

AI Technical Summary

Benefits of technology

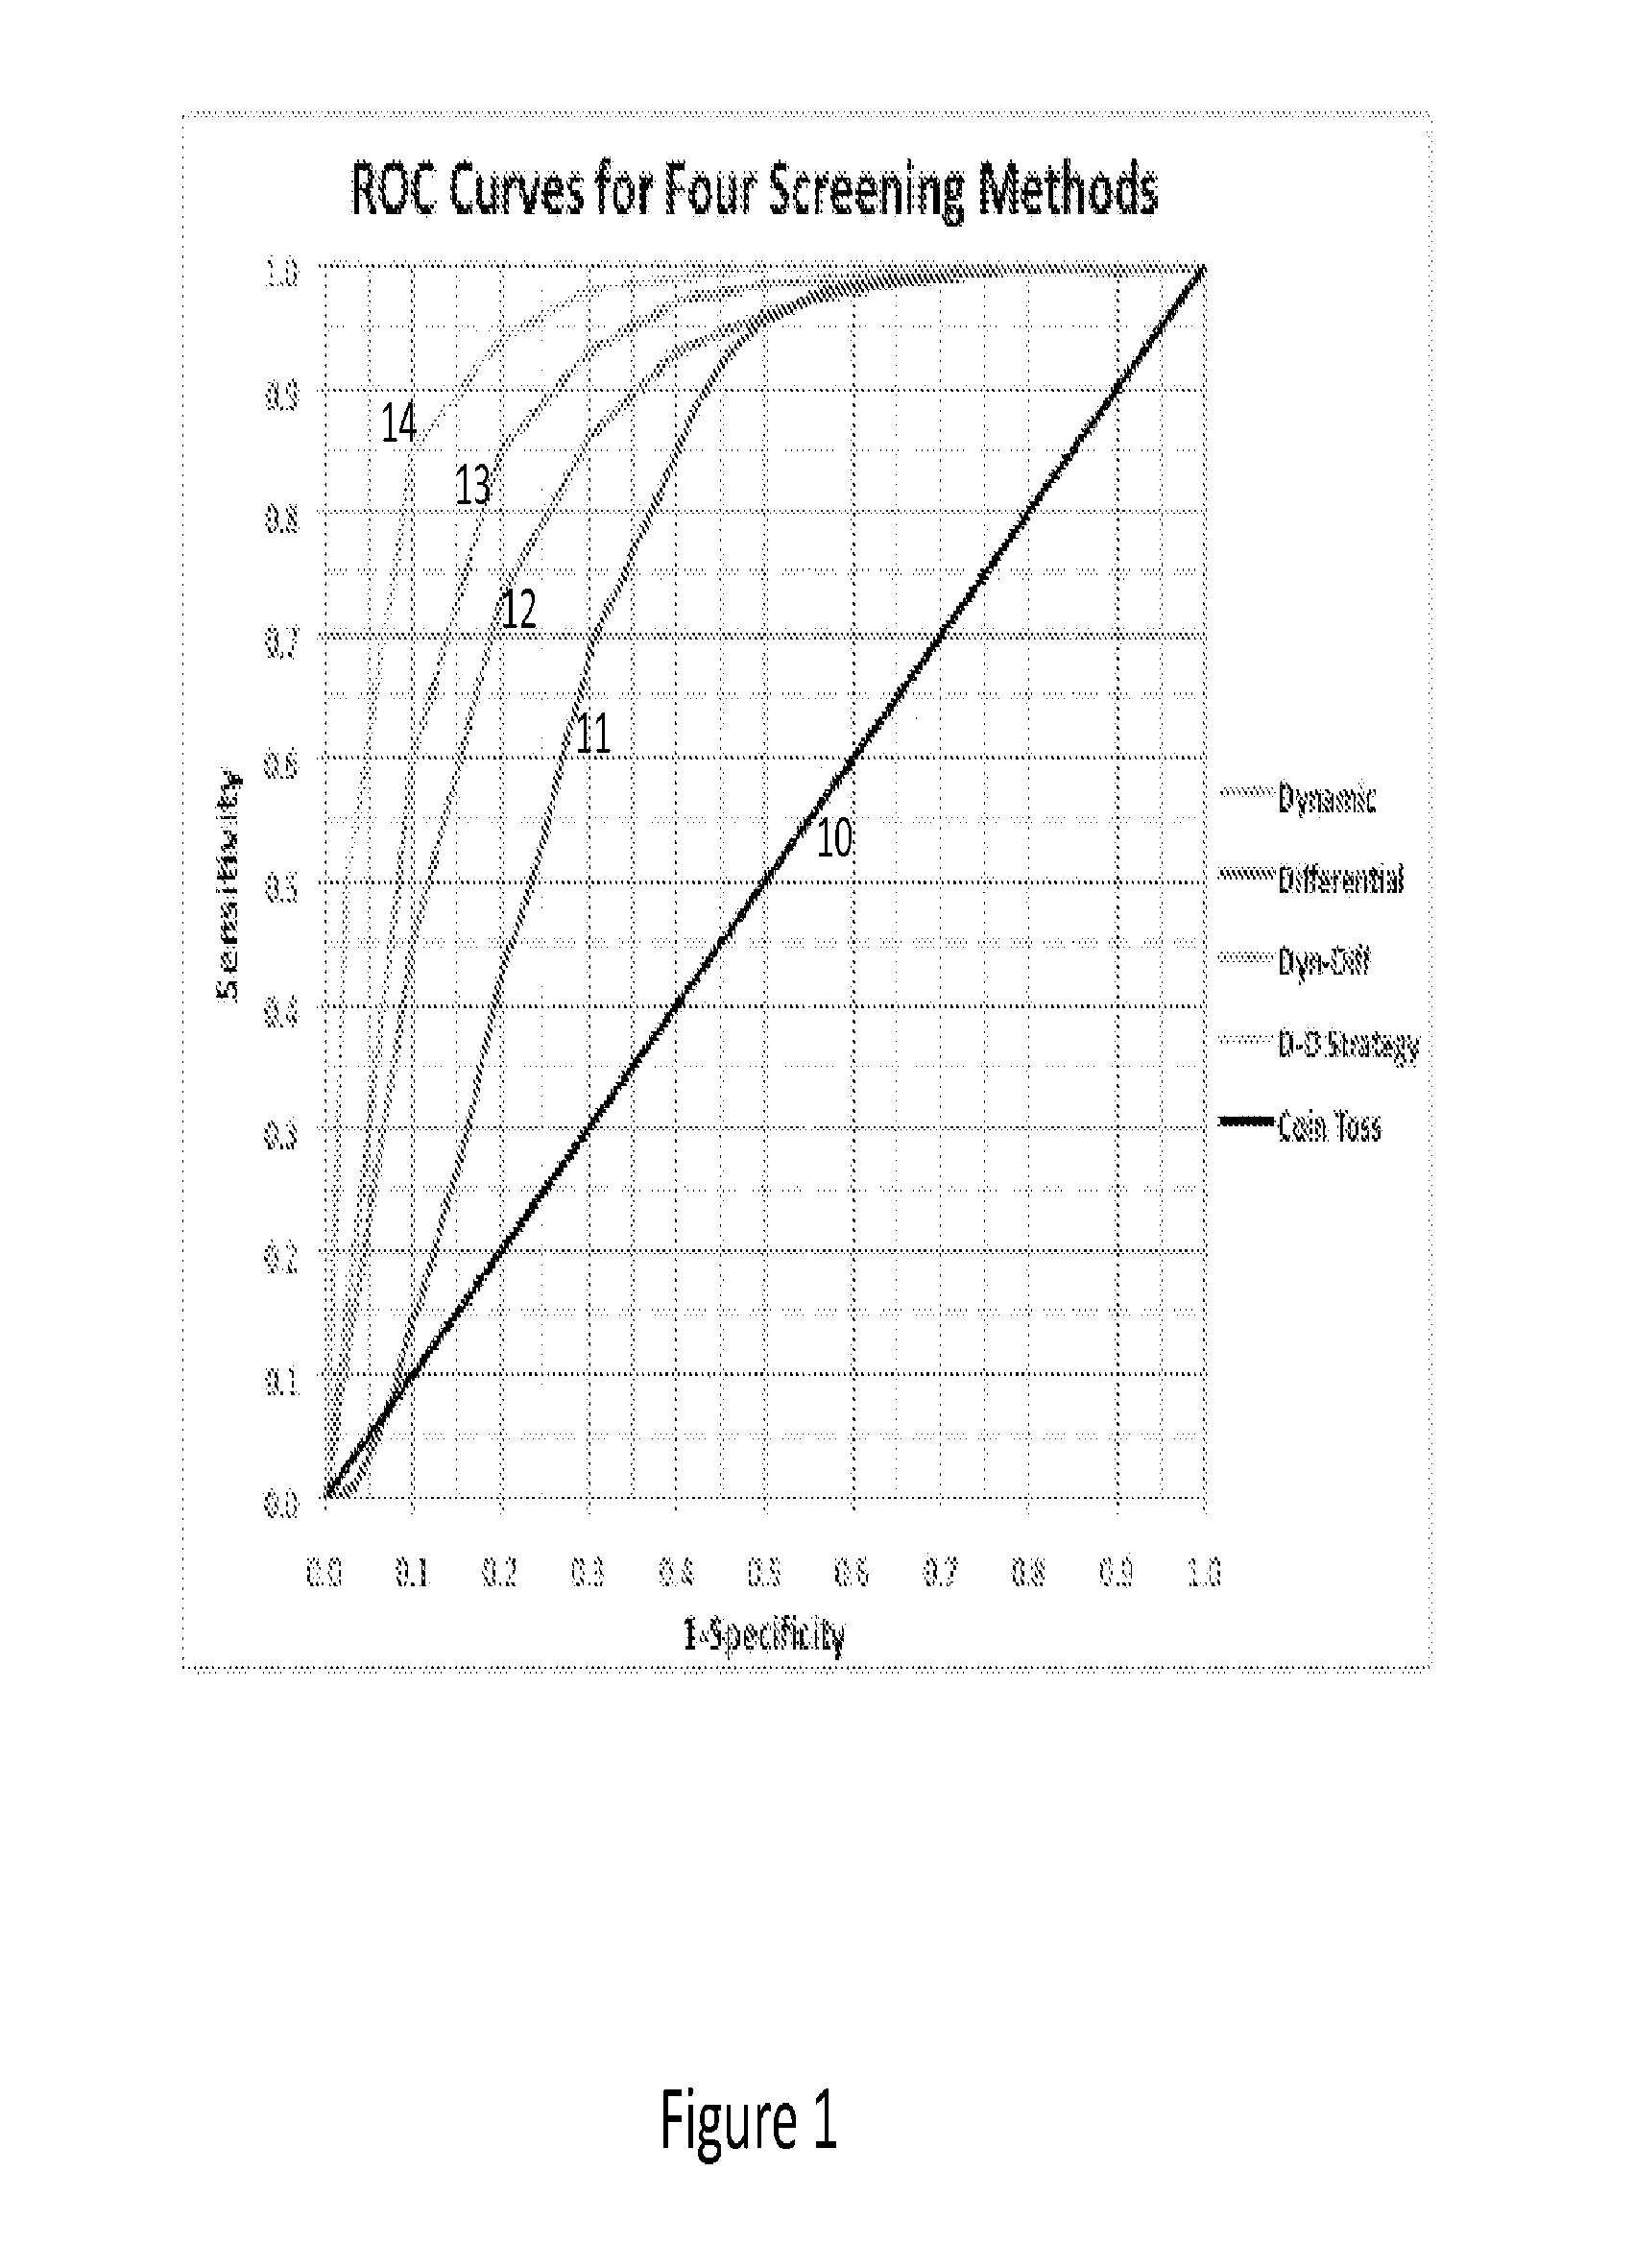
The present invention offers a better way to screen for prostate cancer. It uses advanced techniques to analyze data on PSA levels and variations to differentiate between high-risk cancer and no cancer. The methods include a dynamic analysis that can help save lives and reduce unnecessary procedures.

Problems solved by technology

Biopsies are an invasive procedure, and are associated with a variety of risks and side effects, such as: pain and ongoing discomfort, bleeding and blood in semen, urinary tract infection and problems urinating.
There are three major problems with current prostate cancer screening.
Late detection and treatment is often a cause of excessive recurrence.
Another cause is the inability to identify High Gleason cancers.
Only a small percentage of men with PSA values this high have PSAs that are caused primarily by cancer, resulting in a high false positive rate.
Further, a single PSA test result has poor specificity (especially for values as low as 2.5), so the threshold to trigger further screening is set high to increase specificity.
However, this comes at the cost of late detection and a higher risk of recurrence for a significant percent of patients.
In most cases, treatment of these cancers does not prolong life and has a high chance of reducing the patient's quality of life due to the pain and risks of treatment such as surgery, plus side effects such as impotence and incontinence.
Over-treatment often occurs when BPH and / or prostatitis cause an increase in PSA that triggers a biopsy that inadvertently discovers a small, slow-growing cancer.
Fear by the man and his family and pressures from the medical system often lead to treatment that would have been unnecessary if the biopsy had not been performed.
These weaknesses in currently used PSA screening methods have led the U.S. Preventative Services Task Force to recommend elimination of routine PSA testing for most men.

Method used


Image

  • Dynamic and Differential Analysis
  • Dynamic and Differential Analysis
  • Dynamic and Differential Analysis

Examples


example 1

Dynamic Analysis

Materials and Methods

[0317]1,038 men from the Tyrol screening project and UCSF and CaPSURE databases were analyzed.

[0318]The sources of data were the:[0319]University of California at San Francisco (UCSF) surgery database. Please see: http: / / www.ucsfhealth.org / clinics / prostate_cancer_center / index.html[0320]Cancer of the Prostate Strategic Urologic Research Endeavor (CaPSURE) surgery database managed by UCSF. Please see: http: / / urology.ucsf.edu / capsure / overview.htm[0321]Innsbruck Medical University managed surgery database for the Tyrol region of Austria. Please see, for example: Bartsch et. al., Tyrol Prostate Cancer Demonstration Project: early detection, treatment, outcome, incidence and mortality; Urological Oncology, in BJU International, 101, 809-816, 2008.

[0322]670 men from the Tyrol screening project had no cancer detected by biopsy and at least 5 PSA tests over 4 years with no gap more than 2 years. These men are referred to as the full history no cancer grou...

example 2

Using FPSA to Distinguish Between Different Prostate Conditions

[0346]A simulator was built of a large population of men based on the published evidence about the distribution of cancer, its static and dynamic characteristics, and the results of antibiotic and anti-inflammatory treatment.

[0347]Healthy prostate, cancer, BPH, prostatitis due to infection and prostatitis due to inflammation were distinguished using static, dynamic and / or differential analysis of FPSA and PSA (FPSA %, FPSAV %, and FPSAΔ %, respectively). FPSA and PSA values were measured using Beckman-Coulter Access Immunoassays, which are used for FDA approval for the use of FPSA and FPSA % for prostate cancer screening in conjunction with PSA. FPSA % at various time points were calculated as a ratio of FPSA and PSA. FPSAV and PSAV were calculated based on the slope of a fitted trend at the time of the last test as determined by Dynamic Analysis using a constant+exponential functional form. FPSAV % was calculated as a r...

example 3

Dynamic Analysis

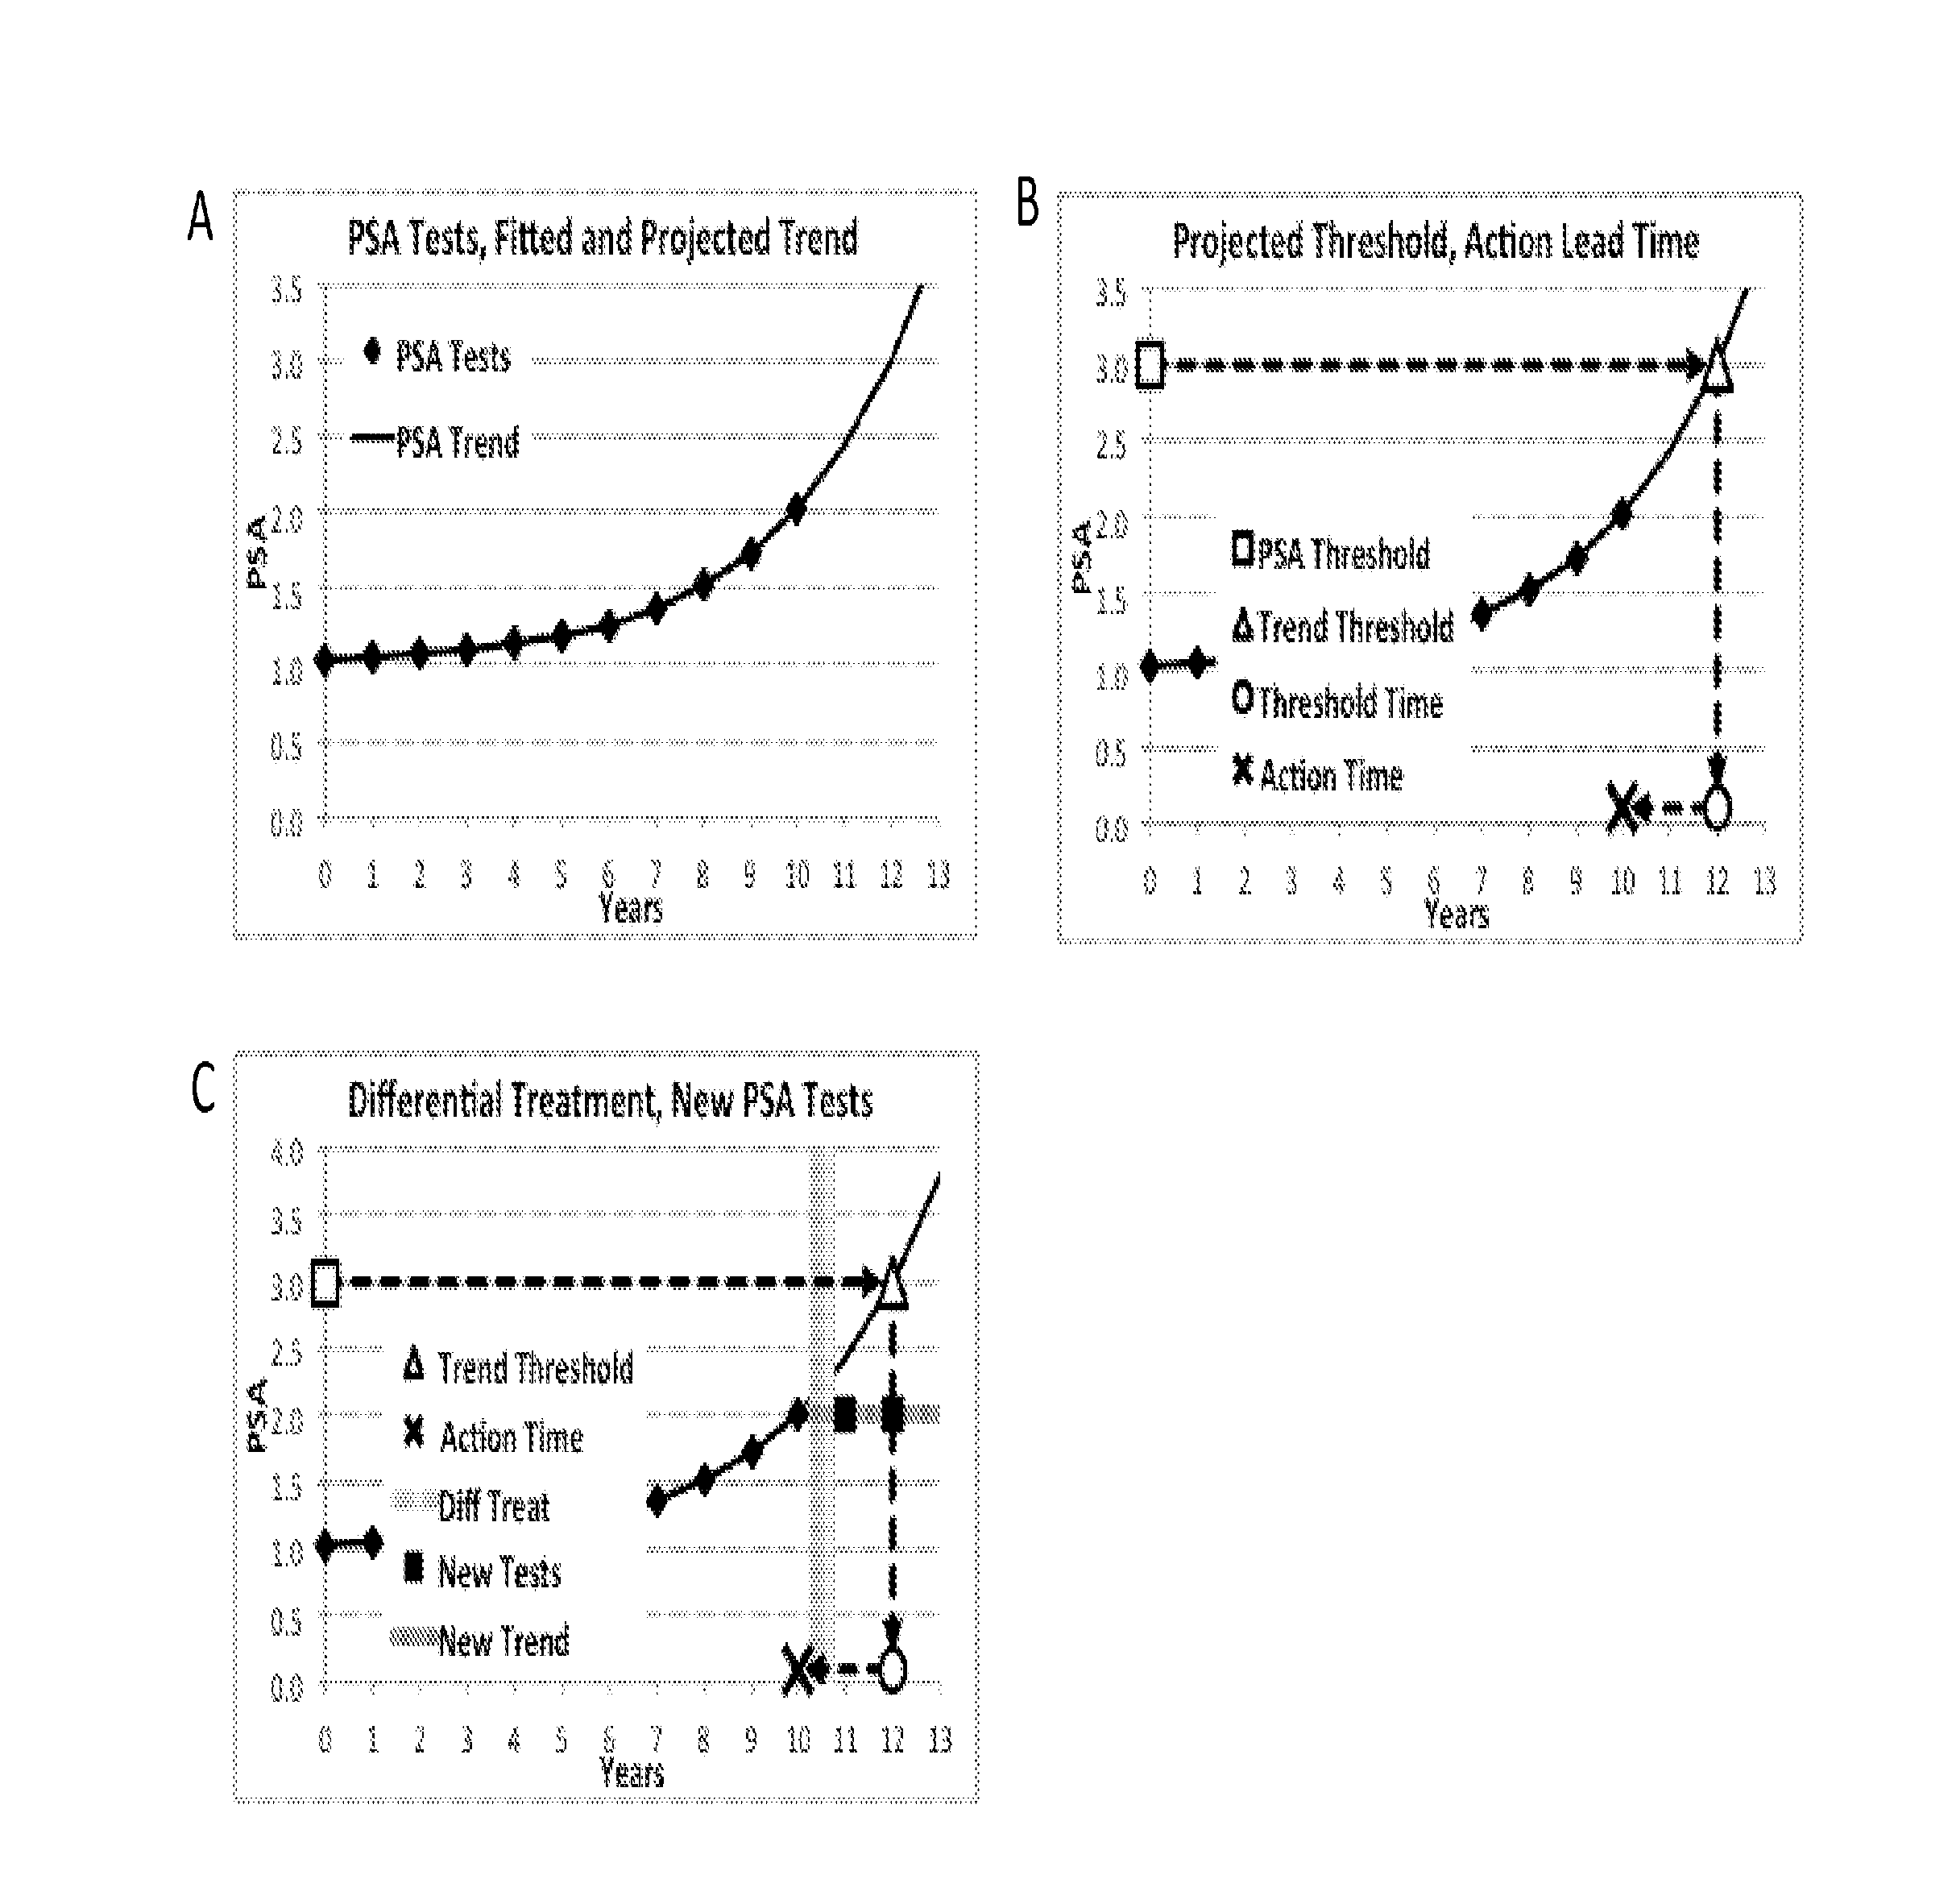
[0370]Estimated and Projected PSA Trends—FIG. 27 shows six calibrated and adjusted PSA test results for an example subject over the last five years. A total consistent exponential plus constant PSA trend (272) is estimated using iterative methods to eliminate inconsistent results from the estimation process. An exponential plus constant function is used because PSA from progressing cancer usually grows exponentially and a main interest lies in detecting progressing cancer. The estimated trend is projected into the future (273). Base PSA is estimated (270) as part of the trend estimation process. It is assumed that base PSA (PSAn) is constant or grows very slowly. The estimation process treats it as a constant and projects it into the future at the constant level (271). If cancer is progressing then the difference between total PSA and base PSA is an estimate of PSA from cancer (PSAc). It is used to estimate cancer PSA growth rate (PSAgr=PSAV / PSAc), an important varia...


PUM

PropertyMeasurementUnit
PSAaaaaaaaaaa
PSAsaaaaaaaaaa
pressuresaaaaaaaaaa

Abstract

The present invention provides methods to improve upon prostate cancer screening, thereby saving lives and reducing morbidities of unwarranted biopsies and over-treatment. The methods use a systematic analysis of the growth rate of PSA from cancer and PSA variation and the way in which they might be used to distinguish high-risk cancers from no cancer. Approaches include Dynamic-Differential Strategy, Dynamic-Differential Analysis, and Dynamic Analysis.

Description

CROSS-REFERENCE[0001]This application is a continuation of U.S. patent application Ser. No. 13 / 442,648, filed Apr. 9, 2012 and entitled “Dynamic and Differential Analysis,” to which we claim priority under 35 U.S.C. §120, and which claims the benefit of U.S. Provisional Application No. 61 / 472,975, filed Apr. 7, 2011 and entitled “Dynamic and Differential Analysis.” These two applications are fully incorporated herein by reference.BACKGROUND OF THE INVENTION[0002]Current prostate cancer screening methods typically use an initial screening step that measures one or more biomarkers, such as that of prostate specific antigen (PSA), Free PSA (FPSA), or the ratio of FPSA to PSA (FPSA %). Subjects with a PSA value above a certain threshold, typically 4.0 ng / mL, are then recommended for further screening using prostate biopsies. Biopsies are an invasive procedure, and are associated with a variety of risks and side effects, such as: pain and ongoing discomfort, bleeding and blood in semen, ...

Claims


Application Information

Patent Timeline
Patent Type & Authority Applications(United States)
IPC IPC(8): G01N33/574G16B40/00
CPCG16B40/00G01N33/57434
Inventor NEVILLE, THOMAS
Owner SOAR BIODYNAMICS
Learn More