
Statistical power indication monitor

a technology of power indication and monitor, applied in the field of power monitoring, can solve the problems of excessive power consumption, excessive power consumption, and inability to identify the specific source or cause of excessive power,

Active Publication Date: 2015-07-30
NXP USA INC
View PDF11 Cites 6 Cited by
  • Summary
  • Abstract
  • Description
  • Claims
  • Application Information

AI Technical Summary

Benefits of technology

The present invention relates to a statistical power indication monitor (SPIM) that can statistically monitor power indication signals to identify potential causes of excessive power consumption in an application. The SPIM can provide useful information for determining why an application is consuming more power than estimated, and can help adjust operation of the application to reduce or eliminate excessive power consumption. The SPIM can be implemented as a statistical circuit integrated into an integrated circuit (IC) or as a standalone device. The technical effect of the invention is to provide a more effective and efficient means for monitoring power consumption in applications, particularly those that are battery-powered, and to identify the specific sources or causes of excessive power consumption.

Problems solved by technology

Many applications, however, even with the most careful design of task structure and scheduling, initially exceed the target power budget.
Although there are well-known means of measuring overall power consumption, it is often difficult to identify the specific sources or causes of excessive power.
A significant number factors causing or otherwise contributing to excessive power consumption may be involved, many of which are not easily identifiable or detectable in a code trace or the like.
This conventional approach, however, can have huge drawbacks in that the measurement functions themselves change what is being measured, thereby invalidating the measurements.
For example, by asserting an interrupt, the target CPU goes into full-power mode, thereby making it impossible to gather statistics on that pivotal power-consumption factor.
The interrupt routine modifies cache content causing more cache misses than would normally occur.
Also, since the interrupt routine takes time to execute, samples cannot be taken very often.
Furthermore, many factors that affect power consumption require access to low-level hardware signals, not typically visible to a CPU.
Another drawback to these conventional techniques is that they cannot gather statistics while interrupts are masked, which is often when high-power activities are performed.
Generally, the specific causes of excessive power consumption are not easily determinable using conventional techniques.

Method used


Image

  • Statistical power indication monitor
  • Statistical power indication monitor
  • Statistical power indication monitor

Examples


Embodiment Construction

[0015]The present inventors have recognized that monitoring certain key signals of an application can provide useful information for determining why an application is consuming more power than estimated. The present inventors have therefore developed a statistical power indication monitor that statistically monitors selected signals, referred to herein as power indication signals, that indicate high power circumstances during a selected time interval of application operation to identify potential causes of excessive power consumption. The statistical information may be used to identify the devices, components or systems that are consuming higher-than-anticipated power during operation. The determined statistical and identification information may then be used to adjust operation of the application in order to reduce or otherwise eliminate excessive power consumption, such as by modifying the controlling software.

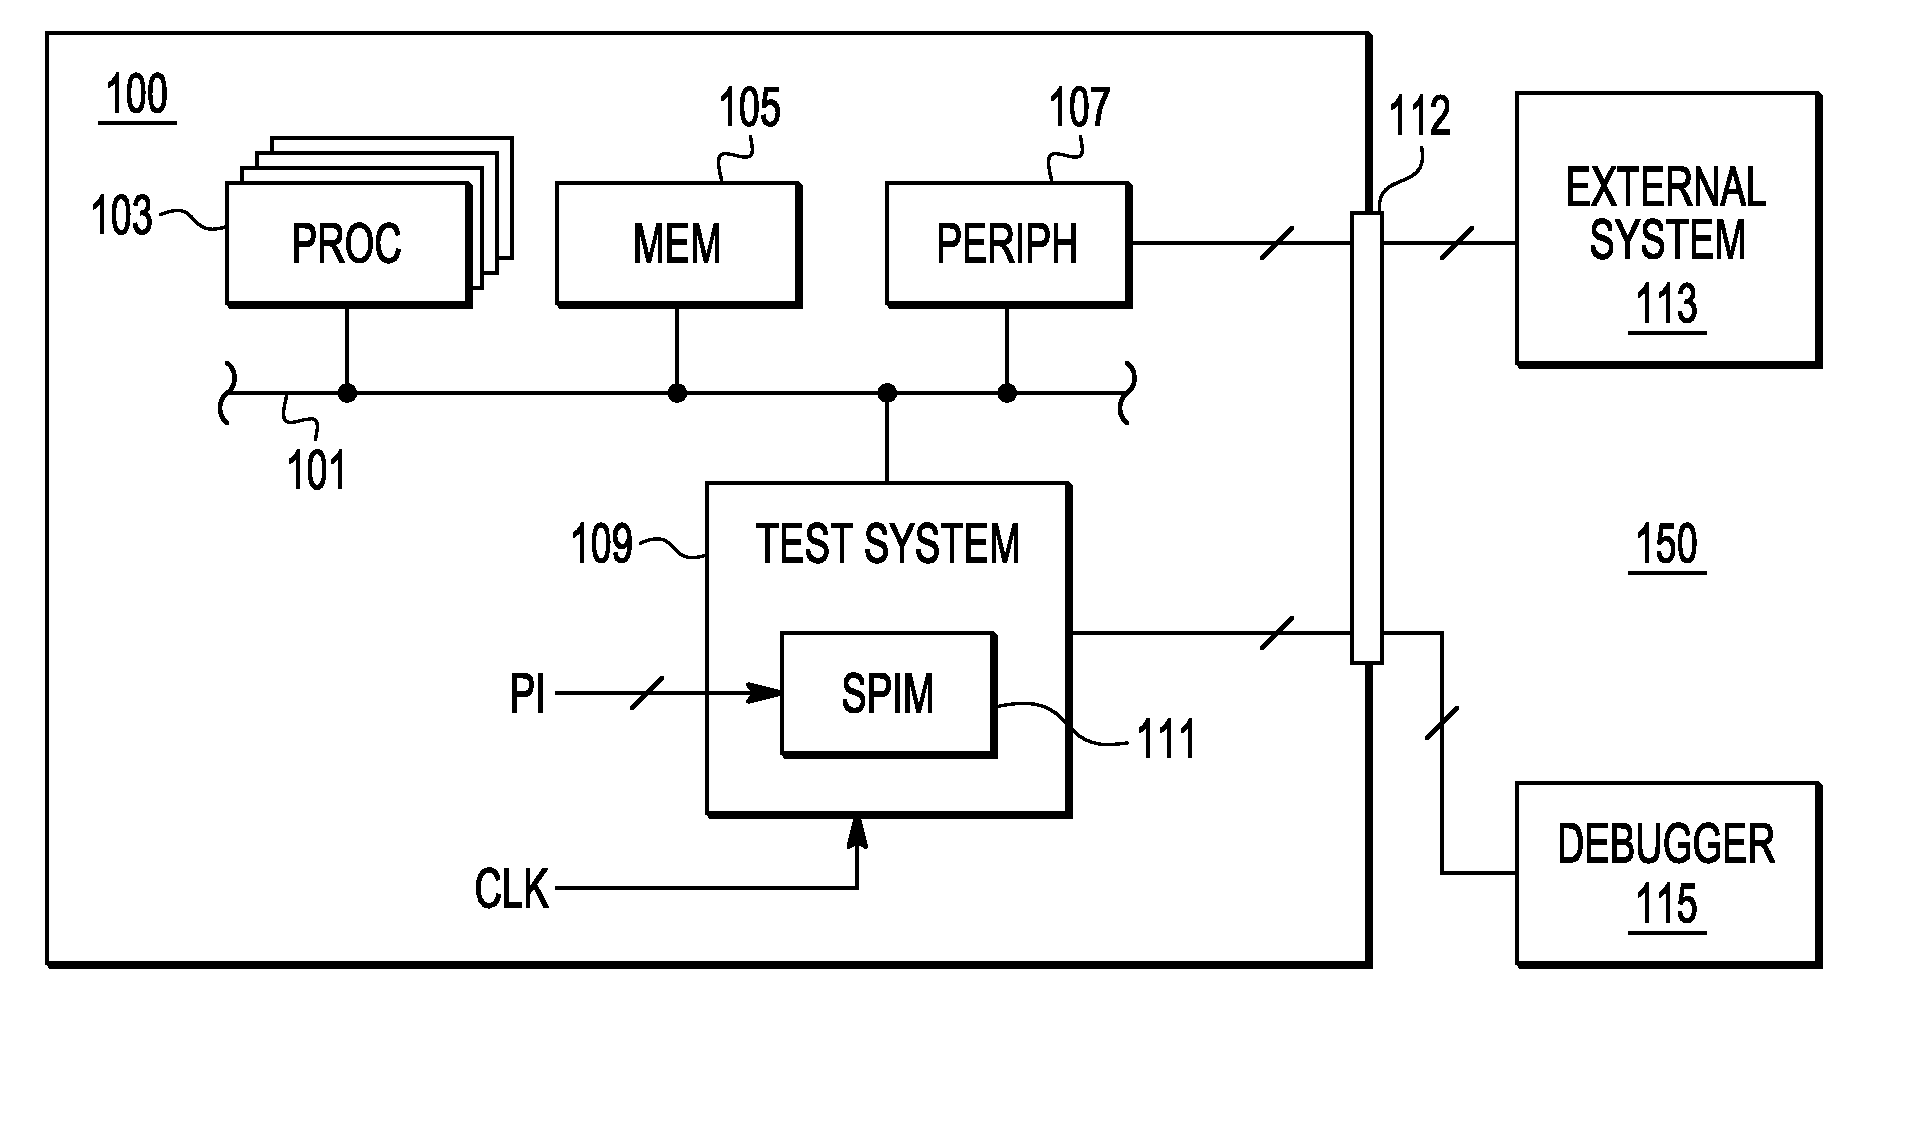
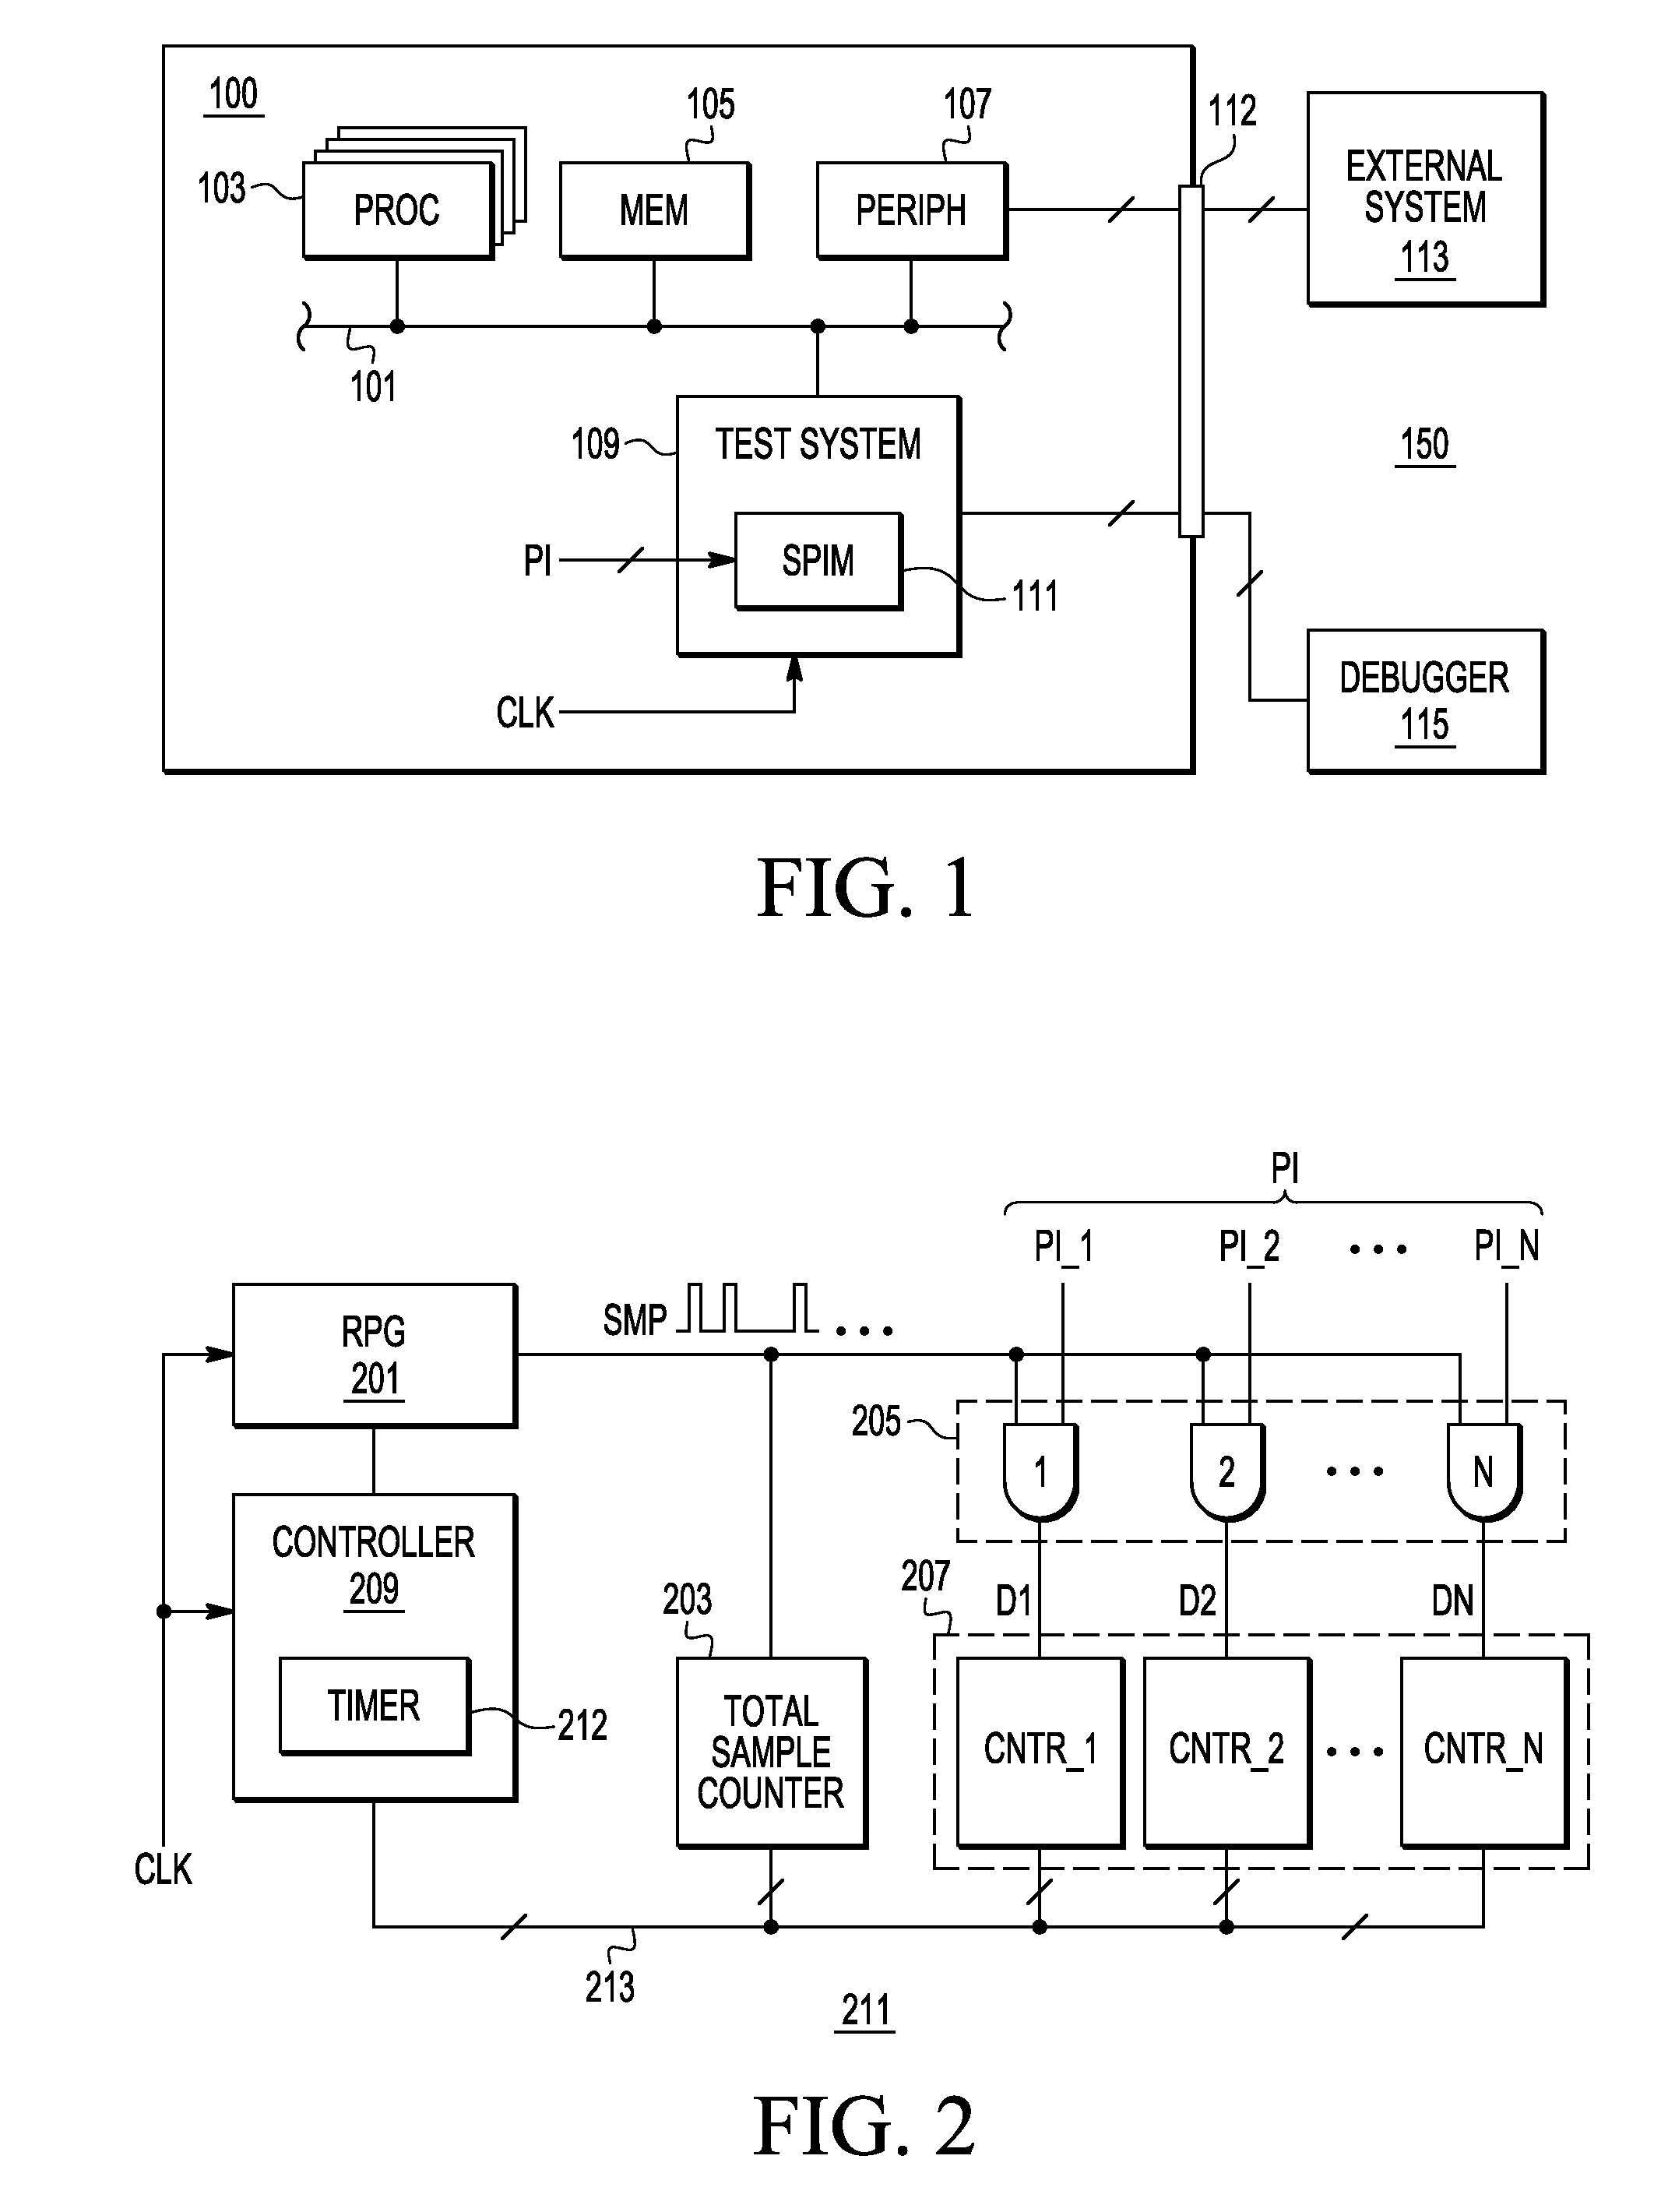
[0016]FIG. 1 is a simplified block diagram of an application system 150...


PUM


Abstract

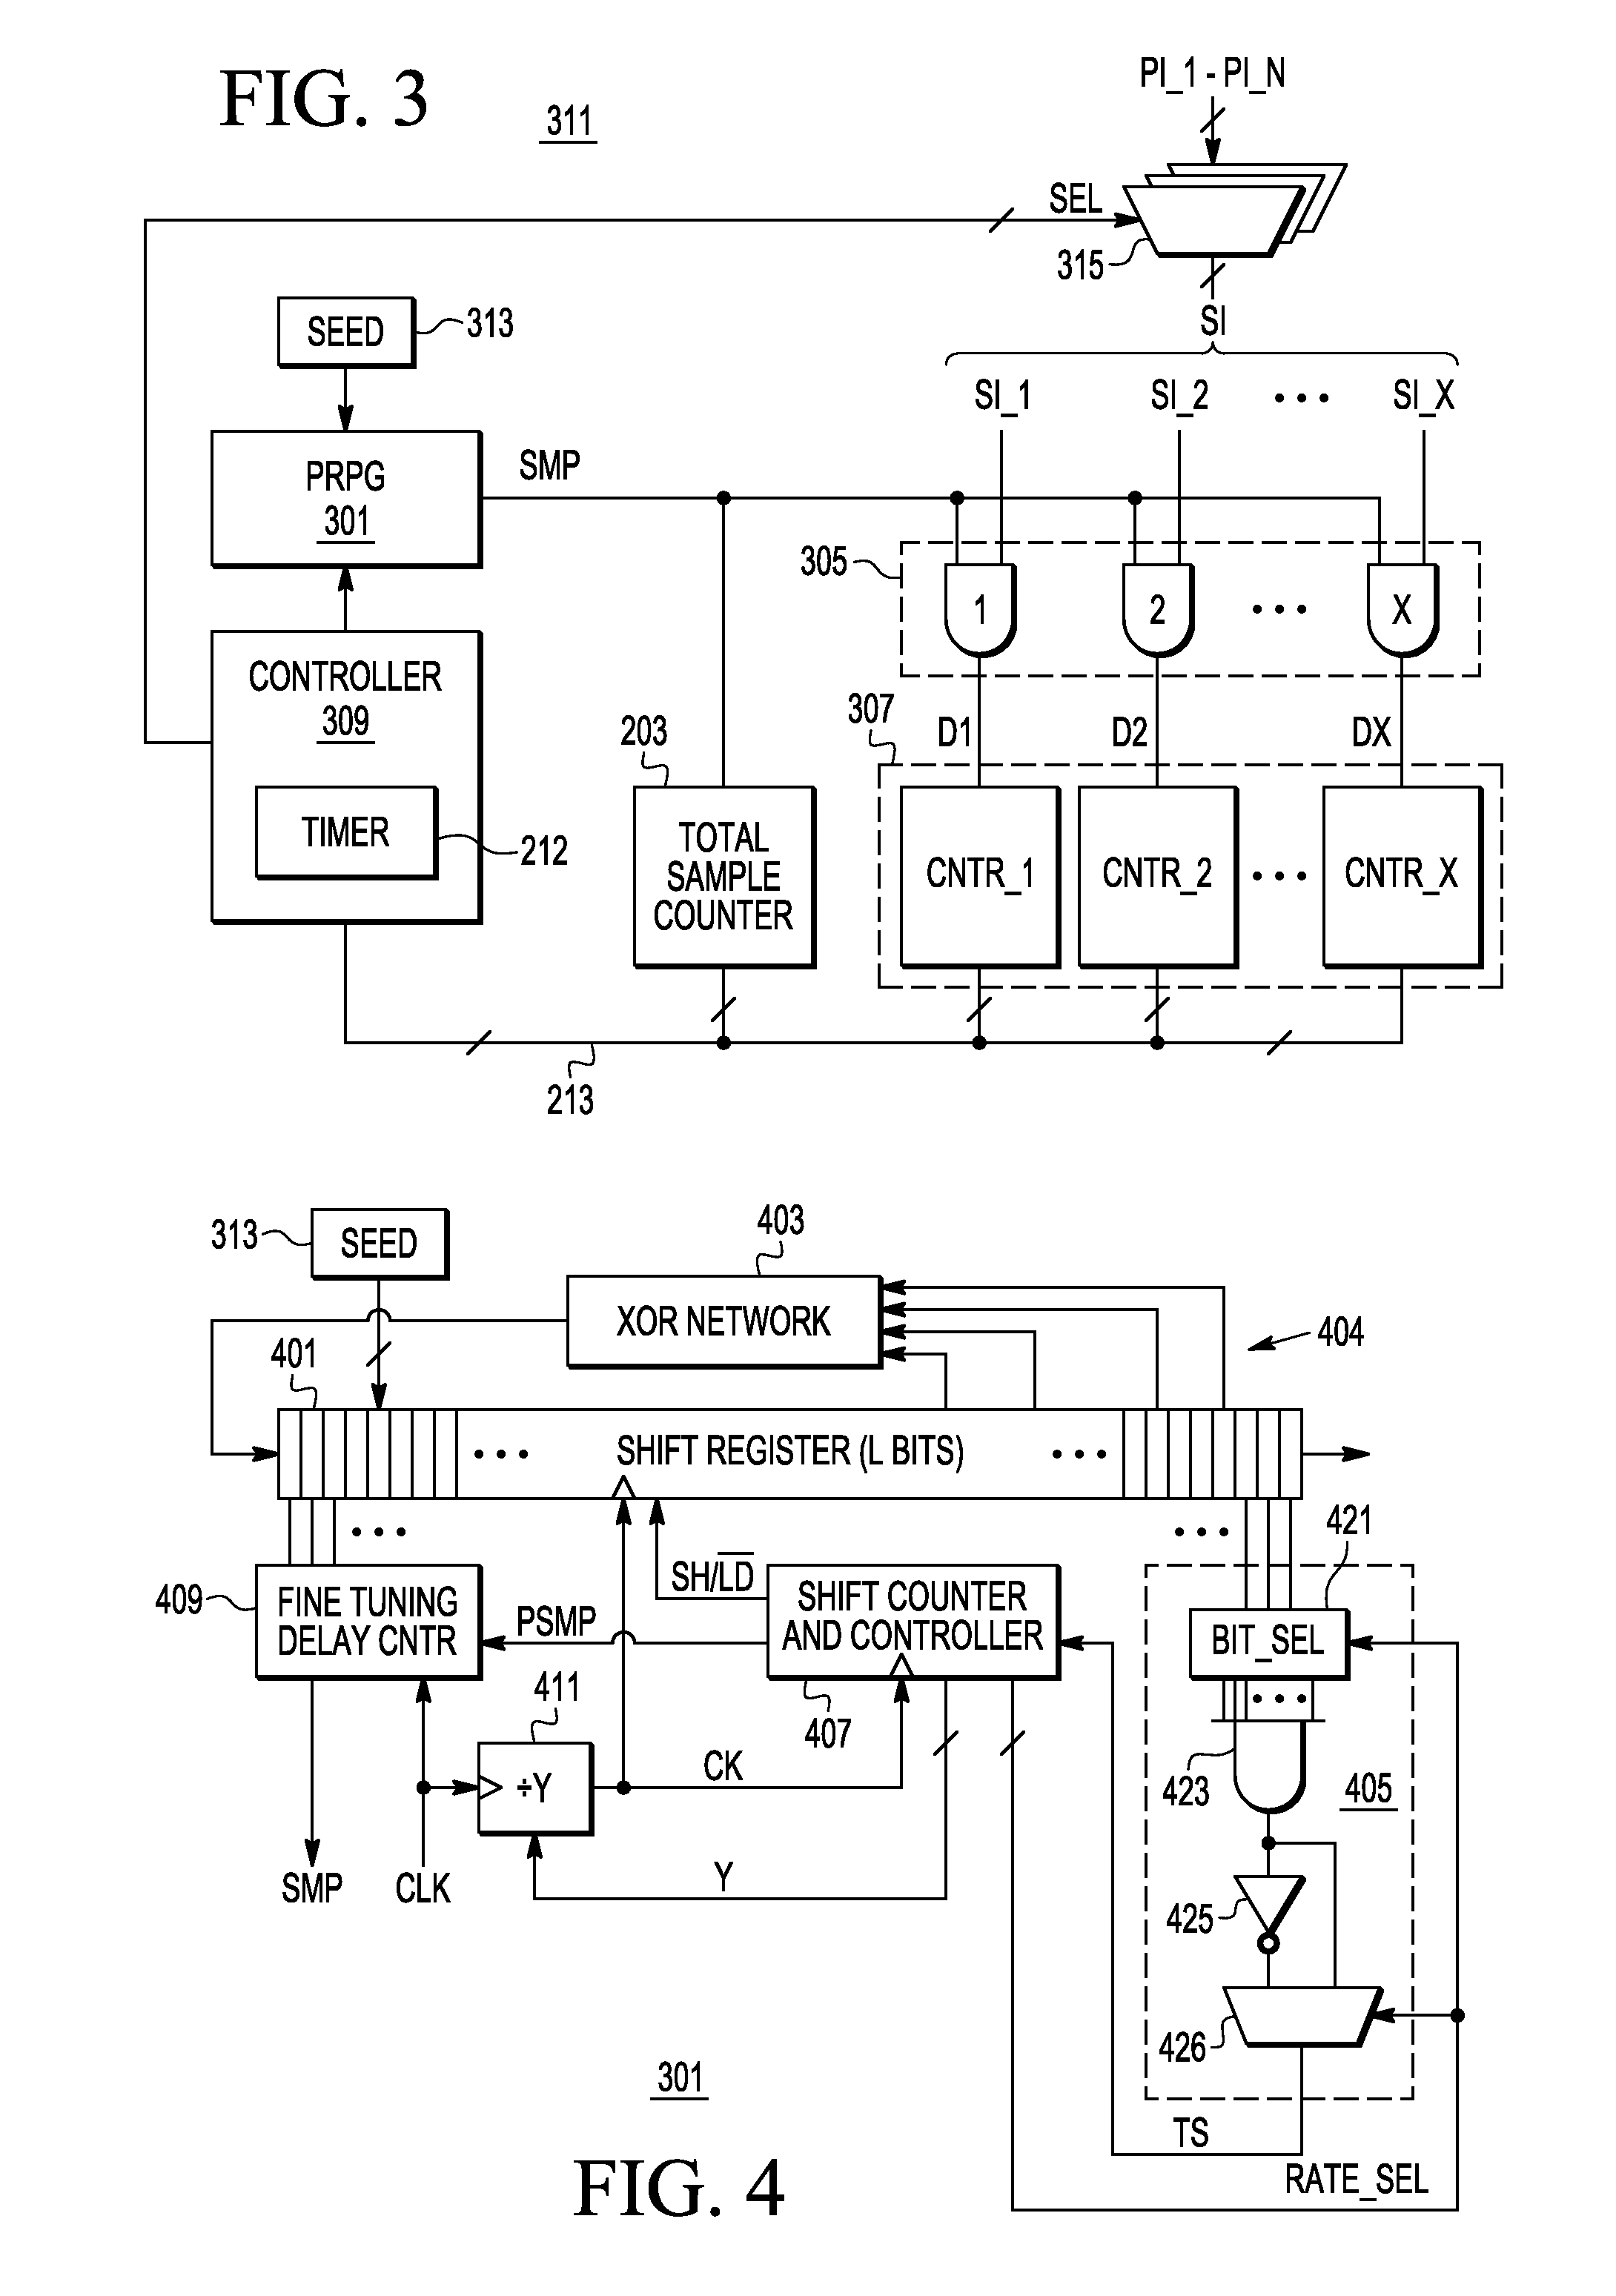
A statistical power indication monitor including a random pattern generator that generates random sample assertions of a sample signal, a total counter that counts a total number of the random sample assertions within a sample time interval, detect logic that provides a detection signal for each power indication signal that is asserted coincident with the sample signal, and counter logic that counts a number of assertions of each detection signal during the sample time interval. The assertion count of each power indication signal divided by the total count provides a statistical indication of power consumption of a corresponding system. A user may use the statistical monitoring information to adjust system or application operation. The random pattern generator may be a pseudo-random pattern generator including a linear feedback shift register and may have programmable seed and sample rate.

Description

BACKGROUND OF THE INVENTION[0001]1. Field of the Invention[0002]The present disclosure relates generally to power monitoring, and more specifically to a statistical power indication monitor (SPIM) that statistically monitors power indication signals that affect power consumption.[0003]2. Description of the Related Art[0004]Low power operation is a strong market differentiator for electronic applications, especially those that are battery-powered. Many applications are therefore designed to meet a predetermined power budget based on market factors, such as weight, size and cost, among other possible factors. After fabrication, an application is usually tested to determine whether it meets the predetermined or estimated power budget criterion. Many applications, however, even with the most careful design of task structure and scheduling, initially exceed the target power budget. Although there are well-known means of measuring overall power consumption, it is often difficult to identi...

Claims


Application Information

Patent Timeline
IPC IPC(8): G06F11/30
CPCG06F11/3062G06F11/3003G06F11/3096G06F11/36G06F2201/865G06F2201/88
Inventor MORRISON, GARY R.GAY, JAMES G.
Owner NXP USA INC
Learn More