System and method for visually building a market simulation

a market simulation and visual building technology, applied in the field of market simulators or optimizers, can solve the problems of cumbersome entry and manipulation of such data, inability to aggregate multiple survey results together, and high cost and time consumption

Inactive Publication Date: 2015-10-22
PRICE F X AG
View PDF9 Cites 2 Cited by
  • Summary
  • Abstract
  • Description
  • Claims
  • Application Information

AI Technical Summary

Benefits of technology

[0012]The market simulator / optimizer of the present invention combines partworth valuation techniques of Conjoint analysis with Nash equilibrium profit-maximization methodologies for sophisticated statistical treatment of a virtual available market comprising a multiplicity of virtual customers. An easy-to-use graphical user interface allows a user to arrange various market component icons to model various market characteristics. Associated with the market component icons are various distributions, including benefit distributions containing values indicative of respective benefits to the multiplicity of virtual customers, and cost distributions containing values indicative of respective costs associated with providing the respective benefits to the multiplicity of virtual customers.
[0027]In accordance with another embodiment of the present invention, a market simulator is capable of solving for an optimal price at which a product should be sold. In such a market simulator, competitive interactions among market participants may be iteratively modeled by a profit maximization engine. Furthermore, a first partworth distribution having a normal distribution may be obtained. Moreover, a degree of correlation between product features may be used to generate a second partworth distribution from the first partworth distribution.

Problems solved by technology

Consumer surveys can reveal more information about the likes and dislikes of individual consumers (this information typically being lost in market reports, which tend to aggregate those results).
Such consumer surveys are typically conducted by professional market researchers and are often expensive and time-consuming.
Furthermore, as such studies can generate an enormous amount of data, entry and manipulation of such data can be cumbersome.
In addition, where multiple surveys are performed, it is not generally possible to aggregate multiple survey results together.
This has been a source of frustration for business managers, because survey results often fail to progress beyond elemental market insights.
Moreover, even where additional Conjoint studies are conducted to address new features or products, for example, there is generally no provision for combining such disparate data into a single market model, since the data from separately conducted studies is generally mutually incompatible using conventional methods, and it is thus not clear how such disparate data might be seamlessly combined into a single synthetic model of the market.
However, very few tools exist that are capable of satisfactorily aggregating an organization's institutional knowledge.
Hence, such institutional knowledge is rarely taken full advantage of when making business decisions.
There is likewise generally no ability in the conventional art that would allow the knowledge and intuition of experienced marketing professionals to be reflected in or conveniently combined with such research data.
Such tools moreover generally give no consideration to the continuous steady improvement of the existing set of features within a product.
Such tools likewise generally give no consideration to modeling continuous market trends impacting some or all of the products in the market at a more macroeconomic level.
Such conventional tools offer no mechanism to combine the simulation of these continuous trends with the optimal selection of discrete feature into products.
In addition, traditional Conjoint analysis tools offer no mechanism to consider geographic store location.
Such conventional simulations therefore fail to find a profit-maximizing point at a price other than that specifically surveyed.
However, such conventional techniques have the disadvantage that they merely introduce various “fudge factors” to achieve observed market behavior.
Moreover, currently available Conjoint- and Nash-based software is generally difficult to use, and being less than intuitive with respect to data entry and presentation of results, does not have the transparency and convenience requisite for credible communication among corporate decision makers.
Thus, a heretofore unaddressed need exists in the industry to address the aforementioned deficiencies and inadequacies.

Method used


Image

  • System and method for visually building a market simulation
  • System and method for visually building a market simulation
  • System and method for visually building a market simulation

Examples


Embodiment Construction

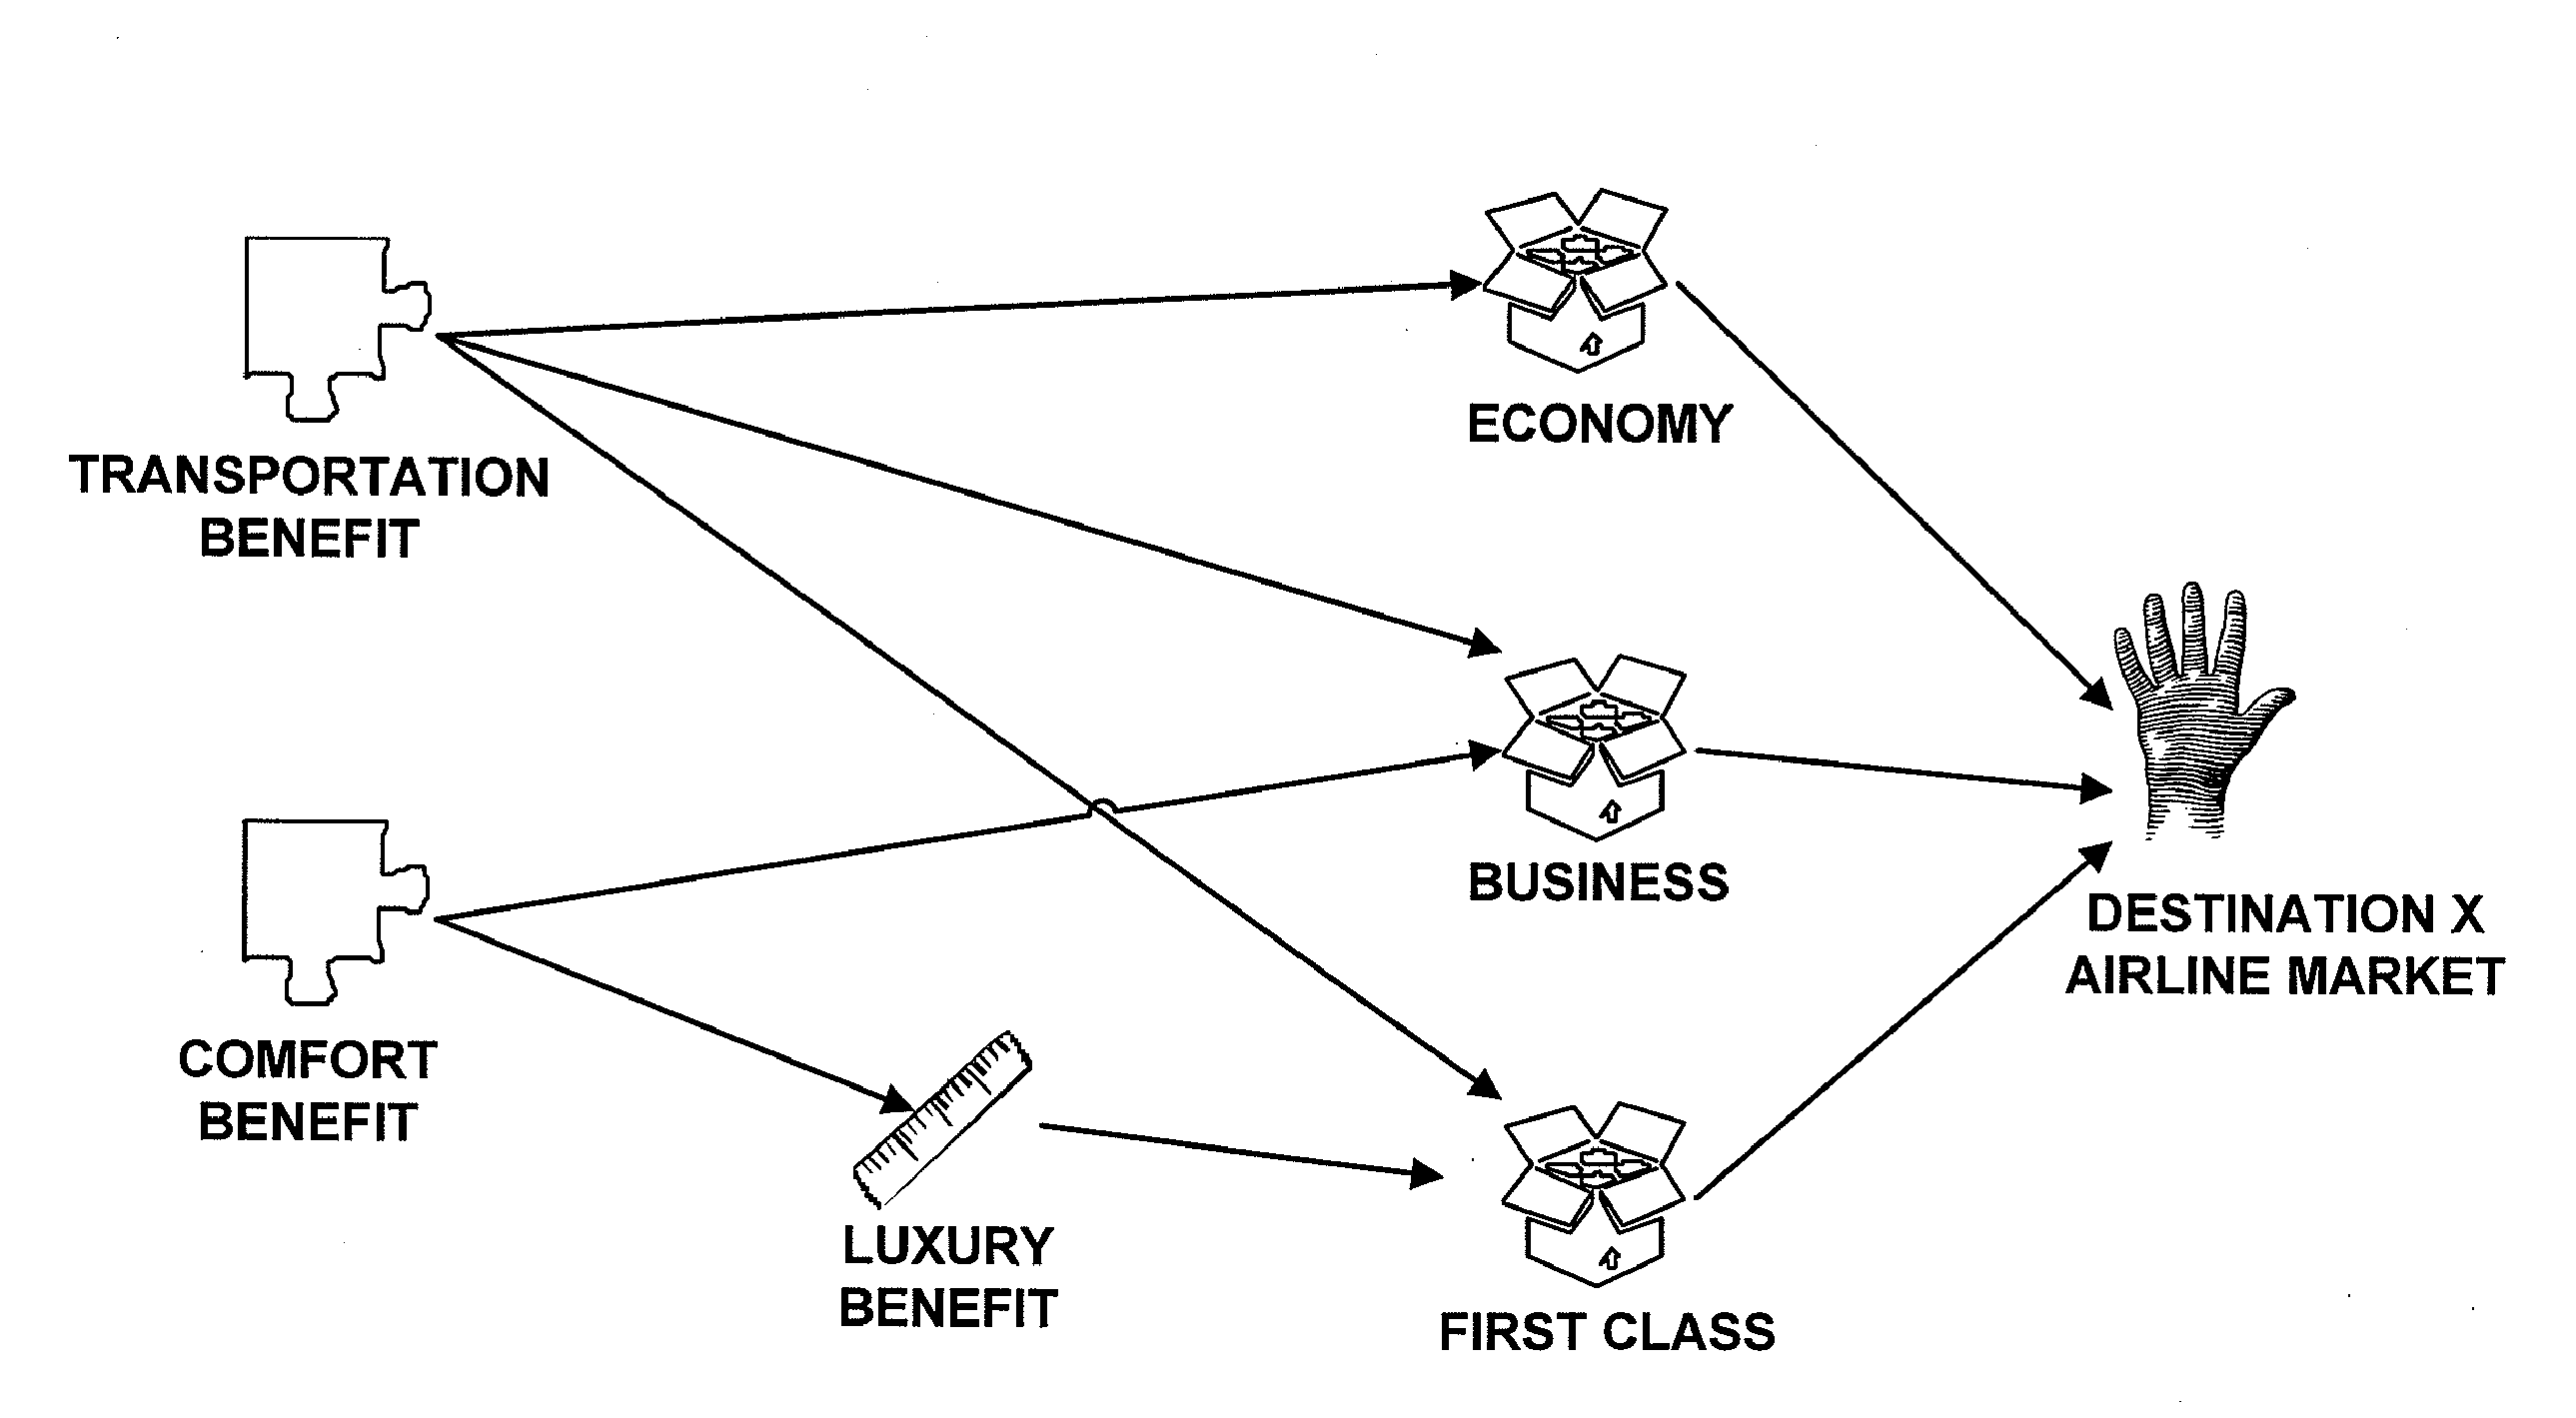
[0043]The market simulator / optimizer of the present invention combines partworth valuation techniques of Conjoint analysis with Nash equilibrium profit-maximization methodologies for sophisticated statistical treatment of a virtual available market comprising a multiplicity of virtual customers. An easy-to-use graphical user interface allows a user to arrange icons to model various market components.

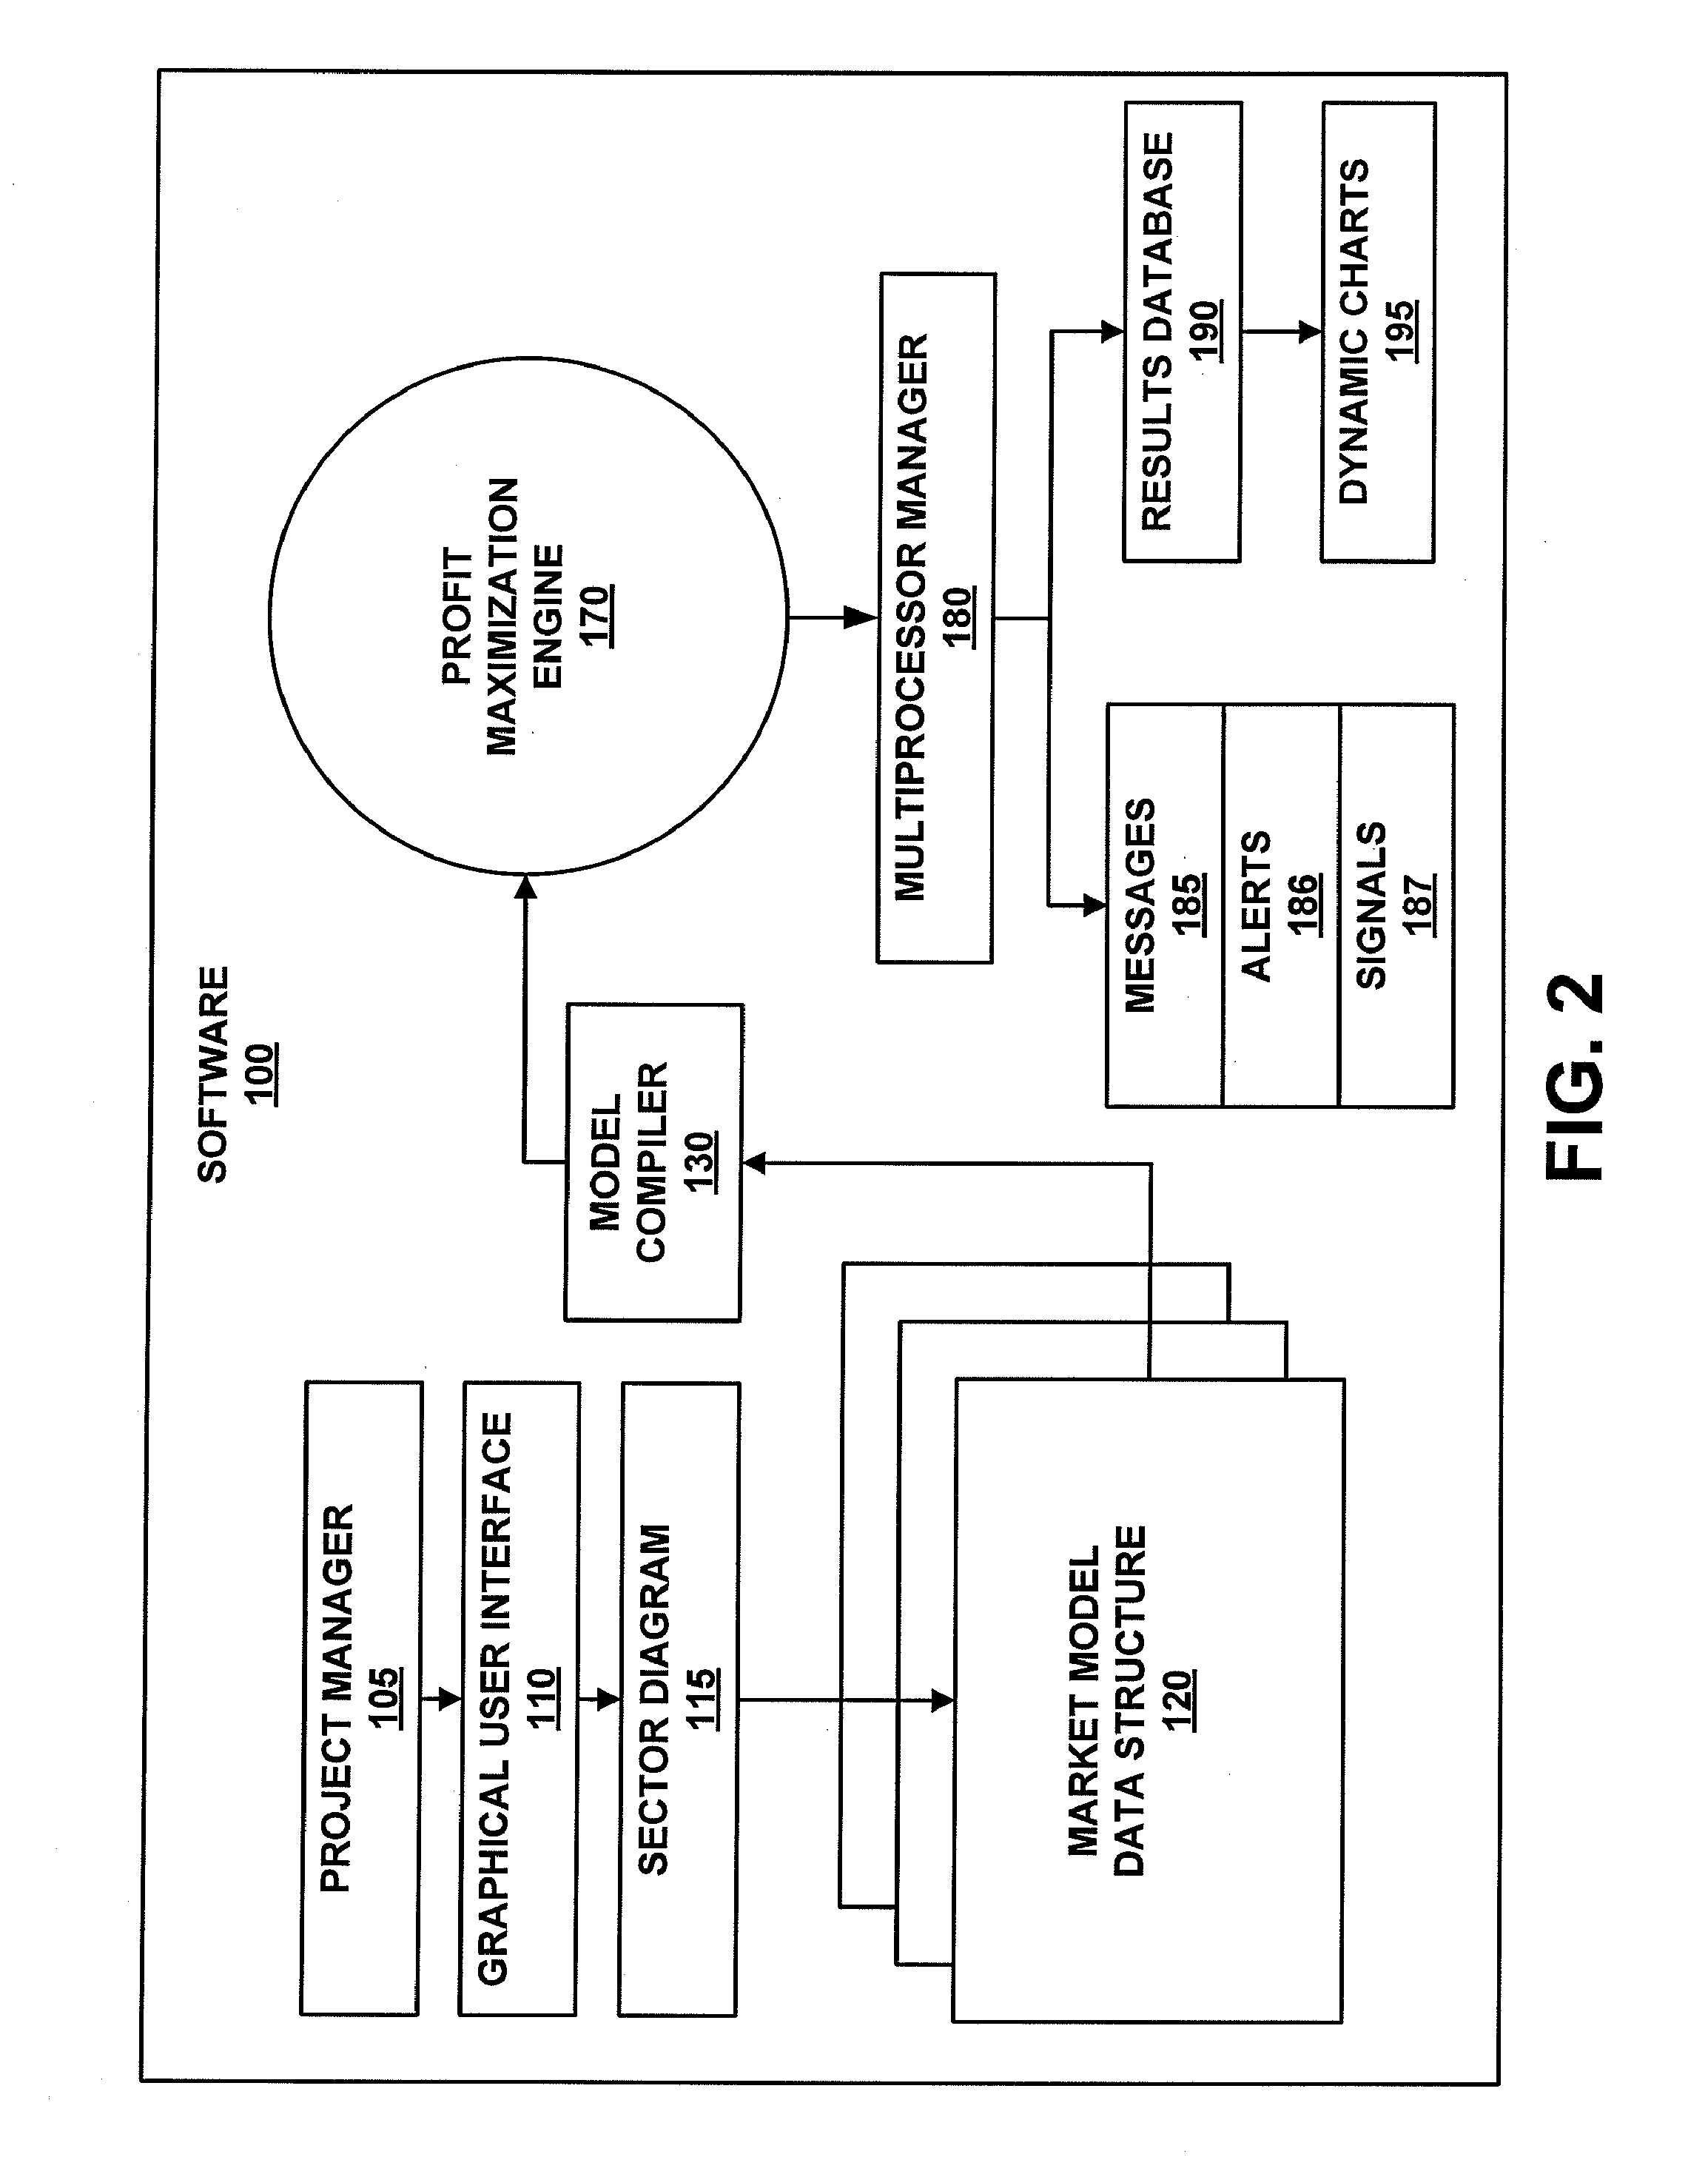
[0044]The present system and method is a graphical tool used to create and run market model simulations. The present system and method may be provided by a Web-based application. The following description assumes that the present system and method is provided by a Web-based application. It should be noted that the system and method may also be provided in an environment that is not Web-based.

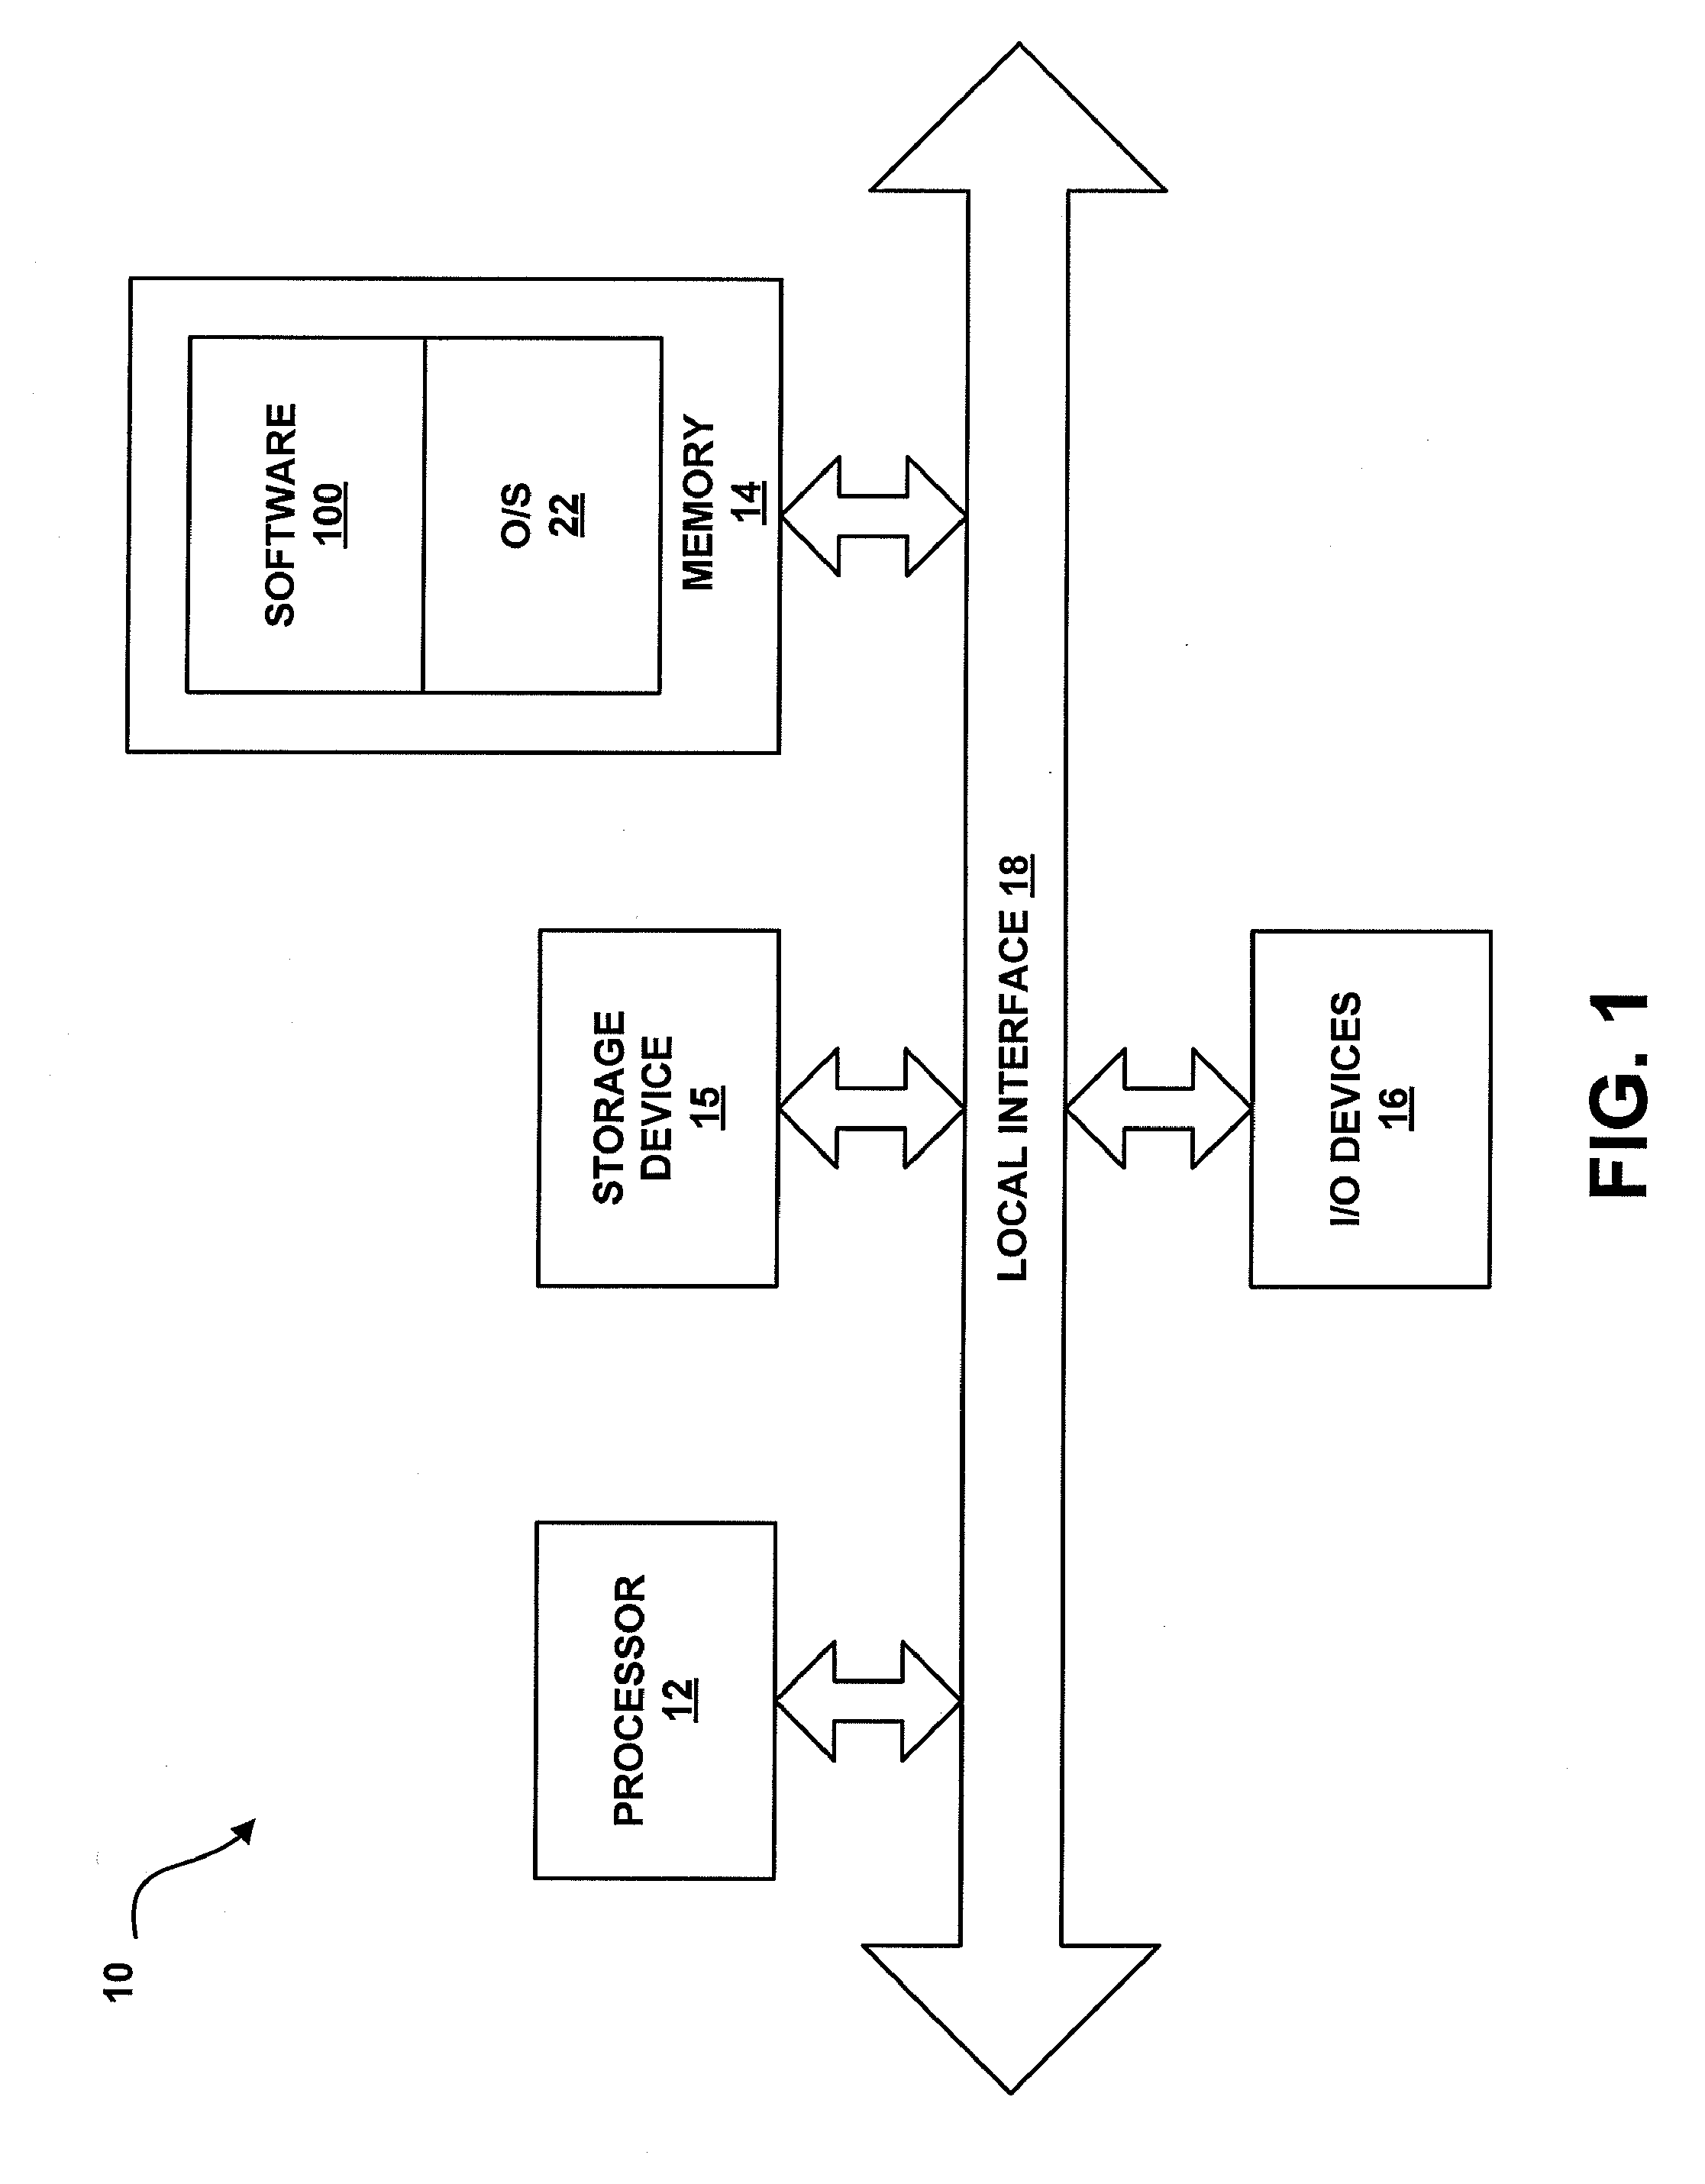
[0045]The market simulation / optimization system of the invention can be implemented in software (e.g., firmware), hardware, or a combination thereof. In the currently contemplated best mode, the mark...


PUM


Abstract

The market simulator / optimizer of the present invention combines partworth valuation techniques of Conjoint analysis with Nash equilibrium profit-maximization methodologies for sophisticated statistical treatment of a virtual available market comprising a multiplicity of virtual customers. An easy-to-use graphical user interface allows a user to arrange various market component icons to model various market characteristics. Associated with the market component icons are various distributions, including a benefit distribution containing values indicative of respective benefits to the multiplicity of virtual customer, and a cost distribution containing values indicative of respective costs associated with providing the respective benefits to the multiplicity of virtual customers.

Description

RELATED APPLICATIONS[0001]This application is a continuation of and claims priority to U.S. patent application Ser. No. 12 / 391,408, entitled “SYSTEM AND METHOD FOR PROVIDING MARKET SIMULATION / OPTIMIZATION” filed Feb. 24, 2009, which is currently pending, the contents of which is herein incorporated by reference in its entirety.FIELD OF THE INVENTION[0002]The present invention is generally related to a market simulator or optimizer, and more particularly is related to a system and method for market simulation or optimization in which generation of virtual partworth data in combination with a simple yet sophisticated graphical user interface permits increased versatility and flexibility in modeling market behavior.BACKGROUND OF THE INVENTION[0003]Information available to marketing decision makers to assist them in making marketing decisions can, for example, come in the form of market reports, consumer surveys, and institutional knowledge. Market reports are generally available for pu...

Claims


Application Information

Patent Timeline
Patent Type & Authority Applications(United States)
IPC IPC(8): G06Q30/02
CPCG06Q30/0206G06Q10/04G06Q30/0201
Inventor HARTNELL, EDWIN GEOFFREY
Owner PRICE F X AG
Why Eureka
Try Eureka