Enhanced Visualization of Geologic Features in 3D Seismic Survey Data Using High Definition Frequency Decomposition (HDFD)

Active Publication Date: 2016-05-26
FOSTER FINDLAY ASSOCS
View PDF1 Cites 12 Cited by
  • Summary
  • Abstract
  • Description
  • Claims
  • Application Information

AI Technical Summary

Benefits of technology

[0071]This provides the advantage that wavelets are forced to be fitted/matched to the spectral extremes of the seismic trace, which would normally be overlooked, therefore further imp

Problems solved by technology
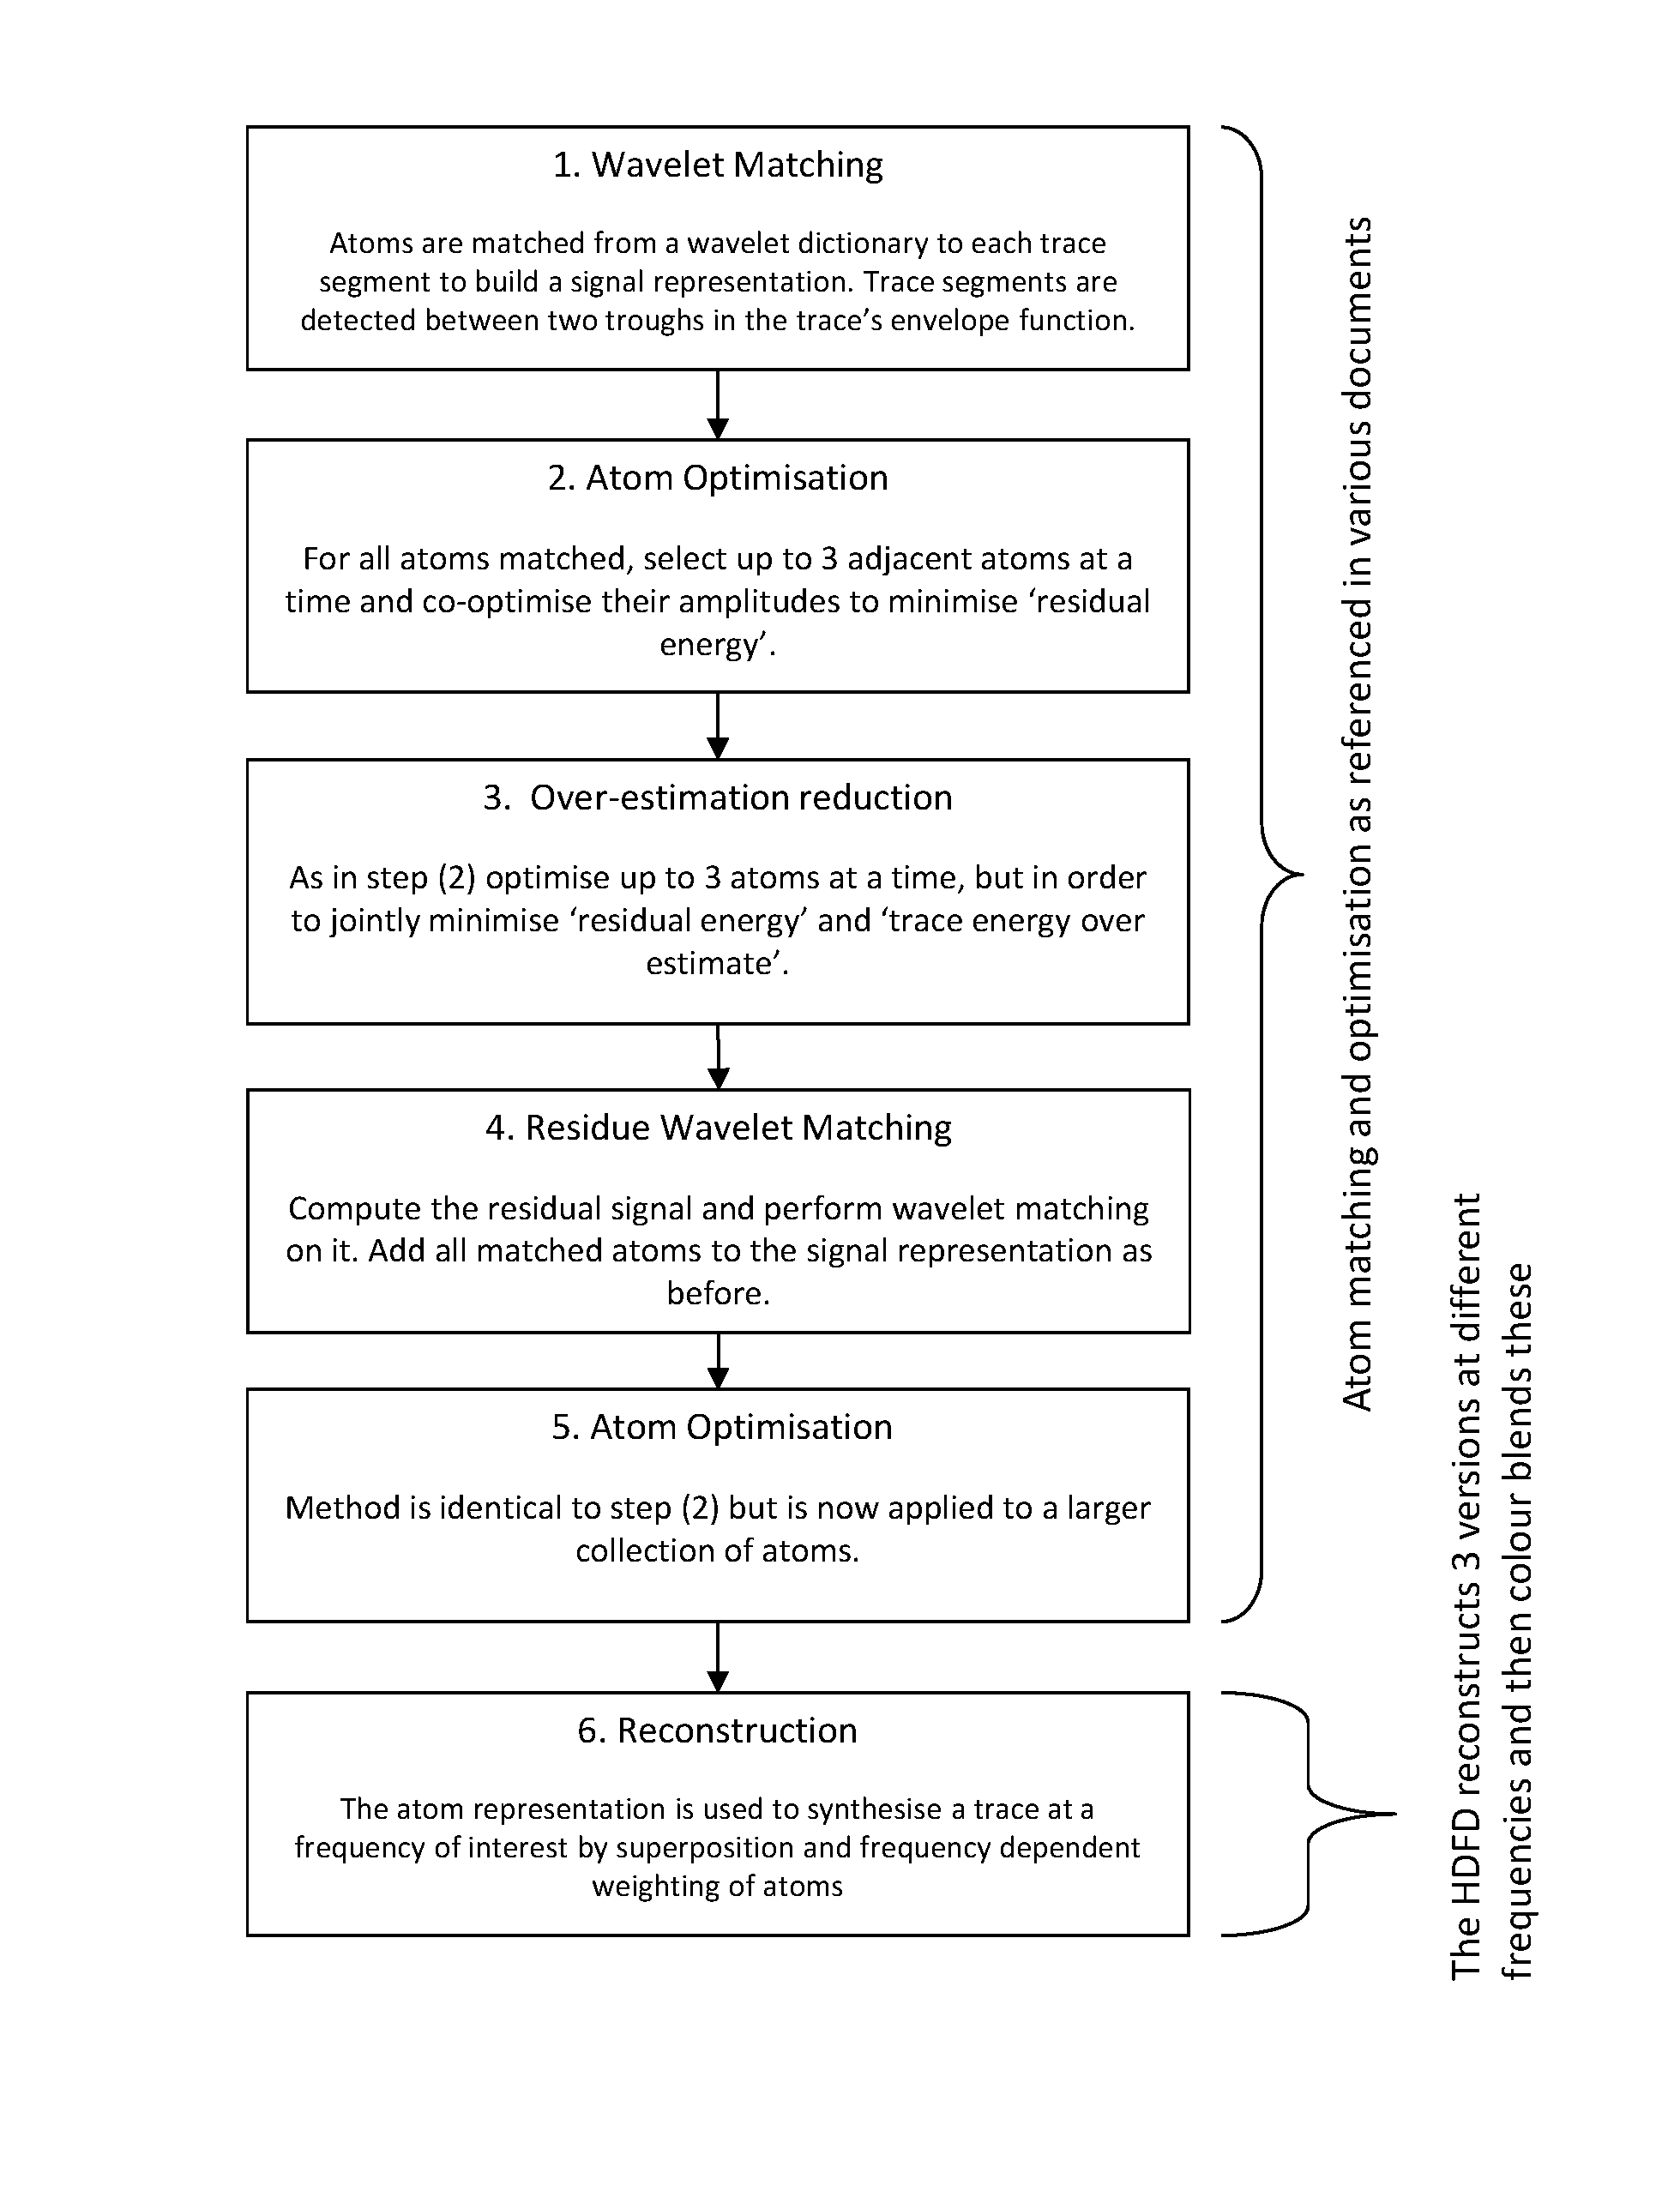
Furthermore, the generated analytical signal model over the whole

Method used


Image

  • Enhanced Visualization of Geologic Features in 3D Seismic Survey Data Using High Definition Frequency Decomposition (HDFD)
  • Enhanced Visualization of Geologic Features in 3D Seismic Survey Data Using High Definition Frequency Decomposition (HDFD)
  • Enhanced Visualization of Geologic Features in 3D Seismic Survey Data Using High Definition Frequency Decomposition (HDFD)

Examples


Embodiment Construction

)

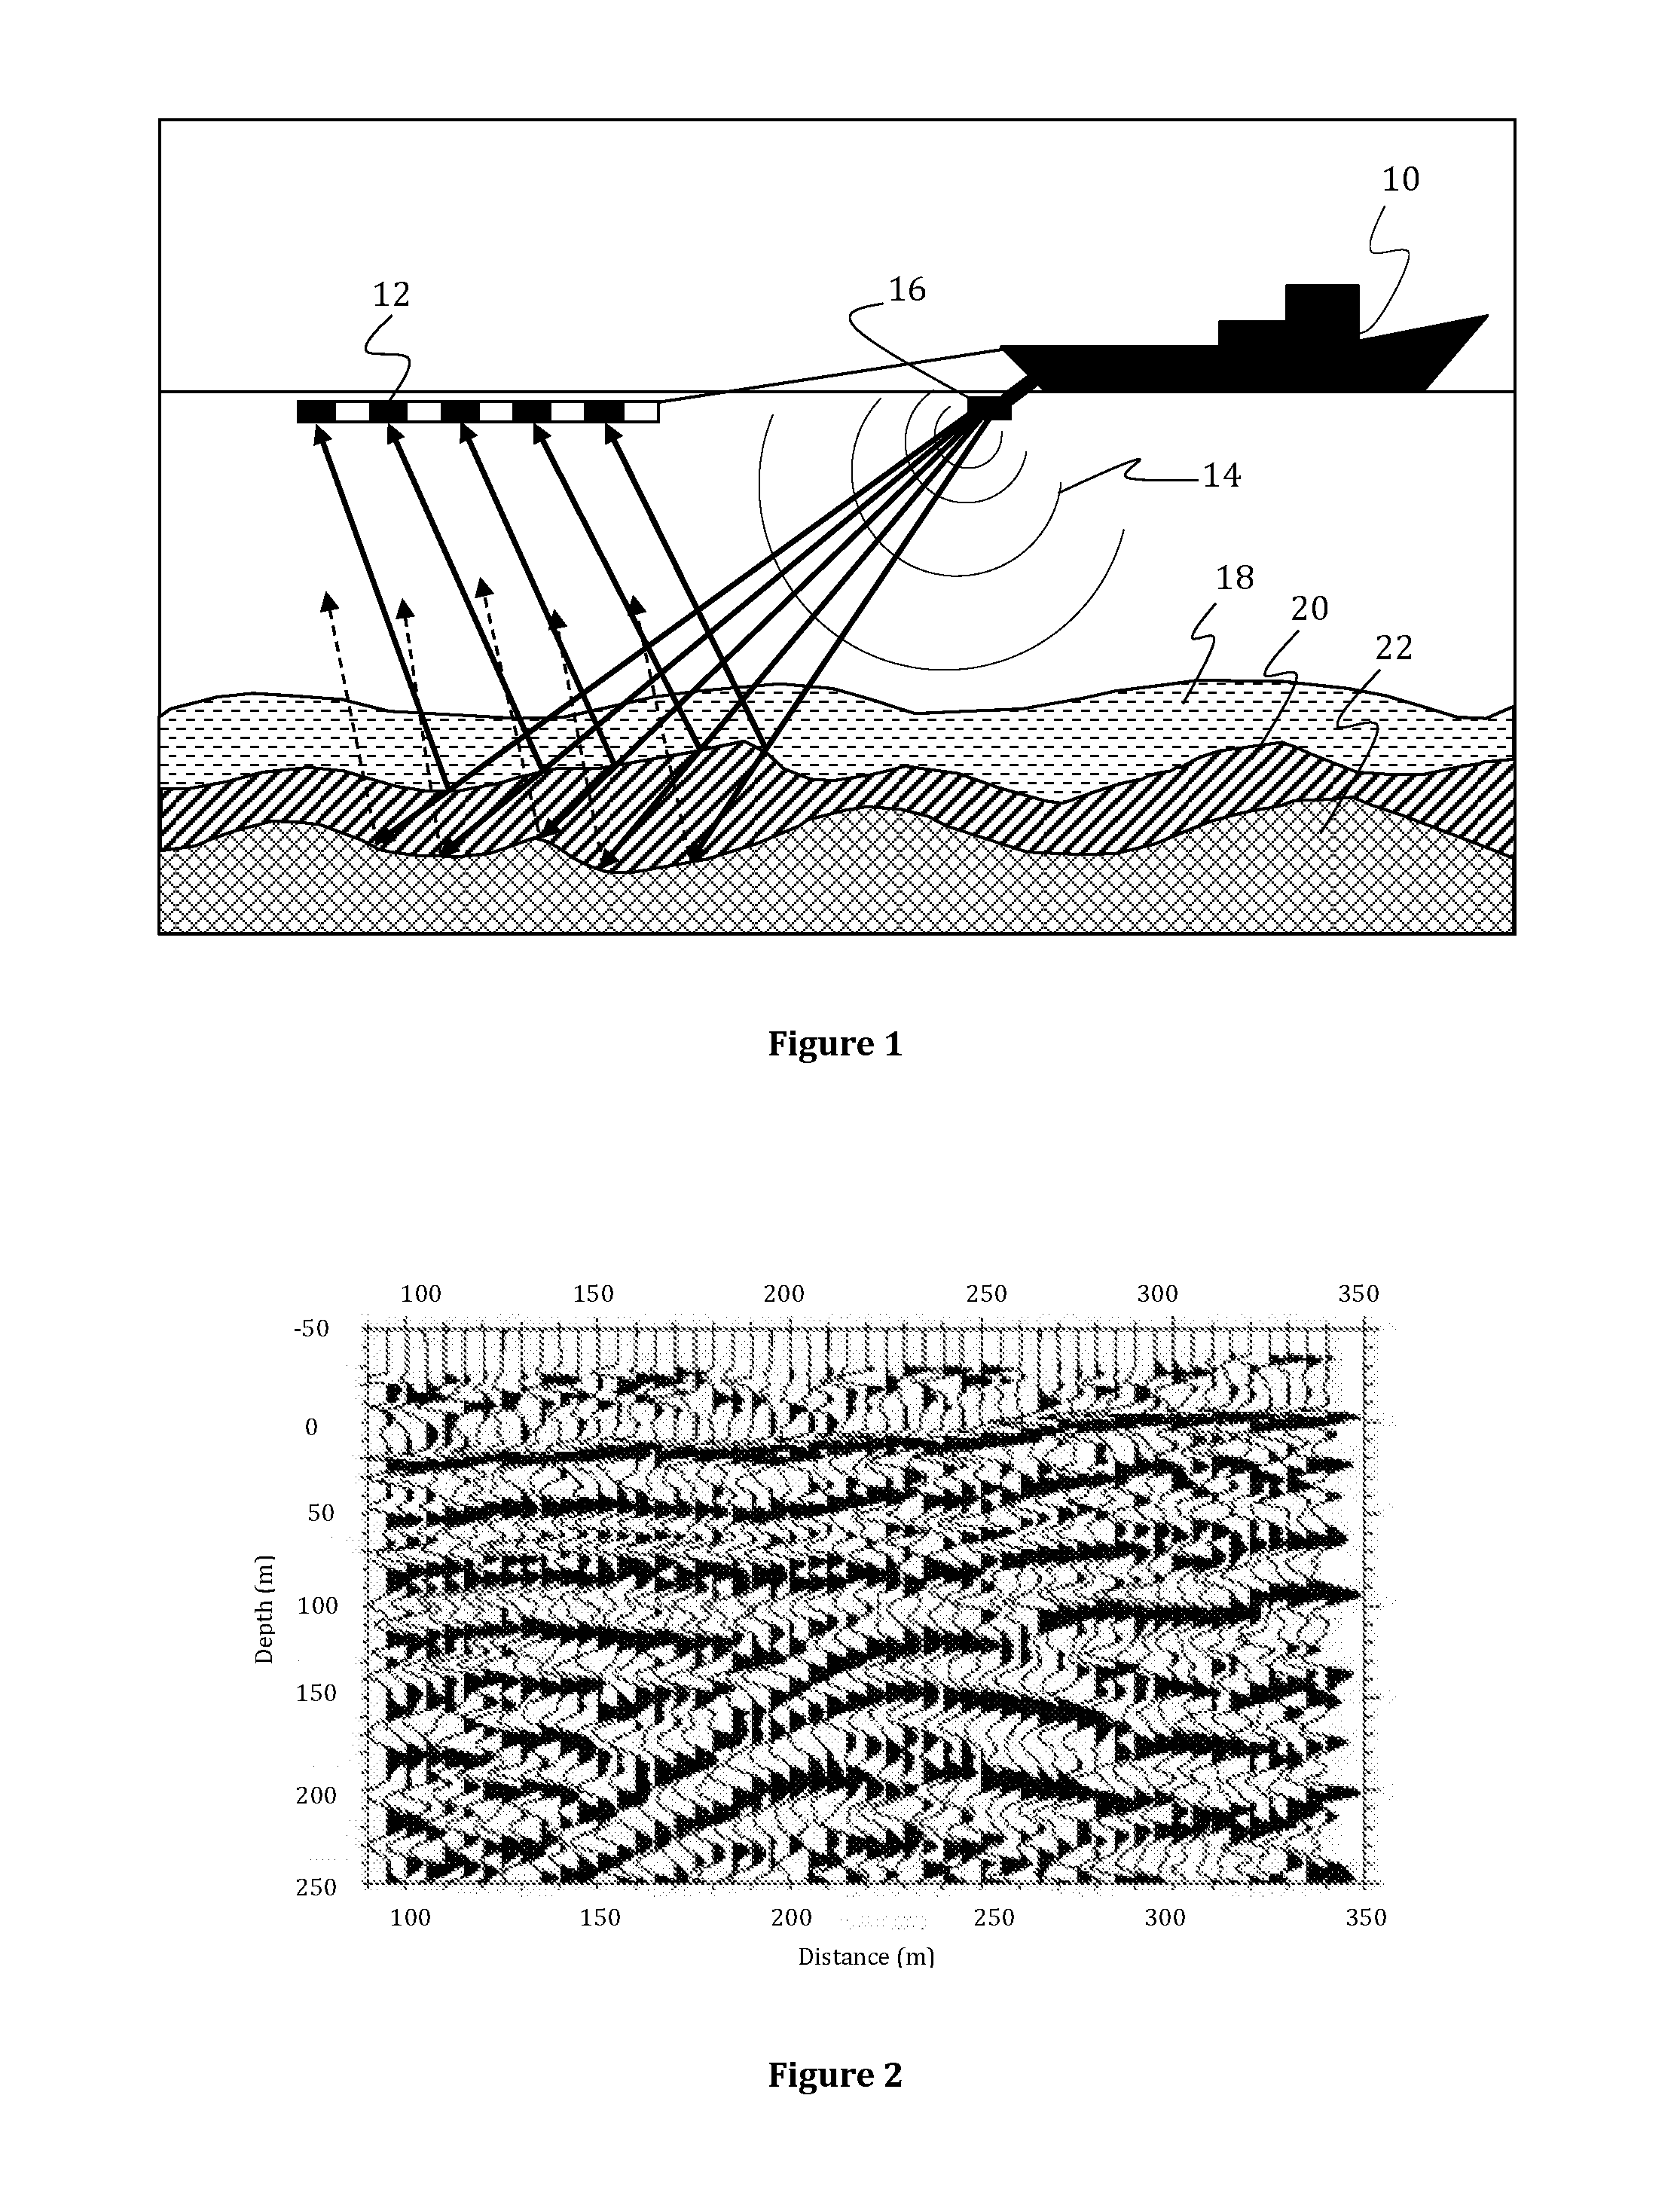
[0107]The exemplary embodiments of this invention will be described in relation to interpretation of 3D seismic data. However, it should be appreciated that, in general, the system and method of this invention will work equally well for any other type of 3D data from any environment.

[0108]For purposes of explanation, it should be appreciated that the terms ‘determine’, ‘calculate’ and ‘compute’, and variations thereof, as used herein are used interchangeably and include any type of methodology, process, mathematical operation or technique. The terms ‘generating’ and ‘adapting’ are also used interchangeably describing any type of computer modelling technique for visual representation of a subterranean environment from geological survey data, such as 3D seismic data. In addition, the terms ‘vertical’ and ‘horizontal’ refer to the angular orientation with respect to the surface of the earth, i.e. a seismic data volume is orientated such that ‘vertical’ means substantially perpendicula...


PUM


Abstract

A method is presented for visually enhancing at least one geological feature in 3D seismic survey data, comprising the steps of:
    • (a) selecting at least one first seismic trace from a 3D seismic survey data set;
    • (b) subdividing said at least one first seismic trace into a plurality of identified characteristic segments;
    • (c) generating at least one first analytical model function for each of said plurality of identified characteristic segments, utilizing at least one adapted wavelet from an existing dictionary;
    • (d) determining a matching characteristic between said at least one first seismic trace and said at least one first analytical model function;
    • (e) optimising said at least one first analytical model function with respect to said matching characteristic;
    • (f) repeating steps (d) and (e) until a predetermined condition is met, and
    • (g) generating a model dataset from said optimised at least one first analytical model function for at least part of said at least one first seismic trace for visual representation.

Description

[0001]The present invention relates generally to the field of oil and gas exploration, and in particular to the field of computer aided exploration for hydrocarbons using geophysical data, such as for example seismic data, of the earth. Even more particular, the present invention relates to the analysis of seismic trace data and its enhanced visual representation through a method of high definition frequency decomposition of the seismic traces.INTRODUCTION[0002]In the oil and gas industry, geological data surveys such as, for example, seismic prospecting and other similar techniques are commonly used to aid in the search for and evaluation of subterranean hydrocarbon deposits. As an example, prospecting operations include three basic stages (i) data acquisition, (ii) data processing and (iii) data interpretation. The success of the prospecting operation generally depends on satisfactory completion of (i), (ii) and (iii). For example, a seismic source is used to generate an acoustic ...

Claims


Application Information

Patent Timeline
IPC IPC(8): G01V1/30
CPCG01V2210/23G01V1/302G01V2210/74G01V1/30G01V1/345G01V2210/24G01V2210/30
Inventor PURVES, STEPHEN JAMESECKERSLEY, ADAM JOHNMCARDLE, NICHOLAS
Owner FOSTER FINDLAY ASSOCS
Why Eureka
Try Eureka