Fault monitoring by assessing spatial distribution of queries in a utility supply network

a utility supply network and spatial distribution technology, applied in the field of fault monitoring by assessing spatial distribution of queries, can solve problems such as failures of switching and other more centralised functions, failures in utility supply networks, and loss of operation of large sections of networks, so as to facilitate the remediation of faults and enhance the delivery of utilities

Active Publication Date: 2017-08-10
SPATIALBUZZ
View PDF12 Cites 12 Cited by
  • Summary
  • Abstract
  • Description
  • Claims
  • Application Information

AI Technical Summary

Benefits of technology

[0007]According to one aspect, the invention provides a network monitoring tool for fault monitoring in a utility supply network. The tool comprises an input for receiving a plurality of queries about the performance of the network—each query being a query about the performance of the network in a respective location—and a data processor. The data processor is configured to allocate to a group those queries that exhibit a predetermined spatial relationship with respect to one another. The locations of the queries in the group define a zone. The data processor is configured to count the queries in the group and determine whether the number of queries in the group ex

Problems solved by technology

Faults occur in utility supply networks, as in all other complex technical systems.
In the context of a cellular, or mobile, network, such faults include the failure of hardware components in the base-stations of the mobile network, failures in other systems which are connected to multiple base-stations (for example the radio network controller—RNC—in a 3G system and which then result in the loss of operation of large sections of the network—e.g. all node B

Method used


Image

  • Fault monitoring by assessing spatial distribution of queries in a utility supply network
  • Fault monitoring by assessing spatial distribution of queries in a utility supply network
  • Fault monitoring by assessing spatial distribution of queries in a utility supply network

Examples


Embodiment Construction

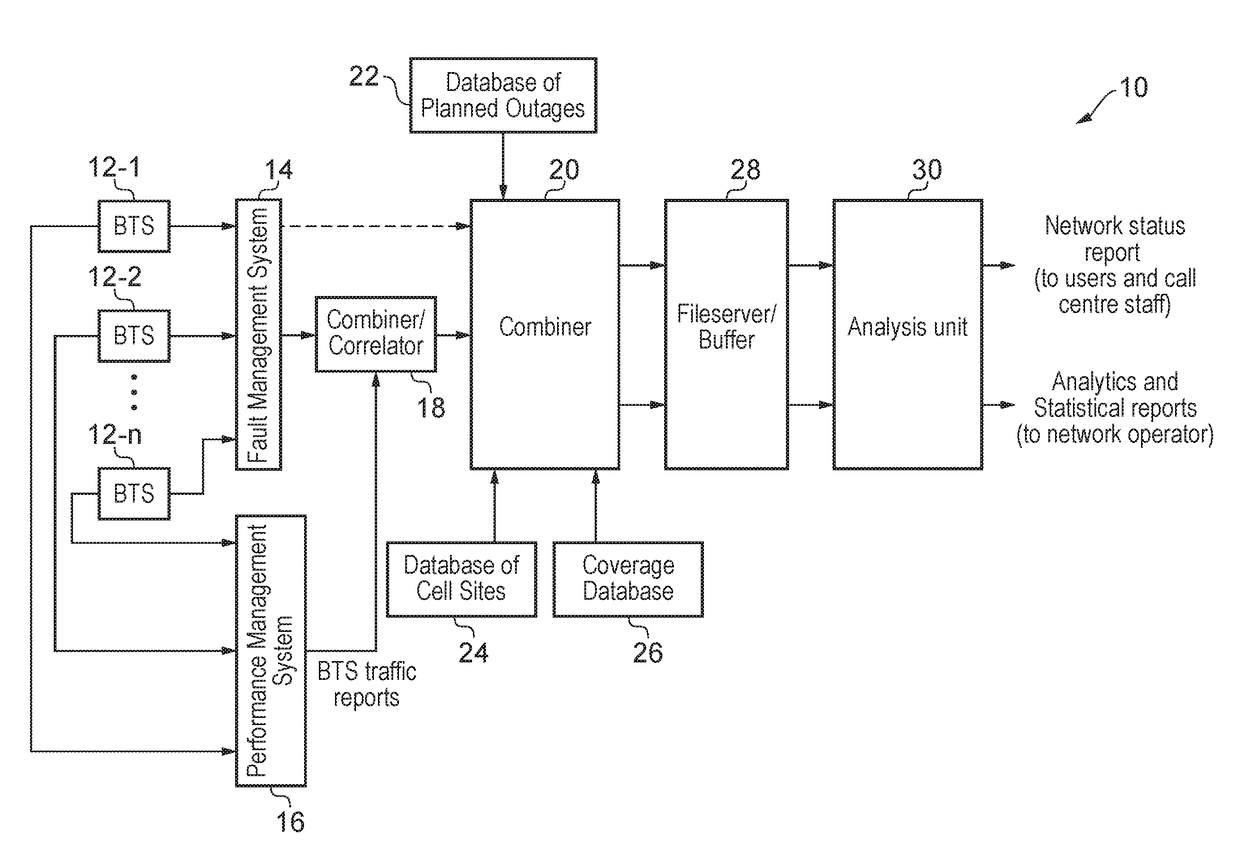
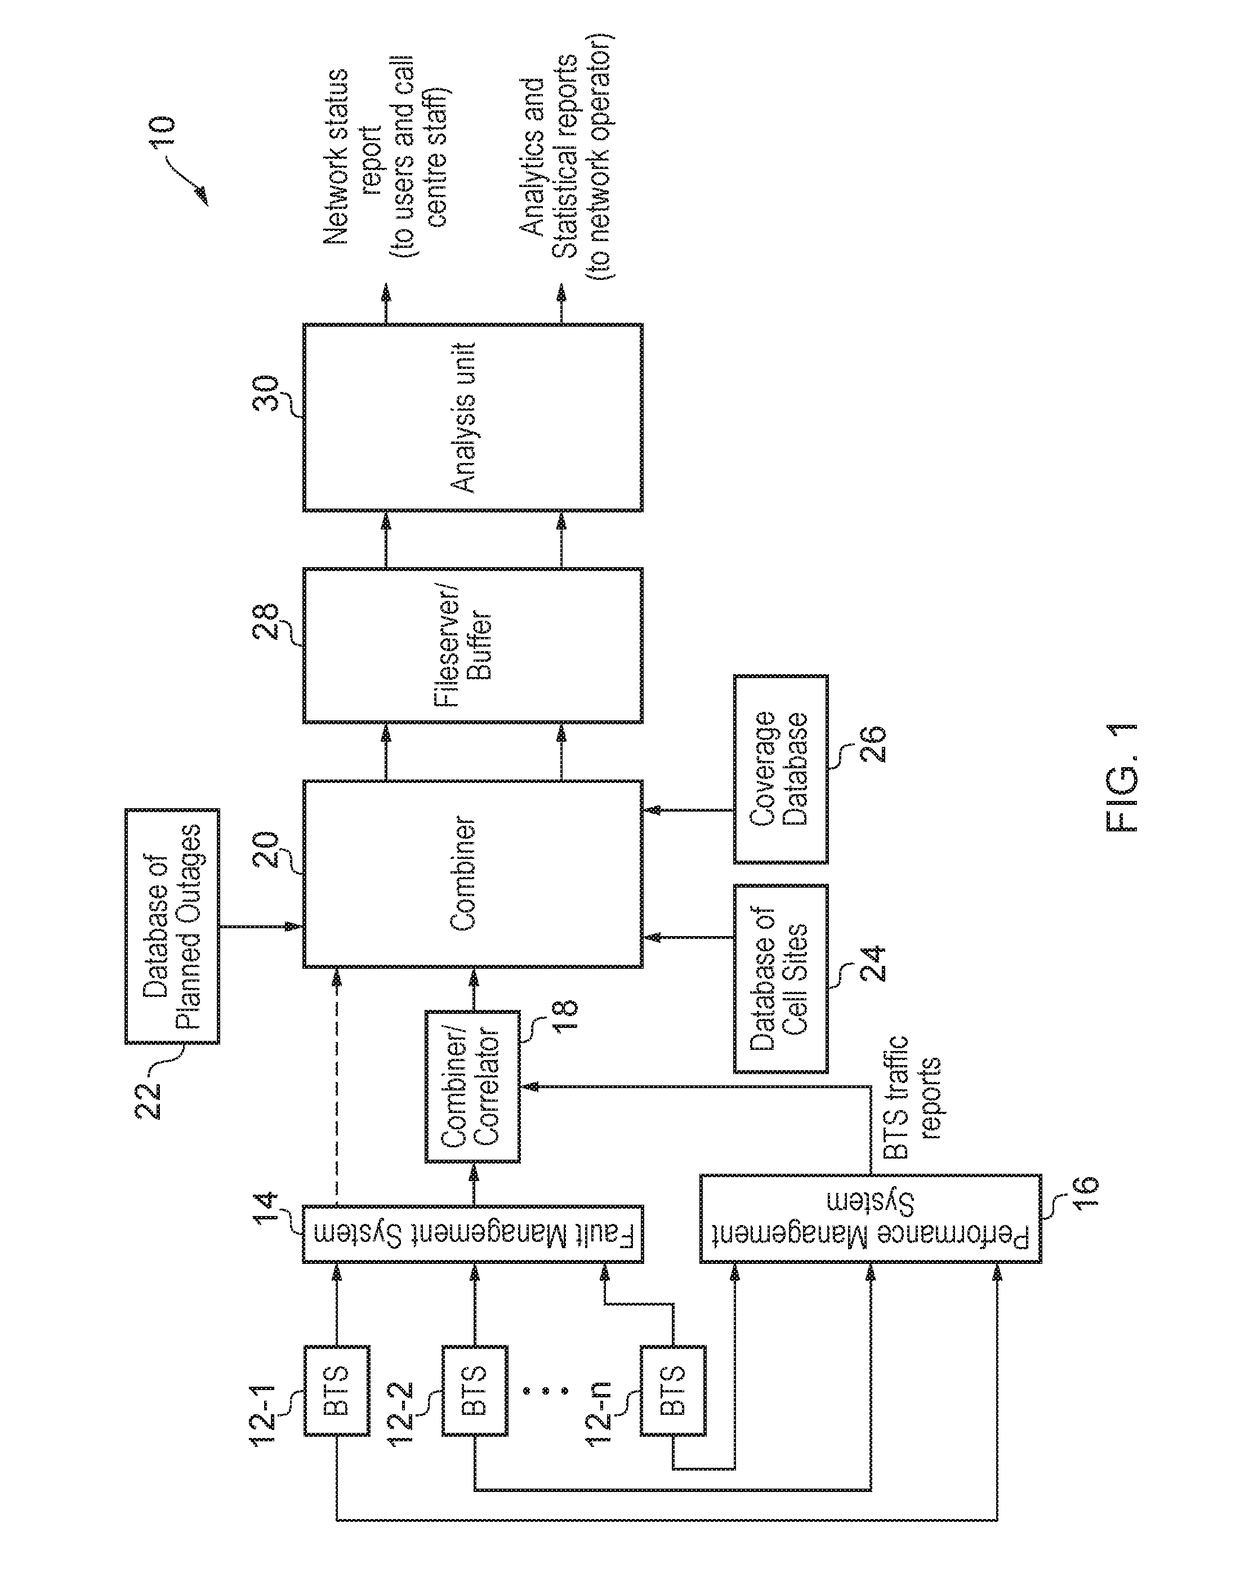
[0032]An outline of the architecture of a network service reporting system (NSRS) 10 for a mobile network is shown in FIG. 1. The NSRS 10 includes a fault management system 14, a performance management system 16, a combiner / correlator 18, a main combiner 20, a database of planned outages 22, a database of cell sites, 24, a coverage database 26, a file server / buffer 28 and an analysis unit 30. The NSRS 10 takes input from n base stations 12-1, 12-2, . . . 12-n of the mobile network that is being monitored. The n base stations may be all of the base stations in the mobile network or just some subset of the base stations in the mobile network.

[0033]Each of the blocks 14-30 in the NSRS 10 could be implemented by a physically separate piece of data processing and / or data storage hardware (such as a personal computer, a server, a hard disk storage unit or the like) or some of the blocks could be implemented in a single piece of hardware (e.g. the main combiner 20 and the fileserver / buffer...


PUM


Abstract

A monitoring tool receiving a plurality of queries about the performance of a network, each query being a query about the performance of the network in a respective location. The tool groups queries that exhibit a predetermined spatial relationship with respect to one another. The locations of the queries in the group define a zone. If the number exceeds a threshold, then the zone warrants inspection and/or queries about network performance in the zone can be met with an indication that there appears to be a fault affecting the zone.
Alternatively, the tool compares a plurality of stored areas, each area corresponding to a different time period and delimited by a boundary formed around the locations to which a plurality of network performance queries, in the respective time period, relate.

Description

FIELD OF THE INVENTION[0001]The invention relates to the management of faults in a utility supply network, such as a cellular communications network. Management of faults may extend to one or more of identifying the type of fault that has arisen, identifying the location of the fault within the network and determining the expected time to repair the fault, and to signalling the results of one or more of these actions.BACKGROUND[0002]Faults occur in utility supply networks, as in all other complex technical systems. In the context of a cellular, or mobile, network, such faults include the failure of hardware components in the base-stations of the mobile network, failures in other systems which are connected to multiple base-stations (for example the radio network controller—RNC—in a 3G system and which then result in the loss of operation of large sections of the network—e.g. all node B base-stations connected to the RNC) and failures to switching and other more centralised functions...

Claims


Application Information

Patent Timeline
IPC IPC(8): H04W24/08H04W64/00H04L12/26H04W4/02H04W4/38H04W4/70
CPCH04W24/08H04L43/14H04L61/6054H04L43/16H04L61/6022H04W64/003H04M3/085H04W24/04H04L43/0817H04L41/06H04W4/38H04W4/025H04W4/70H04L2101/622H04L2101/654
Inventor BLAKE, ANDREW ROBERTSHANNON, MICHAEL ROBERT JOHN
Owner SPATIALBUZZ
Why Eureka
Try Eureka