

Compositions and methods for identification, assessment, prevention, and treatment of t-cell exhaustion using cd39 biomarkers and modulators
- Summary
- Abstract
- Description
- Claims
- Application Information
AI Technical Summary
Benefits of technology
Problems solved by technology
Method used
Image

Examples
example 1
and Methods for Examples 2-8
[0377]a. Human Subjects
[0378]Healthy human donors were recruited at the Kraft family Blood Donor Center, Dana-Farber Cancer Institute (DFCI) with written informed consent following approval by Partners Institutional Review Board. All human subjects with HCV infection were recruited at the Gastrointestinal Unit and the Department of Surgery of the Massachusetts General Hospital (Boston, Mass.) with written consent in accordance with Institutional Review Board approval from the Partners HealthCare. HCV chronics (n=27) were defined by positive anti-HCV antibody and detectable viral load. HCV resolvers (n=14) were defined by positive anti-HCV antibody but an undetectable viral load for at least 6 months. All HCV patients were treatment naive and obtained between 5.9 and 237.3 weeks post infection. HCV RNA levels were determined using the VERSANT HCV RNA 3.0 (bDNA 3.0) assay (Bayer Diagnostics).
[0379]All HIV infected cohorts were recruited after written inform...
example 8
cient Mice Exhibit Increased Immune Responses and Mortality
[0412]Moreover, CD39 deficient mice exhibit increased mortality to LCMV-Clone 13 due to exacerbated immune response in target organs. Severely increased immunopathology in different organs in CD39 knock-out animals as compared to wild-type animals following LCMV-Clone 13 infection was observed (FIGS. 13A-13D).
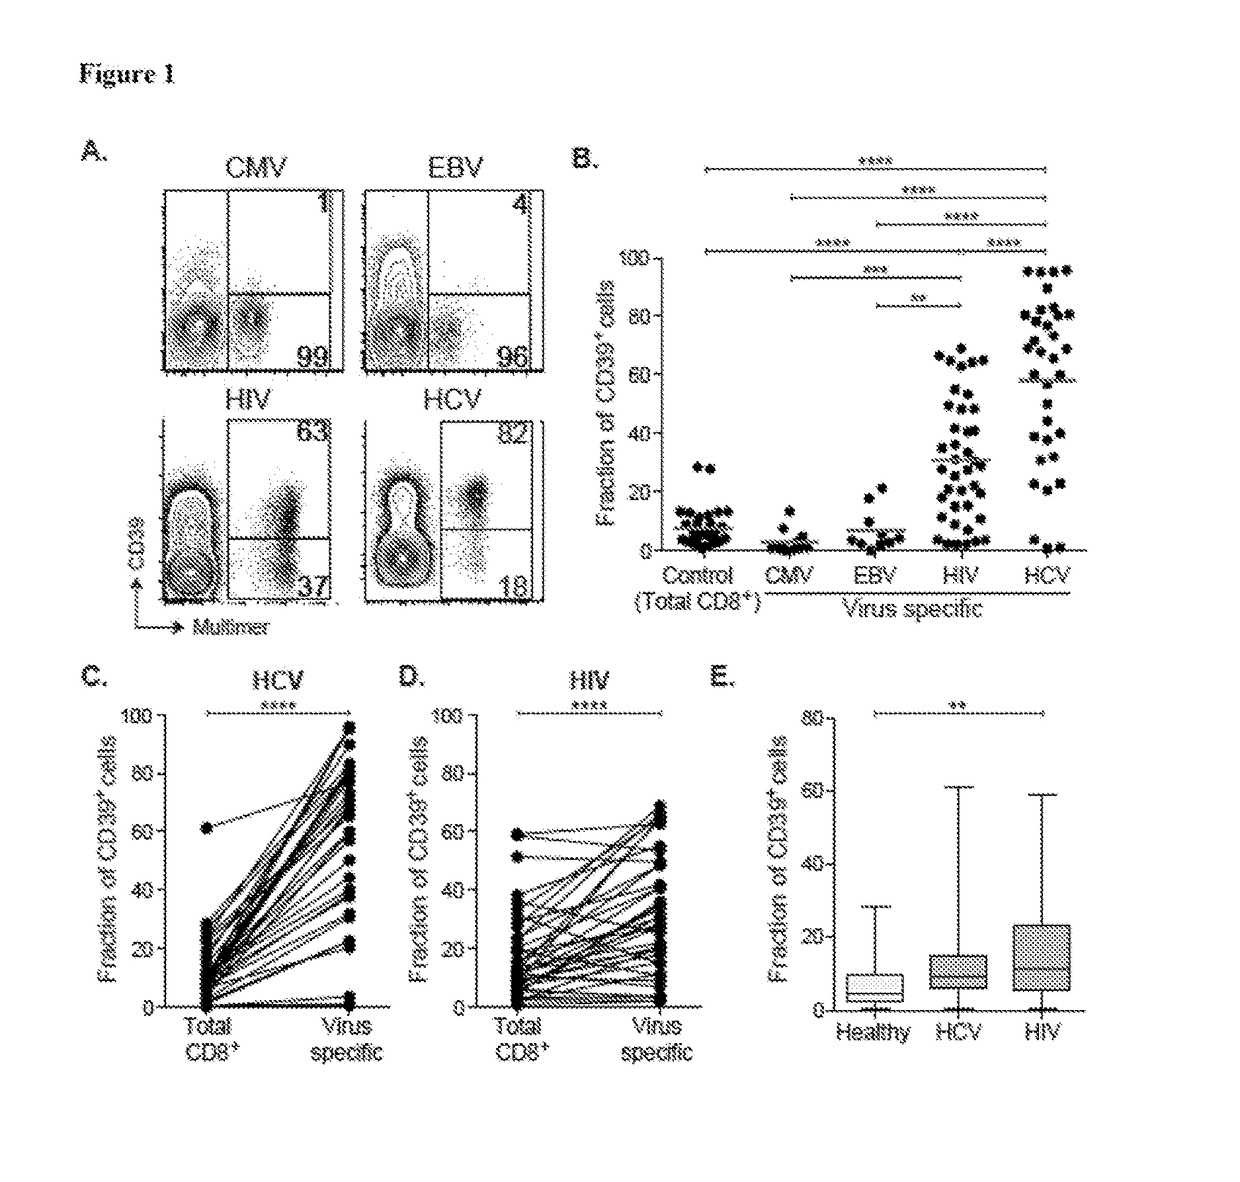
[0413]The state of CD8+ T cell exhaustion is characterized by widespread changes in gene expression relative to functional memory CD8+ T cells (Wherry et al. (2007) Immunity 27:670-684). However, in humans, identifying specific markers of T cell exhaustion that are not shared by more functional CD8+ T cell populations has been challenging (Duraiswamy et al. (2011) J. Immunol. 186:4200-4212). It is demonstrated herein that high-level expression of the ectonucleotidase CD39 is characteristic of CD8+ T cells specific for chronic viral infections in humans and mice, but is otherwise rare in the CD8+ T cell compartment of he...
PUM
| Property | Measurement | Unit |
|---|---|---|
| Magnetic field | aaaaa | aaaaa |
| Time | aaaaa | aaaaa |
| Level | aaaaa | aaaaa |
Abstract
Description
Claims
Application Information