
Characterizing the i/o-performance-per-watt of a computing device across a range of vibrational operating environments

a computing device and operating environment technology, applied in the field of computer system energy efficiency characterization technology, can solve the problems of increasing the power consumption of modern servers with current-generation spinning hard disk drives, hyper-sensitive generation of spinning hdds to low-level ambient vibration, and energy costs becoming the largest component of the “total cost of ownership” of a data center

Active Publication Date: 2018-03-01
ORACLE INT CORP
View PDF9 Cites 5 Cited by
  • Summary
  • Abstract
  • Description
  • Claims
  • Application Information

AI Technical Summary

Benefits of technology

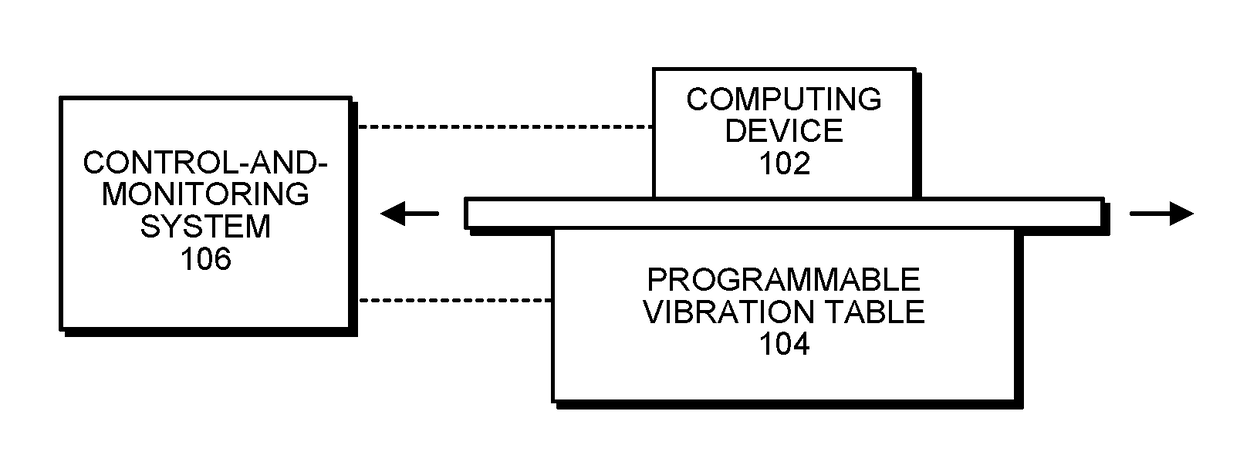
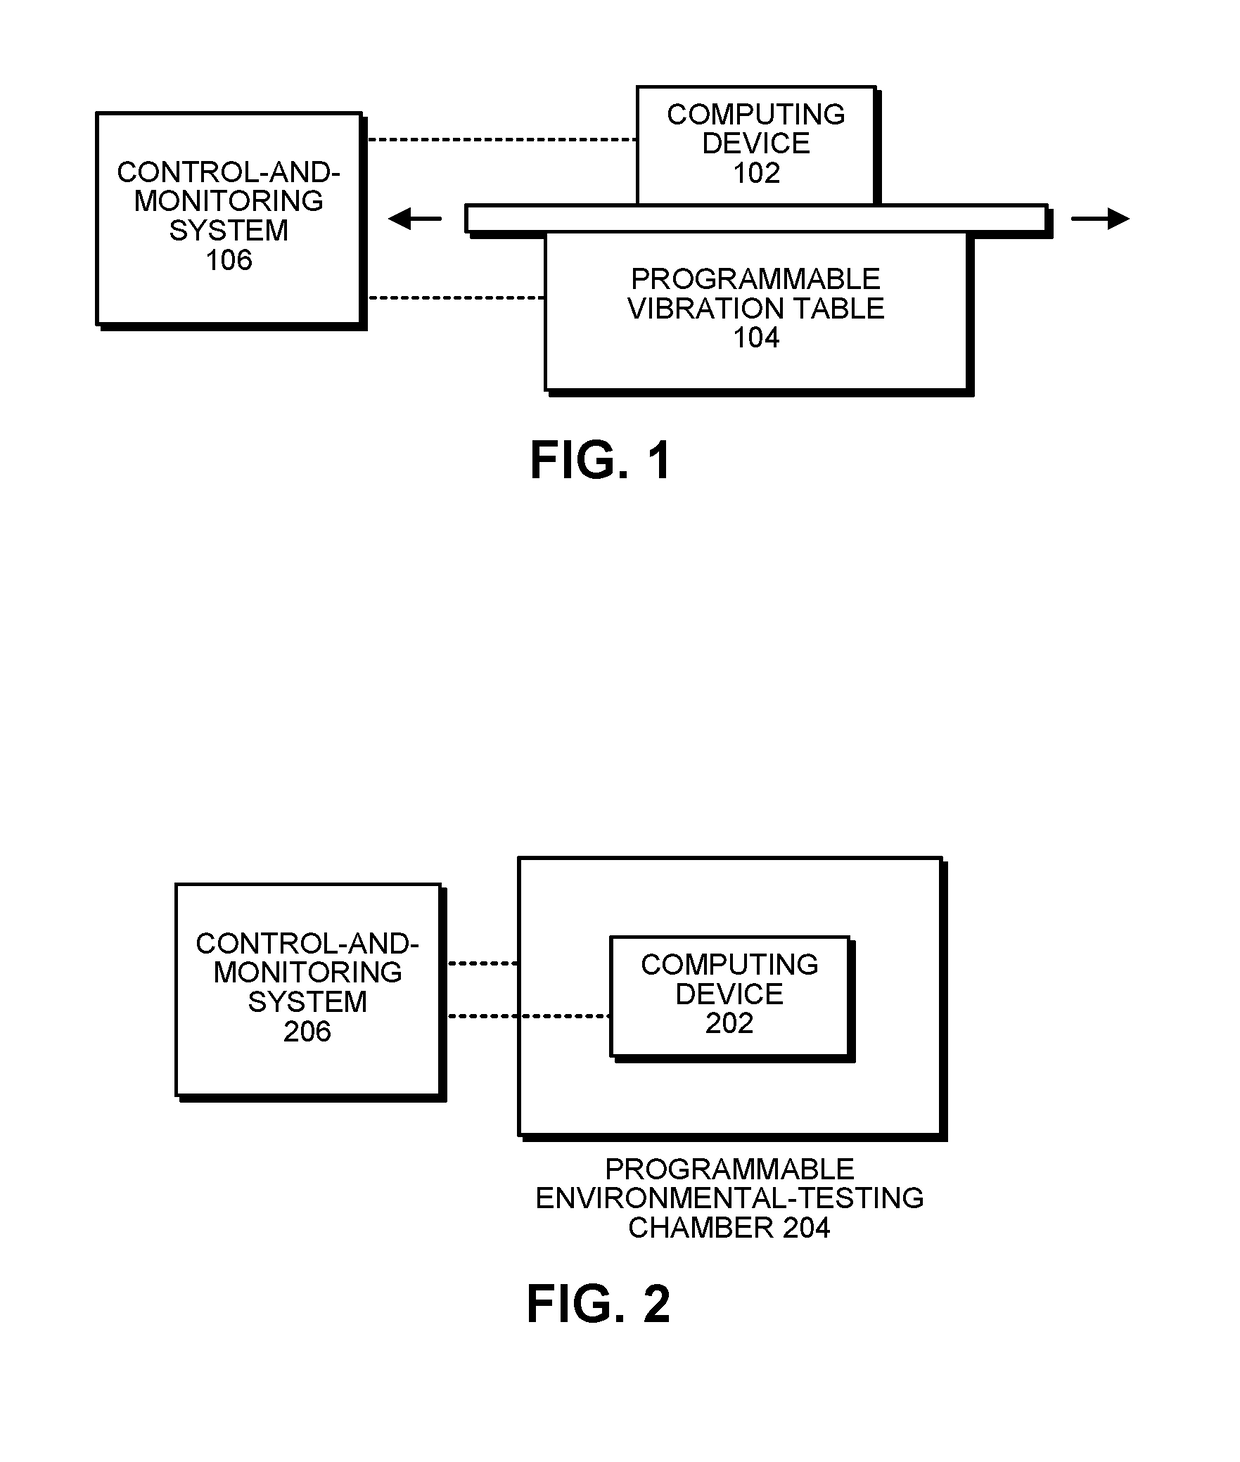
The disclosed embodiments are about a system that measures the energy consumption of a computer device when it is subjected to different vibration patterns. The system uses a programmable vibration table to test the device while subjecting it to different frequencies and amplitudes. The results of the test are used to characterize the device's performance in terms of energy consumption across different vibration environments, as well as ambient temperatures and simulated altitudes. The system also attempts to identify and modify the device's resonance frequencies to improve its performance. Overall, the system can help engineers design and modify computer devices for better energy efficiency.

Problems solved by technology

In recent years, energy costs have become the largest component of the “total cost of ownership” of a data center.
However, the power usage of modern servers with current-generation spinning Hard Disk Drives (HDDs) is more complicated.
This is because the latest generations of spinning HDDs have become hyper-sensitive to low-level ambient vibrations in the environment in which the server is deployed, wherein these vibrations depend to a large extent on ambient temperatures.
This is because current-generation servers use variable-speed cooling fans, and nearby Computer-Room Air Conditioners (CRACs) also have variable-speed compressors and blowers, which generate additional vibrations that couple into the metal racks holding the servers.
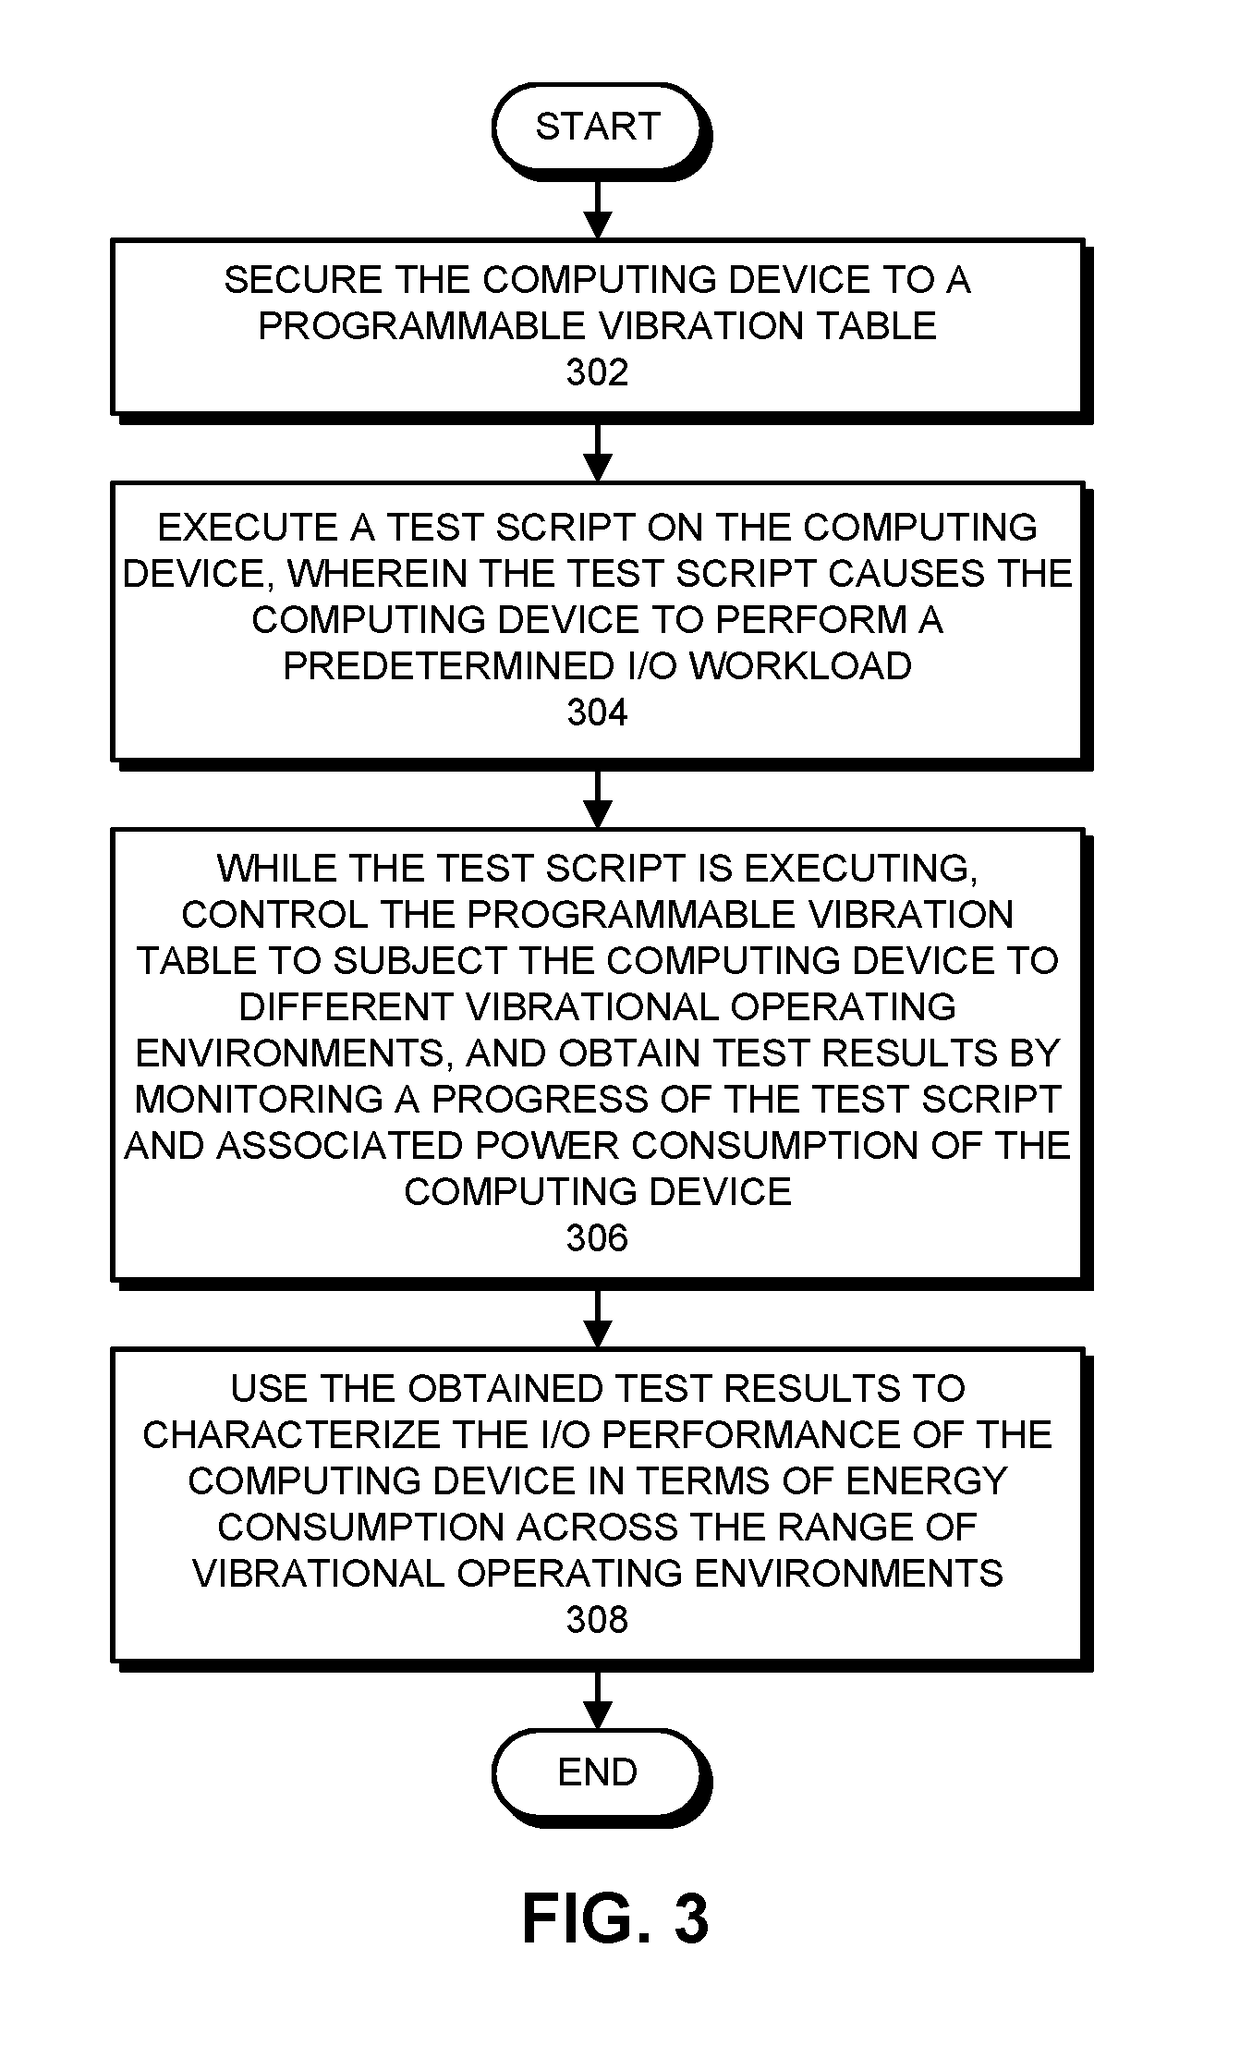
At the same time, the system obtains test results by monitoring a progress of the test script and associated power consumption of the computing device.

Method used


Image

  • Characterizing the i/o-performance-per-watt of a computing device across a range of vibrational operating environments
  • Characterizing the i/o-performance-per-watt of a computing device across a range of vibrational operating environments
  • Characterizing the i/o-performance-per-watt of a computing device across a range of vibrational operating environments

Examples


example

[0045]In one exemplary testing scenario, the operations outlined in the flowcharts that appear in FIGS. 3-4 are performed as follows. If there exist two identical Systems Under Test (SUTs), one unit is fixed to a programmable vibration table, and the other unit is placed in a programmable environmental-testing chamber. Note that this technique can also be can be used if only one SUT exists. However, in this case the characterization procedure is applied sequentially, first to the SUT on the programmable vibration table, and second in the programmable environmental-testing chamber. The remainder of this example assumes the existence of two identical SUTs that are tested in parallel.

[0046]In the first step of the testing scenario, real-time dynamic power monitoring is actuated on both SUTs to measure power in parallel with environmental conditions and IOPS / watt metrics. This power can be monitored either by using an external power meter, or through “soft metering” using an inferential...


PUM


Abstract

The disclosed embodiments relate to a system that characterizes I / O performance of a computing device in terms of energy consumption across a range of vibrational operating environments. During operation, the system executes a test script on a computing device that is affixed to a programmable vibration table, wherein the test script causes the computing device to perform a predetermined I / O workload. While the test script is executing, the system controls the programmable vibration table to subject the computing device to different vibrational operating environments. At the same time, the system obtains test results by monitoring a progress of the test script and an associated power consumption of the computing device. Finally, the system uses the obtained test results to characterize the I / O performance of the computing device in terms of energy consumption across the range of vibrational operating environments.

Description

BACKGROUNDField[0001]The disclosed embodiments generally relate to techniques for characterizing the energy efficiency of computer systems. More specifically, the disclosed embodiments relate to a technique for characterizing the I / O-performance-per-watt of a computing device across a range of different vibrational and environmental operating environments.Related Art[0002]In recent years, energy costs have become the largest component of the “total cost of ownership” of a data center. In fact, worldwide energy usage for data centers has been growing exponentially for the past 20 years and now exceeds 38,000 megawatts of electricity. Because of this trend, data center operators are becoming increasingly interested in being able to accurately measure the energy efficiency of servers and storage devices in these data centers while executing real workloads.[0003]Measuring the “work done” per “energy consumed” used to be a trivial exercise for the first 25 or so years of the computing in...

Claims


Application Information

Patent Timeline
IPC IPC(8): G01M7/02G01R21/133
CPCG01R21/133G01M7/025G01M7/022G11B19/048
Inventor GROSS, KENNY C.BOUGAEV, ANTON A.URMANOV, ALEKSEY M.VAIDYANATHAN, KALYANARAMANMCELFRESH, DAVID K.
Owner ORACLE INT CORP
Learn More