Pharmaceutical Formulations and Methods of Making the Same

Inactive Publication Date: 2018-04-26
AMGEN INC
0 Cites 2 Cited by

AI-Extracted Technical Summary

Problems solved by technology

Formulation of a protein drug can present many challenges for the pharmaceutical scientist.
Especially for engineered proteins that differ in subst...

Method used

[0032]The osmolality of a pharmaceutical composition is preferably regulated in order to maximize the active ingredient's stability and also to minimize discomfort to the patient upon administration. It is generally preferred that a pharmaceutical composition be isotonic with serum, i.e., having the same or similar osmolality, w...

Benefits of technology

[0006]Provided herein are new and improved formulations of etanercept. In particular, the invention provides pharmaceutical compositions containing etanercept that are stable and can be conveniently stored as a liquid at controlled room temperature (CRT) for extended periods of time, even in the absence of an additional b...

Abstract

The invention relates to the formulation of pharmaceutical compositions of etanercept. The invention also relates to methods of removing buffer and of formulating pharmaceutical compositions of etanercept.

Application Domain

Peptide/protein ingredientsAntibody mimetics/scaffolds +10

Technology Topic

DrugPharmaceutical formulation +1

Image

  • Pharmaceutical Formulations and Methods of Making the Same
  • Pharmaceutical Formulations and Methods of Making the Same
  • Pharmaceutical Formulations and Methods of Making the Same

Examples

  • Experimental program(9)

Example

Example 1: Stability Testing of Various Formulations
[0048]This example demonstrates the effects of pH and buffer on etanercept at 50 mg/mL, and assesses the stability of a high concentration (100 mg/mL) solution without added phosphate buffer. The following formulations were tested.
TABLE 1 Formulations for pH Screen Protein Polysorbate Final Conc Formulation Name Buffer Excipients Added pH (mg/mL) A45SuT 10 mM 9% sucrose 0.004% 4.5 50 sodium PS20 acetate A52SuT 10 mM 9% sucrose 0.004% 5.2 50 sodium PS20 acetate A58SuT 10 mM 9% sucrose 0.004% 5.8 50 sodium PS20 acetate 50_SAST_100NaCl None 25 mM L- 0.004% 6.3 50 arginine, 100 mM PS20 NaCl, 1% sucrose 100_SAST_100NaCl None 25 mM L- 0.004% 6.3 100 arginine, 100 mM PS20 NaCl, 1% sucrose PASST + BeOH 25 mM 25 mM L- 0.004% 6.3 50 phosphate arginine, 100 mM PS20 NaCl, 1% sucrose, 0.9% benzyl alcohol PASST (control) 25 mM 25 mM L- 0.004% 6.3 50 phosphate arginine, 100 mM PS20 NaCl, 1% sucrose
[0049]Materials:
[0050]Enbrel drug substance in PASS (25 mM phosphate buffer, 25 mM L-arginine, 100 mM NaCl, 1% sucrose) at 50 mg/mL was used for this study. For the acetate and buffer-free formulation, the material was dialyzed into the new formulations (without polysorbate) and concentrated to 50 mg/mL using 10,000 MWCO centripreps. A sample of 50_SAS_100NaCl was also concentrated to 100 mg/mL (100_SAS_100NaCl). Benzyl alcohol was spiked into the current formulation to a final concentration of 0.9%. A 1% stock solution of polysorbate 20 was prepared fresh and spiked into all formulation to a final concentration of 0.004%. All formulations were manually filled into 1 mL long BD glass syringes to a volume of 0.5 mL and then stoppered using an ASPU vacuuming stoppering unit.
[0051]Methods:
[0052]The pH was measured using a Mettler Toledo SevenEasy pH meter combined with a Mettler Inlab MicroProbe. Samples were warmed to room temperature prior to measurements. Osmolality was measured using The Advanced Osmometer Model 3900. Each measurement was performed using 250 μL of sample and 290 osmolality standards were tested to ensure the system was operating properly. Size exclusion HPLC was run on an Agilent 1100 HPLC with Chromeleon 7.2 software. Denatured size exclusion HPLC was run on an Agilent 1100 HPLC with Chromeleon 7.2 software.
[0053]Results:
[0054]The pH for all formulations was maintained over 24 weeks.
TABLE 2 pH at indicated time points and temperatures pH t = 0 t = 24 w Sample 4° C. 4° C. 25° C. 40° C. A45SuT 4.60 4.66 4.66 4.61 A52SuT 5.10 5.13 5.16 5.08 A58SuT 5.61 5.60 5.66 5.62 50_SAST_100NaCl 6.24 6.21 6.22 6.17 100_SAST_100NaCl 6.32 6.21 6.20 6.19 PASST + BeOH 6.27 6.22 6.22 6.21 PASST control 6.26 6.21 6.21 6.19
TABLE 3 Aggregate levels (Peak B) by SEC, % of total, 4° C. sample t = 0 t = 4 w t = 8 w t = 12 w t = 24 w A45SuT 0.9 1.1 1.1 1.2 1.2 A52SuT 1.2 1.4 1.5 1.6 1.4 A58SuT 1.0 1.2 1.2 1.3 1.3 50_SAST_100NaCl 1.1 1.3 1.3 1.3 1.4 100_SAST_100NaCl 1.1 1.4 1.5 1.5 1.6 PASST + BeOH 1.0 1.2 1.2 1.3 1.3 PASST control 1.0 1.1 1.2 1.2 1.3
TABLE 4 Aggregate levels (Peak B) by SEC, % of total, 25° C. sample t = 0 t = 4 w t = 8 w t = 12 w t = 24 w A45SuT 0.9 2.0 2.7 3.2 4.1 A52SuT 1.2 2.7 3.1 3.6 4.6 A58SuT 1.0 1.9 2.6 3.1 4.4 50_SAST_100NaCl 1.1 1.9 2.4 2.8 3.7 100_SAST_100NaCl 1.1 2.6 3.3 3.9 5.3 PASST + BeOH 1.0 1.9 2.4 2.8 3.8 PASST control 1.0 1.8 2.2 2.6 3.5
TABLE 5 Aggregate levels (Peak B) by SEC, % of total, 40° C. t = t = t = t = t = t = sample 0 2 w 4 w 8 w 12 w 24 w A45SuT 0.9 5.6 9.0 11.9 11.9 9.6 A52SuT 1.2 6.3 12.9 13.6 16.4 17.9 A58SuT 1.0 5.1 9.1 14.7 18.4 24.5 50_SAST_100NaCl 1.1 3.9 6.8 12.1 16.0 26.0 100_SAST_100NaCl 1.1 5.9 10.8 18.5 24.0 37.8 PASST + BeOH 1.0 6.3 12.0 21.4 28.1 45.5 PASST control 1.0 4.0 6.9 12.1 16.1 26.7
TABLE 6 Low molecular species (dSEC clips) 4° C. sample t = 0 t = 4 w t = 8 w t = 12 w t = 24 w A45SuT 1.6 1.3 1.4 2.3 2.5 A52SuT 1.2 1.6 1.3 1.7 1.7 A58SuT 1.4 1.7 1.5 1.4 1.4 50_SAST_100NaCl 0.9 1.5 1.4 1.4 1.5 100_SAST_100NaCl 1.0 1.5 1.7 2.0 2.6 PASST + BeOH 1.0 1.5 1.2 1.4 1.3 PASST control 1.2 1.4 1.4 1.7 1.6
TABLE 7 Low molecular species (dSEC clips) 25° C. sample t = 0 t = 4 w t = 8 w t = 12 w t = 24 w A45SuT 1.6 3.6 5.9 8.4 13.1 A52SuT 1.2 2.9 2.9 5.8 9.2 A58SuT 1.4 2.2 2.8 4.0 5.7 50_SAST_100NaCl 0.9 2.2 2.4 2.9 4.7 100_SAST_100NaCl 1.0 2.9 3.2 4.4 6.9 PASST + BeOH 1.0 2.2 2.2 3.3 4.4 PASST control 1.2 1.6 2.1 3.2 4.8
TABLE 8 Low molecular species (dSEC clips) 40° C. t = t = t = t = t = t = sample 0 2 w 4 w 8 w 12 w 24 w A45SuT 1.6 9.7 16.7 28.3 38.1 55.0 A52SuT 1.2 6.0 11.3 18.6 26.0 39.6 A58SuT 1.4 4.0 7.7 12.2 18.2 27.5 50_SAST_100NaCl 0.9 3.6 5.9 8.6 12.8 18.7 100_SAST_100NaCl 1.0 3.5 5.7 9.6 12.9 19.4 PASST + BeOH 1.0 3.6 5.8 9.8 13.2 20.5 PASST control 1.2 3.3 5.9 10.0 12.8 20.2
[0055]Conclusions:
[0056]During long term storage at 25° C. and 40° C., the lower pH formulations, A45SuT, A52SuT, and A58SuT, exhibited undesirable levels of low molecular weight degraded or clipped species when analyzed using denatured size exclusion chromatography. The high concentration formulation 100_SAST_100NaCl stored at 25° C. and 40° C. began to show an increase in high molecular weight aggregates when analyzed using size exclusion chromatography, but performed similarly to the current commercial formulation at 4° C. The PASST+BeOH (which is the current commercial formulation modified by the addition of 0.004% polysorbate 20 and 0.9% benzyl alcohol) performed similarly to the current commercial formulation at both 4° C. and 25° C. but experienced an increase in high molecular weight species by SE-HPLC at later time points when stored at the elevated temperature of 40° C. However, the 50_SAST_100NaCl formulation maintained levels of high and low molecular weight species that were comparable to the current commercial formulation at all temperatures, even in the absence of phosphate buffer.

Example

Example 2: Pain Study
[0057]This study was a single-center, randomized, single-blind, crossover design in which 48 healthy men and women received single SC injections of 6 solutions.
[0058]Test formulations (detailed below in Table 9) were administered by a trained healthcare professional in 6 unique sequences with 8 subjects randomized to each sequence. Injections were administered in each quadrant of the anterior abdominal wall and administered approximately 1 hour apart. Within 30 seconds after each injection, subjects assessed their level of injection pain using a 100 mm Visual Analog Scale (VAS). Adverse events were collected from the beginning of the first injection through 30 days after the first injection. Safety follow-up phone calls were conducted on day 2 (24 hours after the sixth injection) and day 31 (+2 days).
TABLE 9 Tested Formulations Solution Description Volume Composition A. Negative pain 1.0 10 mM sodium acetate, 9% (w/v) control sucrose, 0.004% (w/v) polysorbate 20, pH 5.2 B. Commercial .098 25 mM sodium phosphate, 25 formulation mM L-arginine, 100 mM sodium placebo chloride, 1.0% (w/v) sucrose, pH 6.3 C. Commercial 1.0 100 mM sodium chloride, 25 formulation mM sodium phosphate, 25 mM placebo L-arginine, 1.0% (w/v) sucrose, with benzyl 0.01% (w/v) polysorbate 20, 0.9% alcohol (w/v) benzyl alcohol D. Test formulation 1.0 100 mM sodium chloride, 25 mM without sodium L-arginine, 1.0% (w/v) sucrose, phosphate 0.01% (w/v) polysorbate 20 E. Test formulation 0.51 100 mM sodium chloride, 25 mM without sodium L-arginine, 1.0% (w/v) sucrose, phosphate 0.01% (w/v) polysorbate 20 F. Commercial 0.98 50 mg/mL etanercept in a solution formulation consisting of 100 mM sodium etanercept 50 chloride, 25 mM sodium mg/mL phosphate, 25 mM L-arginine 1% sucrose, pH 6.3
[0059]Statistical Methods:
[0060]All analyses were conducted on the safety analysis set, which consisted of all subjects who received at least one solution. To provide 93.4% power to detect a 15 mm difference between the solutions (α=0.05, 2 sided), a sample size of 48 subjects (8 per sequence) was selected. A difference of 13 to 16 mm on the VAS is considered to be clinically meaningful (Gallagher et al, 2002, Am. J. Em. Med. v20; i4: 287-290).
[0061]Summary statistics (mean, SD, standard error [SE], median, minimum, maximum) were calculated for VAS scores by solution. VAS scores were analyzed using an analysis of variance (ANOVA) model, which included sequence, solution, and period as independent variables, and subject within sequence as a random effect. No adjustment was made for multiple comparisons.
[0062]Mean differences in VAS score for the primary and secondary comparisons, corresponding 95% confidence intervals (95% CI), and p-values were provided.
TABLE 10 Summary of VAS Scores Immediately after injection Soln A Soln B Soln C Soln D Soln E Soln F N 48 48 48 48 48 48 Mean 19.6 53.6 28,.7 29.8 29.6 53.4 SD 18.0 27.9 23.5 26.4 24.3 32.4 SE 2.6 4.0 3.4 3.8 3.5 4.7 Median 13.0 59.0 24.0 21.5 21.0 49.0 Min, Max 0, 66 1, 98 1, 99 0, 94 1, 86 2, 100
[0063]Conclusions:
[0064]Both Solution C (non-product specific placebo with benzyl alcohol) and Solution D (non-product specific placebo without sodium phosphate) had significantly lower mean VAS scores than Solution B (etanercept placebo; p<0.001), indicating relatively less injection site pain with these 2 solutions. No significant differences in mean VAS scores were found between Solutions C and D, between Solution B (etanercept placebo) and Solution F (active etanercept), or between different injection volumes (0.51 and 1.0 mL). Solution A (negative pain control) was associated with the least pain compared with all the other solutions. Seven subjects had 1 or more adverse events. All of the adverse events were CTCAE Grade 1 non-serious injection site reactions.

Example

Example 3: Long Term 
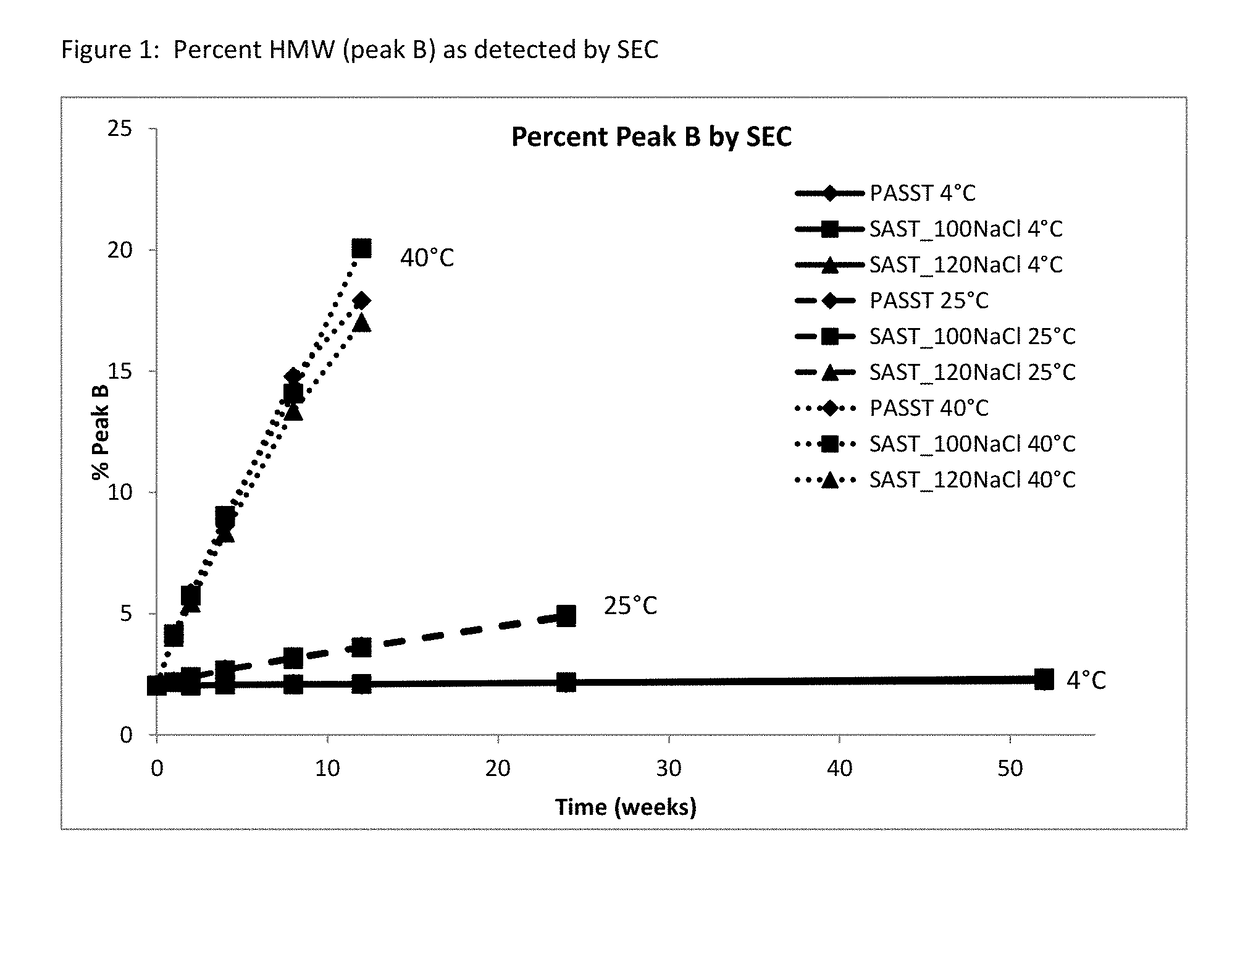
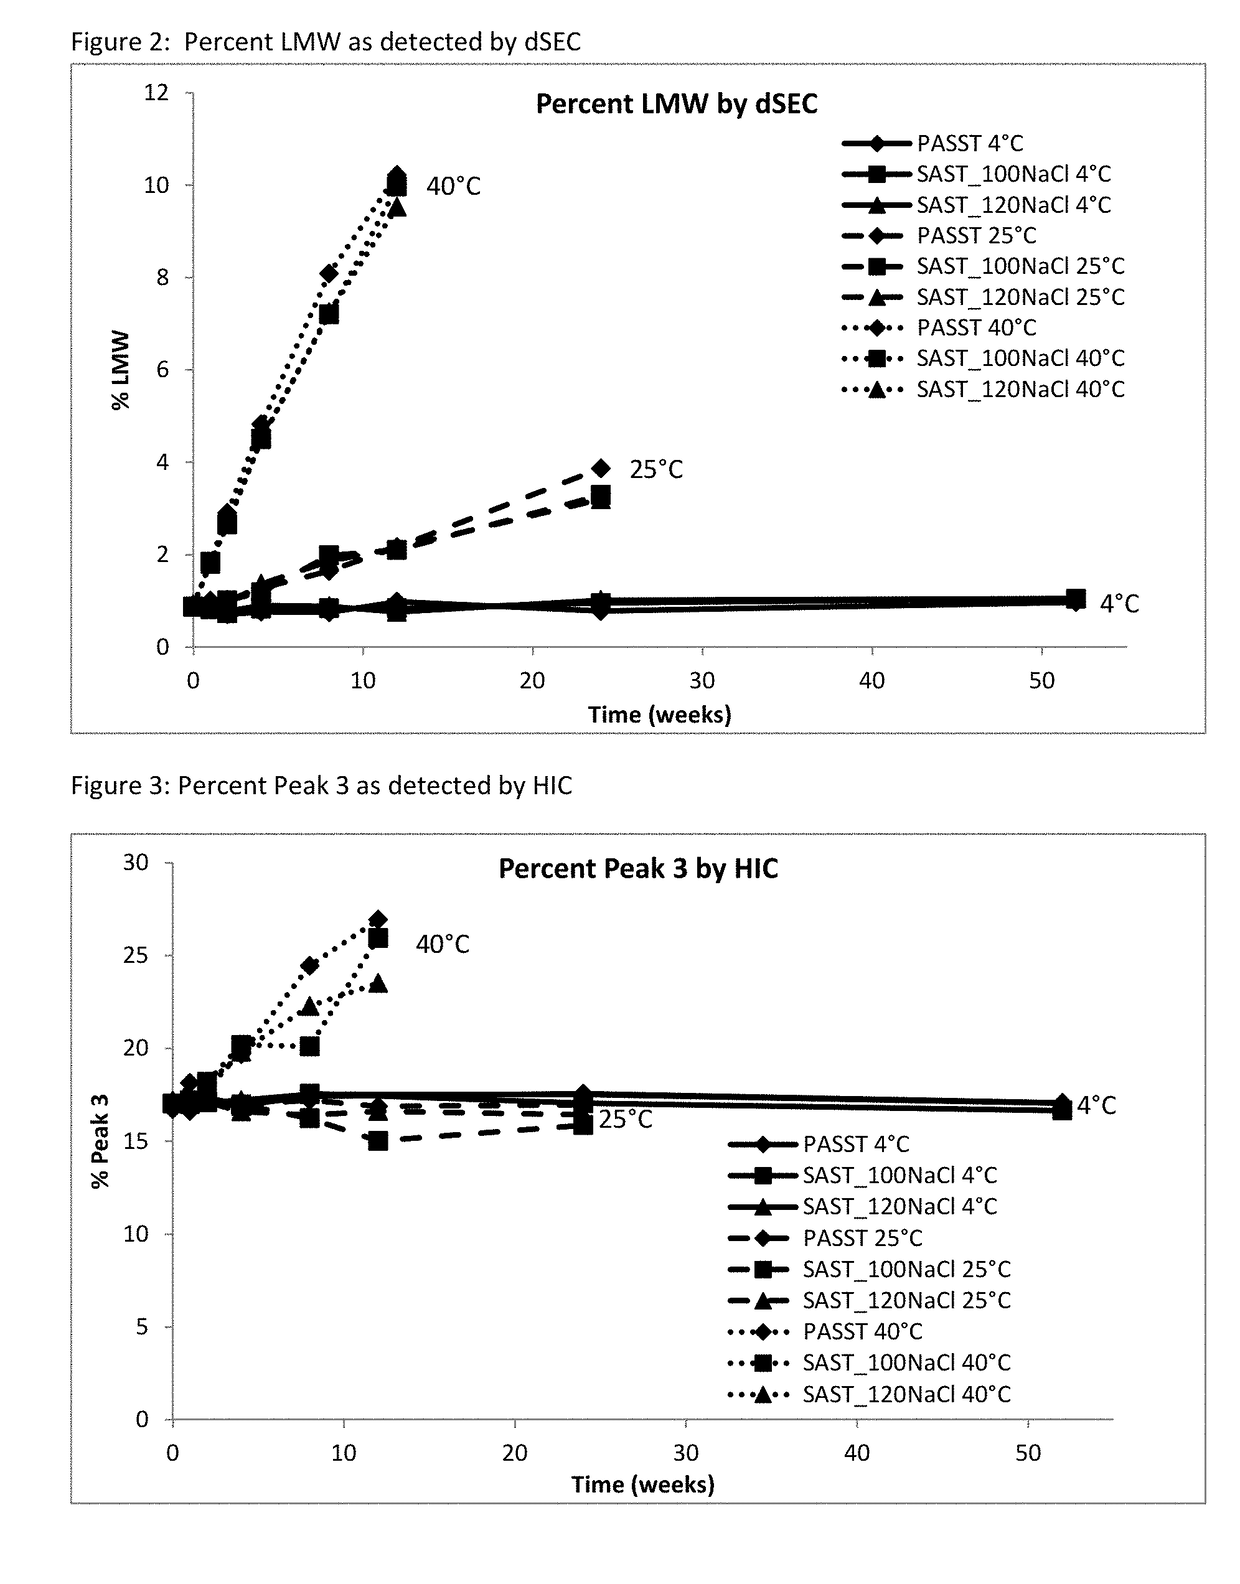
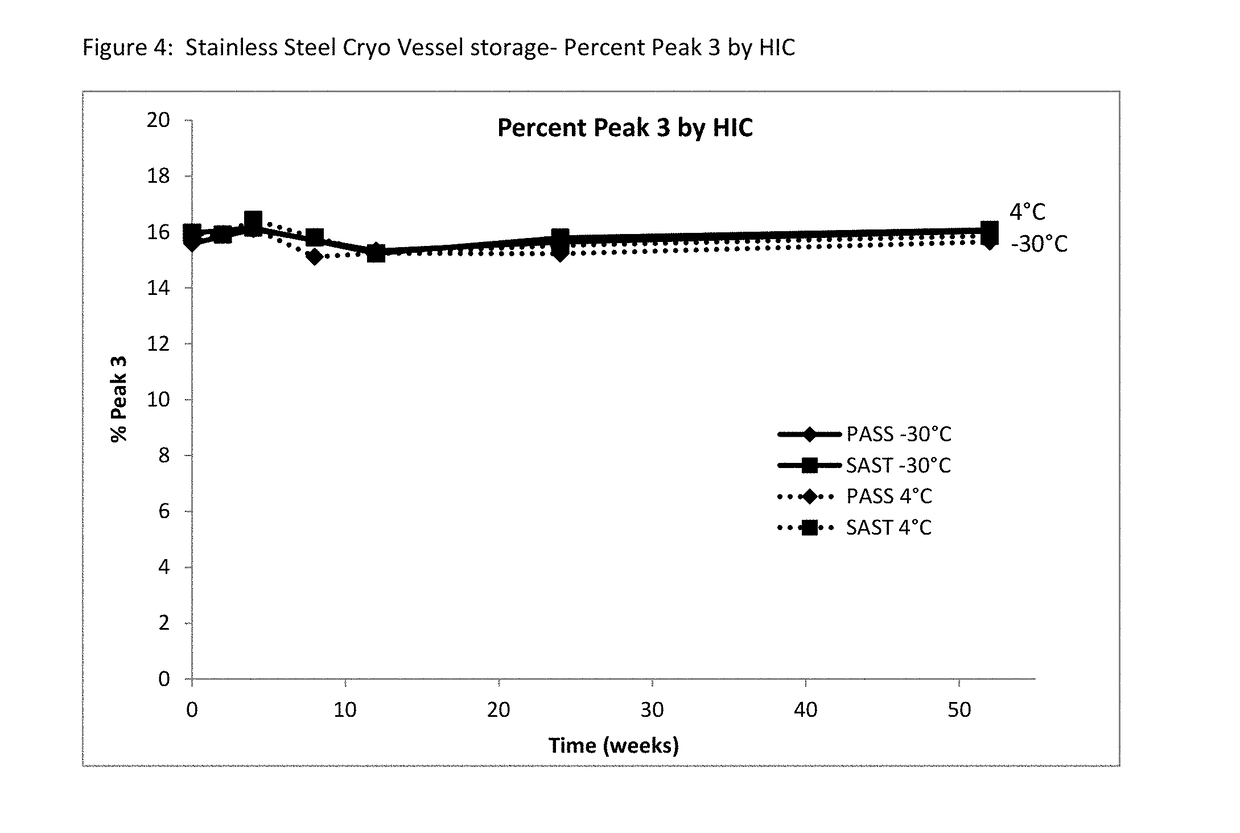
Stability Testing of Formulation Candidates
[0065]A long-term study was performed to monitor etanercept stability in several new formulation candidates at 50 mg/mL. The stability was assessed on 1 mL fills in 1 mL staked glass needle syringes using SE-HPLC, HIC HPLC, dSEC HPLC, and particulate matter (HIAC) after storage at 4° C., 25° C. and 40° C. Osmolality and protein concentration were tested at time zero only, and pH was tested at time zero and after 12 weeks of storage to confirm that there was no pH drift. The results of the study showed that the formulations tested remained similar to the current commercial formulation after 12 weeks at the accelerated temperature of 40° C., as well as 24 weeks at the recommended storage of 2-8° C. and at the accelerated temperature of 25° C.
TABLE 11 Formulation conditions at 50 mg/mL etanercept Formulation Other Name Buffer Excipients pH PASST 25 mM 25 mM L-arginine, 100 mM NaCl, 6.3 (control) phosphate 1% sucrose, 0.010% polysorbate 20 SAST_100NaCl none none 25 mM L-arginine, 100 mM NaCl, 6.3 1% sucrose, 0.010% polysorbate 20 SAST_120NaCl 25 mM L-arginine, 120 mM NaCl, 6.3 1% sucrose, 0.010% polysorbate 20
[0066]Materials:
[0067]Enbrel drug substance in PASS (25 mM phosphate buffer, 25 mM L-arginine, 100 mM NaCl, 1% sucrose) at 50 mg/mL was used for this study. The material was diafiltered into PASS and SAS_100NaCl (25 mM L-arginine, 100 mM NaCl, 1% sucrose) at 50 mg/mL and then ultrafiltered to ˜75 mg/mL. The 50 mg/mL formulations were prepared by diluting the post-UF/DF PASS and SAS material with the corresponding solution. The SAST_120NaCl was prepared by diluting the 75 mg/mL SAS material using a concentrated NaCl stock solution to achieve a final concentration of 120 mM NaCl. A 1% stock solution of polysorbate 20 was prepared fresh and spiked into all formulation to a final concentration of 0.010%. All formulations were manually filled into 1 mL long BD glass syringes to a volume of 1 mL and then stoppered using an ASPU vacuuming stoppering unit.
[0068]Methods:
[0069]The pH was measured using a Mettler Toledo SevenEasy pH meter combined with a Mettler Inlab MicroProbe. Samples were warmed to room temperature prior to measurements. Protein concentration measurements using absorbance at 280 nM for all samples were performed at room temperature using the DropSense96 UV/Vis Lab Chip DS system. Each sample was measured neat with at least three replicates (3 μL each), including a formulation solution blank. Osmolality was measured using The Advanced Osmometer Model 3900. Each measurement was performed using 250 μL of sample and 290 mOsm osmolality standards were tested to ensure the system was operating properly. Size exclusion HPLC was run on an Agilent 1100 HPLC with Chromeleon 7.2 software. Hydrophobic interaction HPLC was run on an Agilent 1100 HPLC with Chromeleon 7.2 software at an absorbance of 215 nm. Denatured size exclusion HPLC was run on an Agilent 1100 HPLC with Chromeleon 7.2 software. Sub-visible particle analysis was performed using a HACH HIAC/Royco particle counter system equipped with an HRLD-150 laser and Pharm Spec software. All samples were diluted with PASS formulation buffer to 25 mg/mL. Samples were thoroughly mixed, uncapped and degassed for 2 hours at 75 torr prior to analysis. Four (4) sips of 1.0 mL each (no tare volume) were performed, with the first sip discarded and the remaining three sips averaged. Data for particle sizes 2, 5, 10, and m was collected at all time points. The results account for the dilution and are reported as cumulative counts per milliliter.
[0070]Results and Discussion:
[0071]The pH of all formulations was measured at time zero and after twelve weeks at all temperatures. No trends were observed as a function of time or storage temperature. The measured pH values for all samples can be found in Table 12. No drift in pH was observed after 52 weeks of storage at 4° C., 24 weeks of storage at 25° C. or twelve weeks of storage at 40° C.; all samples met the acceptance criteria of +/−0.2 pH units from the target Ph of 6.3.
TABLE 12 Measured pH for samples t = 52 w t = 24 w t = 12 w Formulation Acronym t = 0 4° C. 25° C. 40° C. PASST 6.27 6.30 6.32 6.28 SAST_100NaCl 6.23 6.15 6.25 6.20 SAST_120NaCl 6.22 6.16 6.24 6.15
[0072]The protein concentration of all formulations was tested at time zero. The protein concentration results for all samples can be found in Table 13. All samples met the acceptance criteria.
TABLE 13 Protein Concentration measurements Formulation Acronym t = 0 PASST 51.1 SAST_100NaCl 51.4 SAST_120NaCl 51.0
[0073]Osmolality was tested at time zero only. The osmolality results for all samples can be found in Table 14. All formulations were at their target osmolality. Due to differences in buffer and excipient levels, the osmolality was not expected to be the same across the various formulations.
TABLE 14 Osmolality measurements t = 0 Formulation Acronym (measured) theoretical PASST 314 313 SAST_100NaCl 262 263 SAST_120NaCl 299 300
[0074]SE-HPLC was performed to monitor aggregation levels as a function of formulation condition, time and temperature. Peak B is the amount of high molecular weight species (aggregate) that forms. Results showed no differences in Peak B between the PASST control and the buffer-less formulations at 4° C. and 25° C., with minor differences being observed after twelve weeks at 40° C. (FIG. 1). Peak B represents the total aggregate detected by SE-HPLC for these formulations. All samples remained acceptable (Peak B≤6%,) after 52 weeks of storage at 4° C., 24 weeks of storage at 25° C., and after twelve weeks of storage at 40° C.
[0075]Denatured SE-HPLC was used to monitor clip species LMW. Results showed similar trends in HMW species, main peak, LMW between the formulations after 52 weeks (FIG. 2).
[0076]Changes in misfolded aggregates were monitored by HIC HPLC. Results at all tested temperatures showed no differences in Peak 3 between the PASST control and the bufferless formulations (FIG. 3). All samples remained within acceptable ranges (Peak 1≤5%, Peak 2≥70%, Peak 3≤28%) after 52 weeks of storage at 4° C., 24 weeks of storage at 25° C., and after twelve weeks of storage at 40° C.
[0077]Sub-visible particles were monitored by light obscuration particle counting (HIAC). Results were in line with historical PFS data and were similar between the formulations across all temperatures after twelve weeks. No trends could be established from this data set, as a single vial containing three pooled syringes was used at each time point and there is a high level of syringe-to-syringe variability in the contribution to silicone oil droplets.
[0078]Conclusions:
[0079]The long-term stability of several new reformulation candidates and the current commercial formulation with the addition of polysorbate was assessed at 4° C., 25° C. and 40° C. No significant differences were observed between the formulations after 52 weeks at 4° C. and 24 weeks at 25° C. by SE-, dSEC, or HIC HPLC assays as well as by light obscuration; minor differences were observed after twelve weeks at 40° C. by HPLC assays. No drift in pH was observed and all formulations remained within acceptable ranges. The results of the study showed that the SAST_120NaCl and SAST_100NaCl formulations at 50 mg/mL were stable and similar to the current commercial formulation after twelve weeks at the recommended storage temperature of 2° C. to 8° C.

PUM

PropertyMeasurementUnit
Temperature25.0°C
Temperature2.0°C
Fraction0.005fraction

Description & Claims & Application Information

We can also present the details of the Description, Claims and Application information to help users get a comprehensive understanding of the technical details of the patent, such as background art, summary of invention, brief description of drawings, description of embodiments, and other original content. On the other hand, users can also determine the specific scope of protection of the technology through the list of claims; as well as understand the changes in the life cycle of the technology with the presentation of the patent timeline. Login to view more.

Similar technology patents

Shelf of loom

InactiveCN102953216Aconvenient storage
Owner:WUJIANG CITY HONGSHENG TEXTILE

Electric heater convenient to store

InactiveCN113137655AConvenient storagereduce occupancy
Owner:郜宇航

Easily taken and carried holder for boots

InactiveUS20140367986A1convenient storageeasily take
Owner:LIAO YU WEN

Novel table

InactiveCN104433276Aconvenient storageSimple structure
Owner:广西生润生态农业有限公司

Method for prolonging preservation period of salmon

PendingCN113729071Aconvenient storageimprove security
Owner:ZHEJIANG UNIV +1

Classification and recommendation of technical efficacy words

  • convenient storage

Systems and methods for providing a portable toilet system

InactiveUS20090038066A1convenient storagequickly assemble
Owner:GLOBAL SANITATION SOLUTIONS

A folding device to assist in self insertion of a catheter tube into the urethral orifice of women

InactiveUS20180008804A1easily and simply unfoldconvenient storage
Owner:GR DOME MEDICAL

Apparatus for inducing sleep in babies

InactiveUS20110221148A1easily storeconvenient storage
Owner:ANNESE STEPHEN

Building block unit, assembling structure and base having the same

InactiveUS20140227938A1convenient storage
Owner:CHIN TANG PAPERWARE
Why Eureka
Try Eureka