Inventory Analysis Device and Inventory Analysis Method
a technology of inventory analysis and analysis device, which is applied in the field of inventory analysis device and inventory analysis method, can solve the problem of always arising differences between a plan and an actual situation
- Summary
- Abstract
- Description
- Claims
- Application Information
AI Technical Summary
Benefits of technology
Problems solved by technology
Method used
Image
Examples
first embodiment
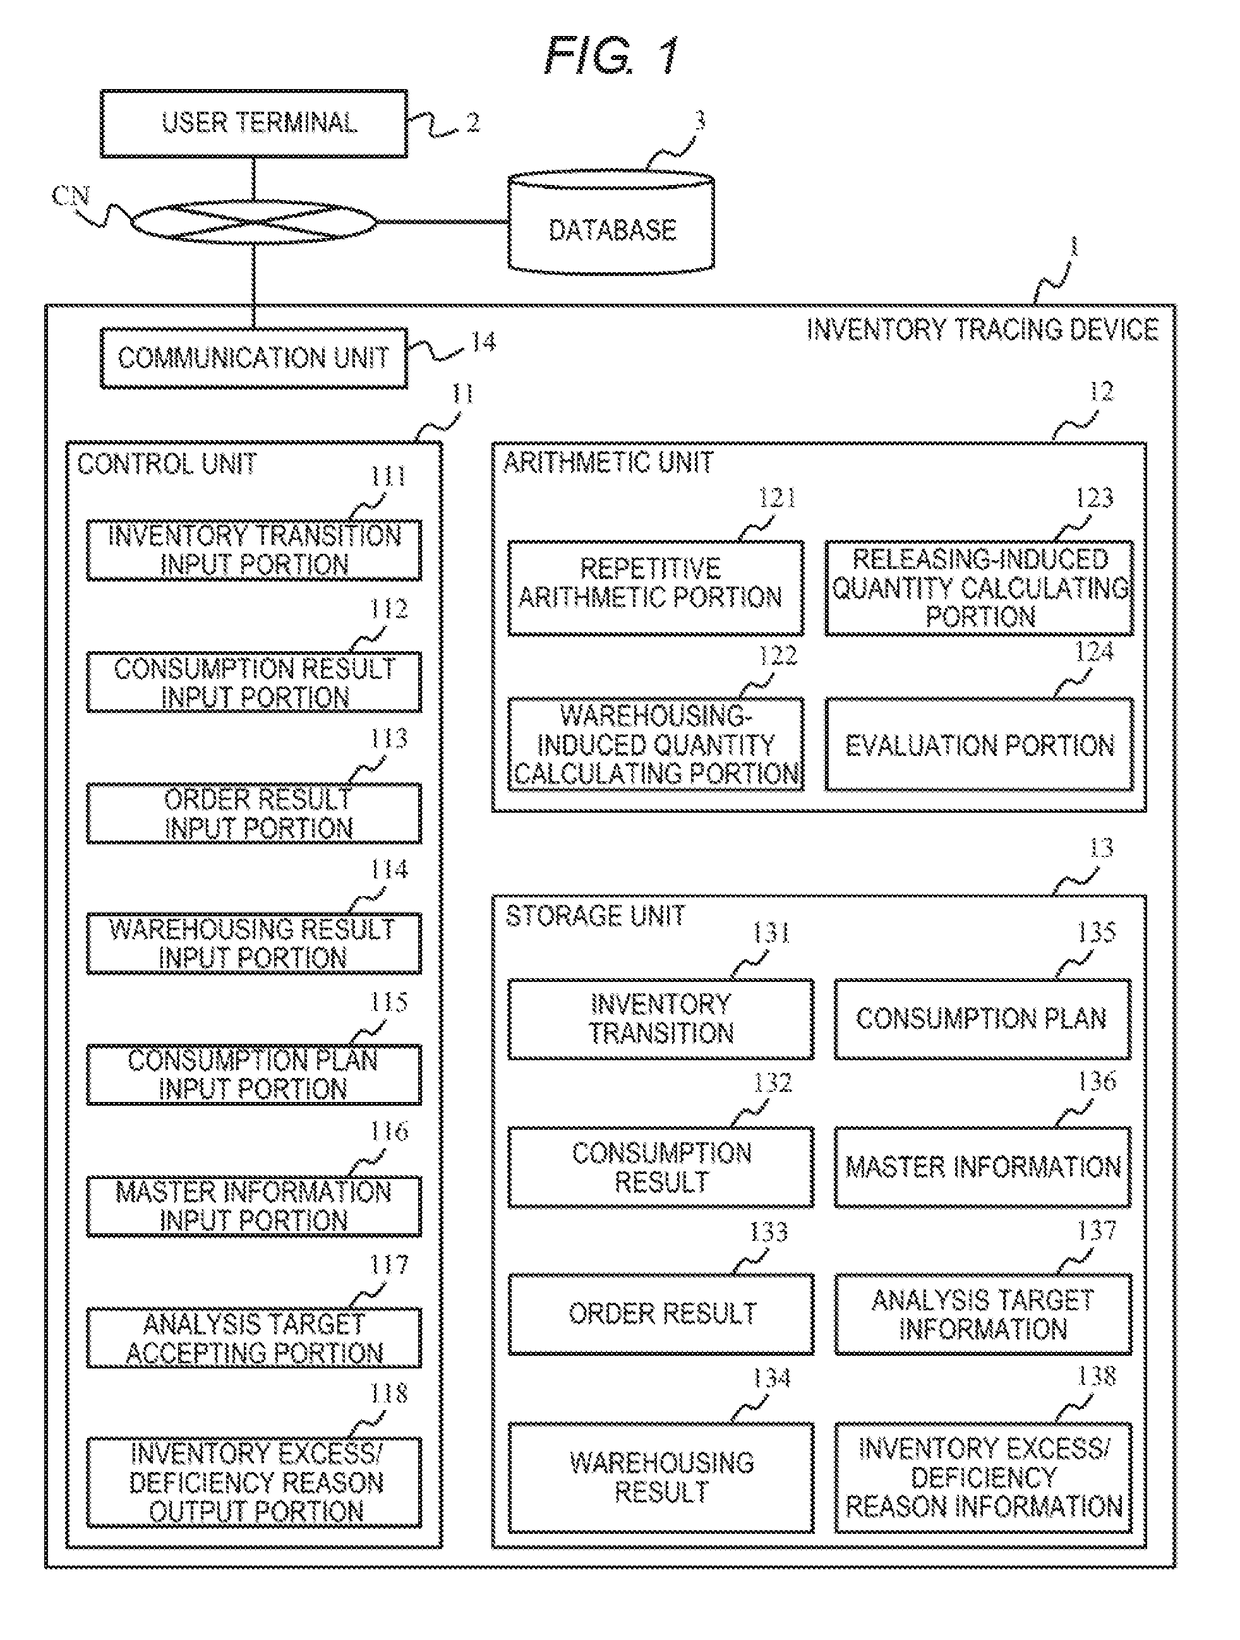
[0028]FIG. 1 is a functional block diagram of an inventory tracing device 1 according to the embodiment. The inventory tracing device 1 is configured as a computer. Focusing on the function, the inventory tracing device 1 includes, for example, a control unit 11, an arithmetic unit 12, a storage unit 13, and a communication unit 14. Information necessary for the processing of the arithmetic unit 12 can be acquired from a user terminal 2 and a database 3 via the communication unit 14 and a network CN.
[0029]The control unit 11, the arithmetic unit 12, and functional portions included in these units may be configured using hardware such as a circuit device that implements these functions, or may be configured such that software for implementing these functions may be executed by an arithmetic device.
[0030]The control unit 11 includes, for example, an inventory transition input portion 111, a consumption result input portion 112, an order result input portion 113, a warehousing result i...
second embodiment
[0089]A second embodiment will be described with reference to FIG. 12. Since the following embodiments including this embodiment correspond to a modified example of the first embodiment, differences from the first embodiment will be mainly described. In the present embodiment, goods to be analyzed can be selected from a predetermined viewpoint prepared in advance.
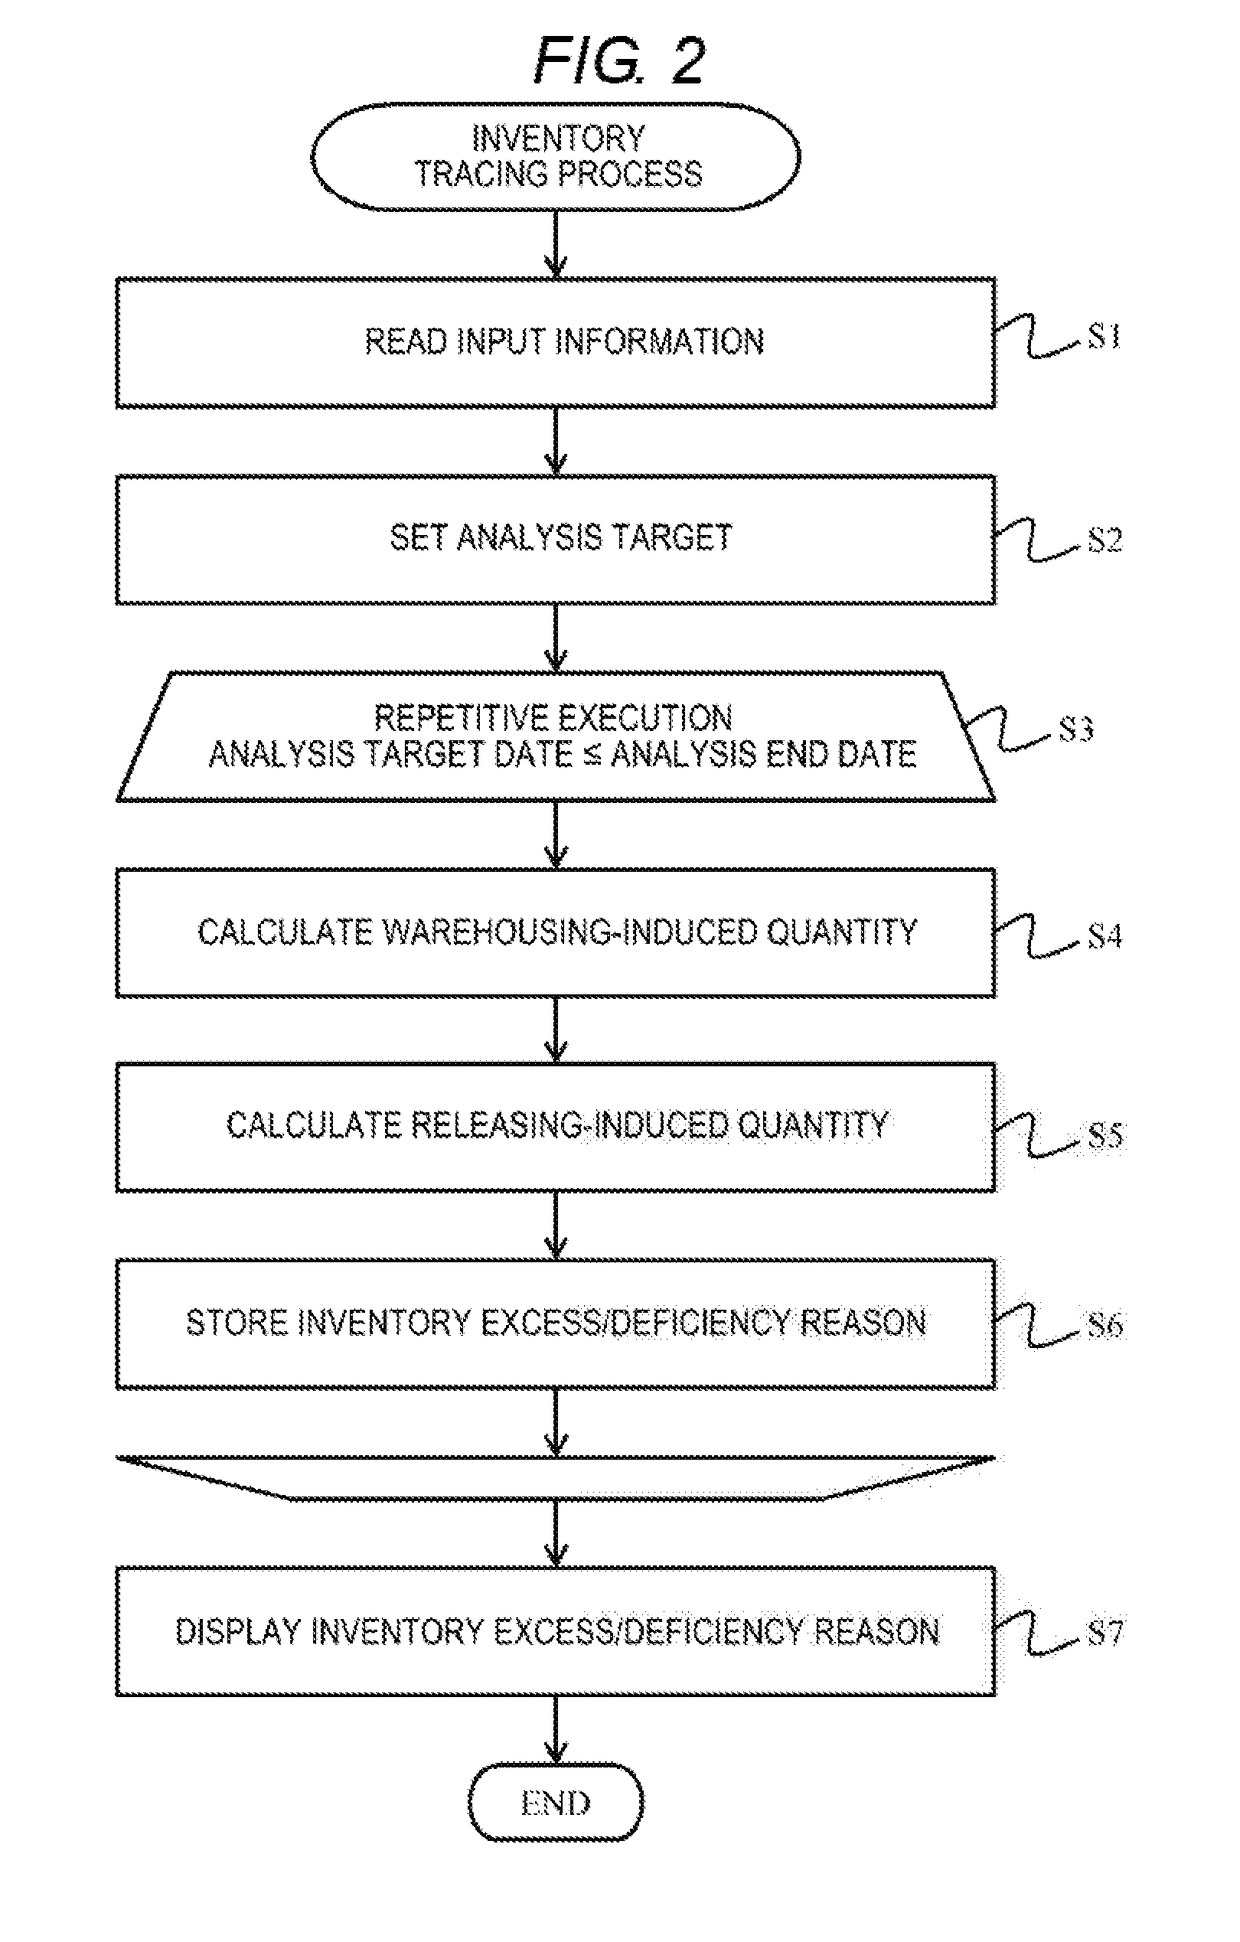
[0090]The flowchart of FIG. 12 illustrates step S2A which is a detailed modification of the process (S2) of setting the analysis target described in FIG. 2. That is, step S2A in FIG. 12 can be replaced with step S2 in FIG. 2.
[0091]In the present embodiment, when the process proceeds to the process of setting the analysis target (S2A), a screen 141 for setting the analysis target is displayed on the user terminal 2 (S21). The user selects the analysis target using the screen 141 (S22).
[0092]As illustrated in the lower part of FIG. 12, the analysis target setting screen 141 includes, for example, a viewpoint selection column ...
third embodiment
[0095]A third embodiment will be described with reference to FIG. 13. In the present embodiment, when the user designates the product to be analyzed, the user analyzes the inventory excess / deficiency reasons of the respective parts constituting the product.
[0096]FIG. 13 is a flowchart illustrating an operation of the inventory tracing device 1 according to the present embodiment.
[0097]First, the inventory tracing device 1 acquires information for specifying the product to be analyzed, from the user terminal (S11). The user selects the product to be analyzed for the inventory excess / deficiency reason from a product list displayed on the user terminal 2.
[0098]The inventory tracing device 1 specifies respective parts constituting the product designated by the user (S12). The inventory tracing device 1 executes processing of steps S14 to S17 described below for each part specified in step S12 (S13).
[0099]In step S14, the inventory tracing device 1 repeatedly and sequentially executes th...
PUM
 Abstract
Description
Claims
Application Information
 - R&D
- Intellectual Property
- Life Sciences
- Materials
- Tech Scout
- Unparalleled Data Quality
- Higher Quality Content
- 60% Fewer Hallucinations
Browse by: Latest US Patents, China's latest patents, Technical Efficacy Thesaurus, Application Domain, Technology Topic, Popular Technical Reports.
© 2025 PatSnap. All rights reserved.Legal|Privacy policy|Modern Slavery Act Transparency Statement|Sitemap|About US| Contact US: help@patsnap.com


