Two-dimensional scalar field data visualization method and system based on colormap optimization

a two-dimensional scalar field and data visualization technology, applied in the field of two-dimensional scalar field data visualization, can solve the problems of subtle change of interest of users in the data to be hidden, data is often unevenly distributed, and the choice of well-tested colormaps is very important and challenging problems for the visualization of two-dimensional scalar field data. achieve the effect of maximizing the contrast of foreground and background

Pending Publication Date: 2021-09-02
SHANDONG UNIV
View PDF7 Cites 2 Cited by
  • Summary
  • Abstract
  • Description
  • Claims
  • Application Information

AI Technical Summary

Benefits of technology

[0025]For the two-dimensional scalar data field, the present disclosure proposes, by organically fusing colormap characteristics and data distribution characteristics, a colormap optimization method that can highlight subtle data changes, maintain the original colormap characteristics, and maximize the contrast of the foreground and background, and defines a plurality of interactive exploration methods, which can fully meet the urgent needs for aspects such as colormap design and selection and interactive exploration in the process of scientific data analysis and visualization.

Problems solved by technology

Therefore, choosing a well-tested colormap is a very important and challenging problem for the visualization of two-dimensional scalar field data.
A problem in this process is that the data is often unevenly distributed, and the colormap is often evenly distributed.
There is inconsistency between the data and the colormap, which may cause a subtle change of interest by a user in the data to be hidden.
In order to reveal potential data features, the scientist usually selects and adjusts the colormap through a trial-and-error process, which is often time-consuming and requires more field experience.
However, this type of work mainly focuses on the colormap without considering the data.
However, such methods cannot express continuous features within the global data range.

Method used


Image

  • Two-dimensional scalar field data visualization method and system based on colormap optimization
  • Two-dimensional scalar field data visualization method and system based on colormap optimization
  • Two-dimensional scalar field data visualization method and system based on colormap optimization

Examples


embodiment 1

[0051], the present embodiment provides a two-dimensional scalar field data visualization method based on colormap optimization.

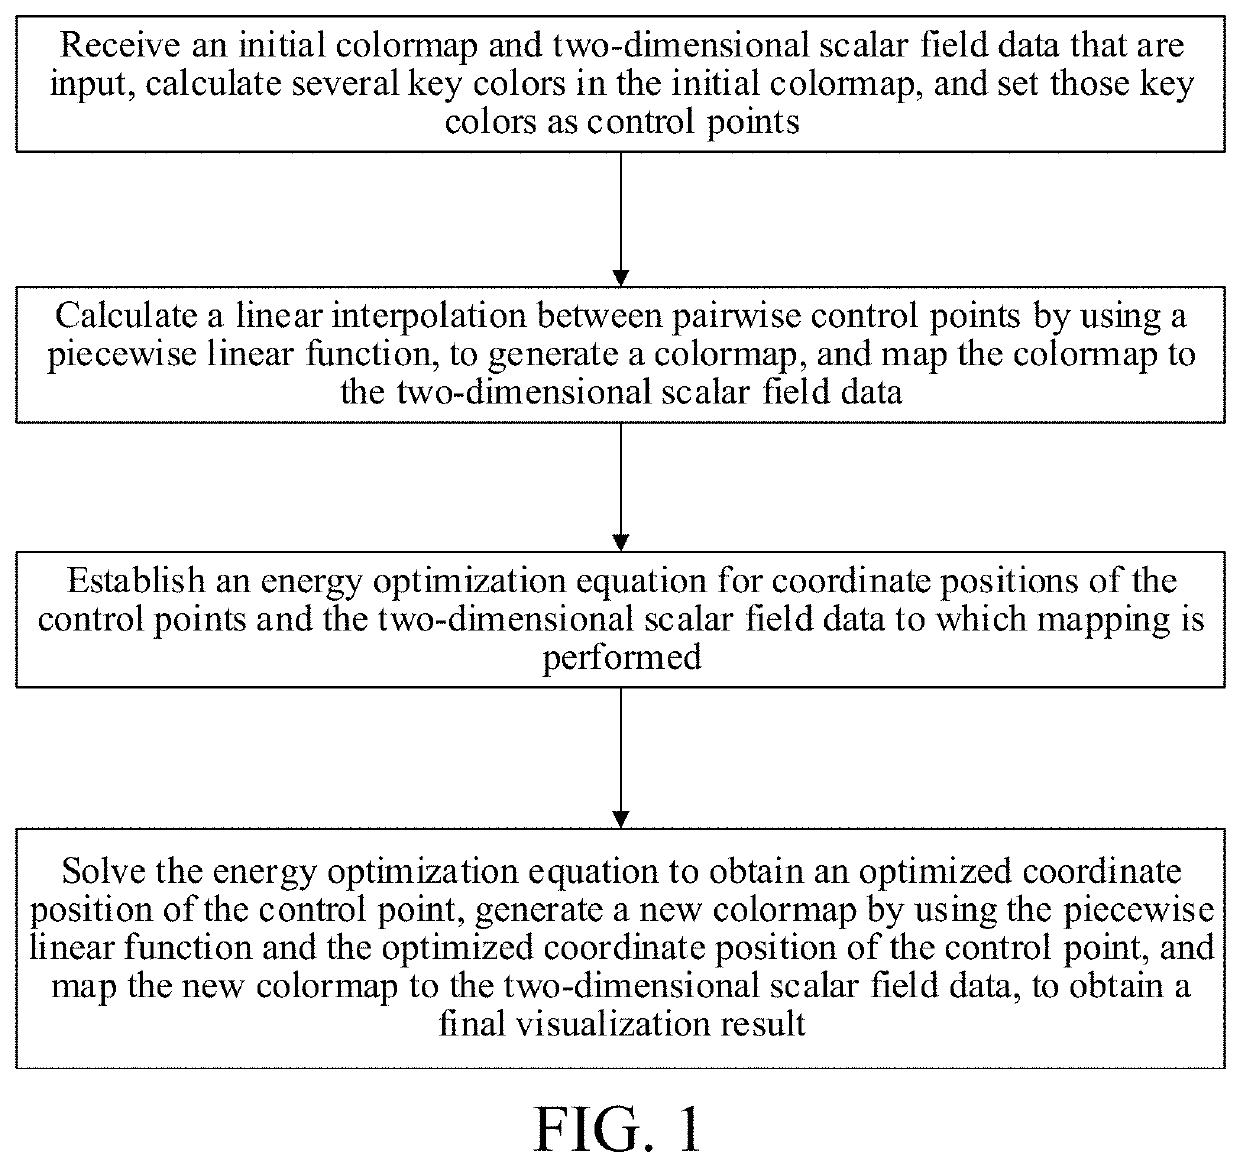
[0052]FIG. 1 is a flowchart of the present disclosure. The two-dimensional scalar field data visualization method based on colormap optimization includes:

[0053]S1: Receive an initial colormap and two-dimensional scalar field data that are input; calculate key colors in the initial colormap, and set those key colors as control points;

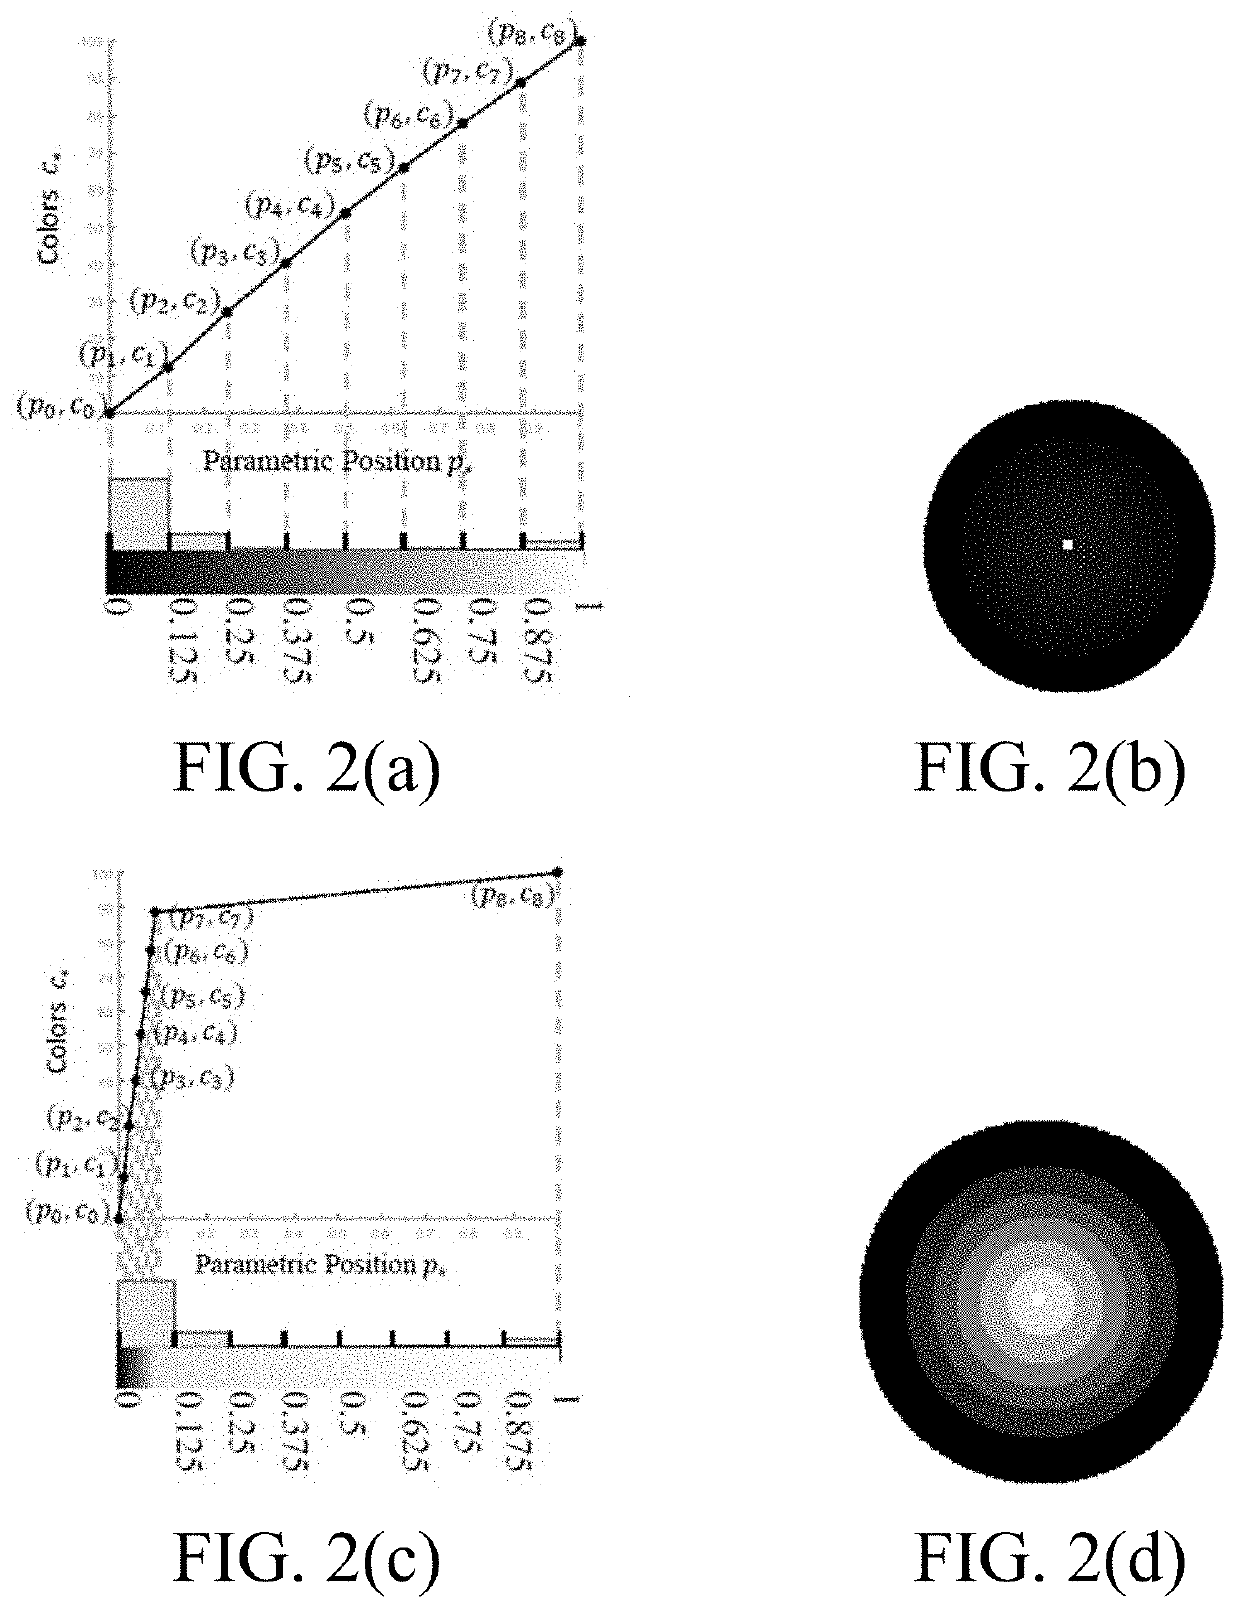
[0054]S2: Calculate a linear interpolation between pairwise control points by using a piecewise linear function, to generate a colormap, and mapping the colormap to the two-dimensional scalar field data; for example, the control points shown in FIG. 2(a), FIG. 2(b), FIG. 2(c), and FIG. 2(d).

[0055]S3: Establish an energy optimization equation for coordinate positions of the control points and the two-dimensional scalar field data for which mapping is performed, where the coordinate positions of the control points are numerical va...

embodiment 2

[0124], the present embodiment further provides a two-dimensional scalar field data visualization system based on colormap optimization.

[0125]The two-dimensional scalar field data visualization system based on colormap optimization includes:

[0126]an input module configured to: receive an initial colormap and two-dimensional scalar field data that are input; calculate several key colors in the initial colormap, and set those key colors as control points;

[0127]a mapping module configured to calculate a linear interpolation between pairwise control points by using a piecewise linear function, to generate a colormap, and map the colormap to the two-dimensional scalar field data; for example, the control points shown in FIG. 2(a), FIG. 2(b), FIG. 2(c), and FIG. 2(d).

[0128]an energy optimization equation establishing module configured to establish an energy optimization equation for coordinate positions of the control points and the two-dimensional scalar field data for which mapping is p...

embodiment 3

[0130], the present embodiment further provides an electronic device, including a memory, a processor, and a computer instruction stored in the memory and executable on the processor, when the computer instruction is executed by the processor, the operations in the method being completed. For brevity, details are not described herein again.

[0131]The electronic device may be a mobile terminal and a non-mobile terminal. The non-mobile terminal includes a desktop computer, and the mobile terminal includes mobile Internet devices such as a smartphone (such as an Android phone, an IOS phones, and the like), smart glasses, a smart watch, a smart bracelet, a tablet computer, a notebook computer, a personal digital assistant, and the like that can perform wireless communication.

[0132]It should be understood that in the present disclosure, the processor may be a central processing unit (CPU), or the processor may be another general-purpose processor, a digital signal processor (DSP), an appl...


PUM


Abstract

A two-dimensional scalar field data visualization method and system based on colormap optimization including: receiving initial colormap and two-dimensional scalar field input data; calculating key colors in the initial colormap, and setting the key colors as control points; calculating a linear interpolation between pairwise control points using a piecewise linear function, generating and mapping a colormap to the two-dimensional scalar field data; establishing an energy optimization equation for control point coordinate positions and the mapped two-dimensional scalar field data, where the coordinate positions are numerical values between 0 and 1 obtained by normalizing index values in the colormap corresponding to the control points; and solving the energy optimization equation to obtain a control point coordinate position, generating a new colormap using the piecewise linear function and optimized control point coordinate position, and mapping the new colormap to the two-dimensional scalar field data, to obtain a final visualization result.

Description

BACKGROUNDTechnical Field[0001]The present disclosure relates to the technical field of two-dimensional scalar field data visualization, and in particular, to a two-dimensional scalar field data visualization method and system based on colormap optimization.Related Art[0002]The description in this section merely provides background related to the present disclosure and does not necessarily constitute the prior art.[0003]During implementation of the present disclosure, the inventor finds the following technical problems existing in the prior art.[0004]Two-dimensional scalar data is a common way of data expression in scientific simulation and application, which is of great significance for a scientist to discover the features in the data and distinguish values. In numerous visualization methods for two-dimensional scalar data, colormap mapping is an effective and commonly used method, which refers to a mapping process of assigning a distinguishable color to a quantifiable data value. ...

Claims


Application Information

Patent Timeline
Patent Type & Authority Applications(United States)
IPC IPC(8): G06T3/40G06T7/90
CPCG06T3/4007G06T7/90G06F16/26G06T11/001G06T11/206G06T2207/10024
Inventor ZENG, QIONGWANG, YUNHAITU, CHANGHECAO, YIVIOLA, IVAN
Owner SHANDONG UNIV
Why Eureka
Try Eureka