Monitoring system behavior using empirical distributions and cumulative distribution norms

a technology of empirical distribution and cumulative distribution, applied in the direction of testing/monitoring control systems, instruments, and elevators, etc., can solve the problems of human influence overflow, and the approach is typically troubled by too much data

Inactive Publication Date: 2002-11-05
OTIS ELEVATOR CO
View PDF2 Cites 36 Cited by
  • Summary
  • Abstract
  • Description
  • Claims
  • Application Information

AI Technical Summary

Benefits of technology

The present invention is totally data driven, and does not require use of human intervention until the source of a system abnormality is identified. The invention per...

Problems solved by technology

Such methodology suffers from an abundance of human influence: the relevant features are selected in accordance with not only what an expert knows about the system, but also what an exper...

Method used


Image

  • Monitoring system behavior using empirical distributions and cumulative distribution norms
  • Monitoring system behavior using empirical distributions and cumulative distribution norms
  • Monitoring system behavior using empirical distributions and cumulative distribution norms

Examples


Embodiment Construction

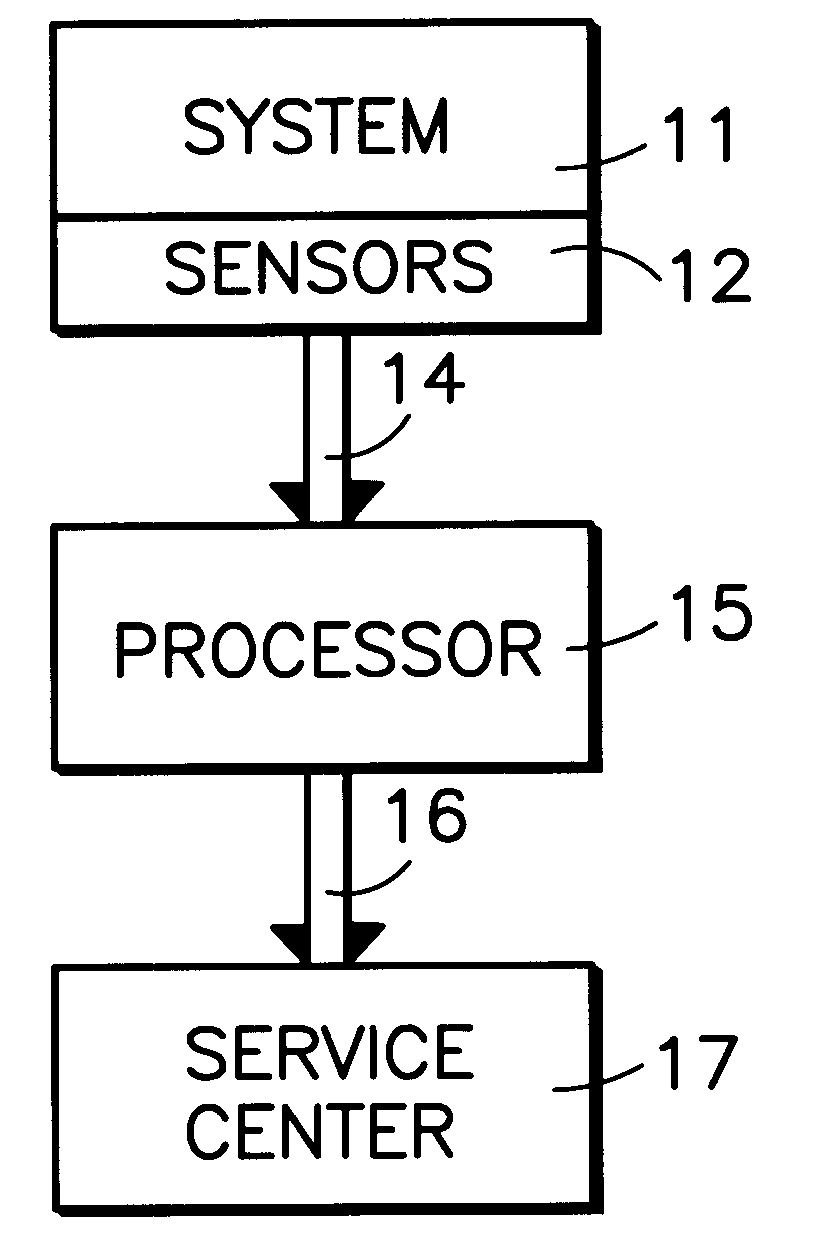
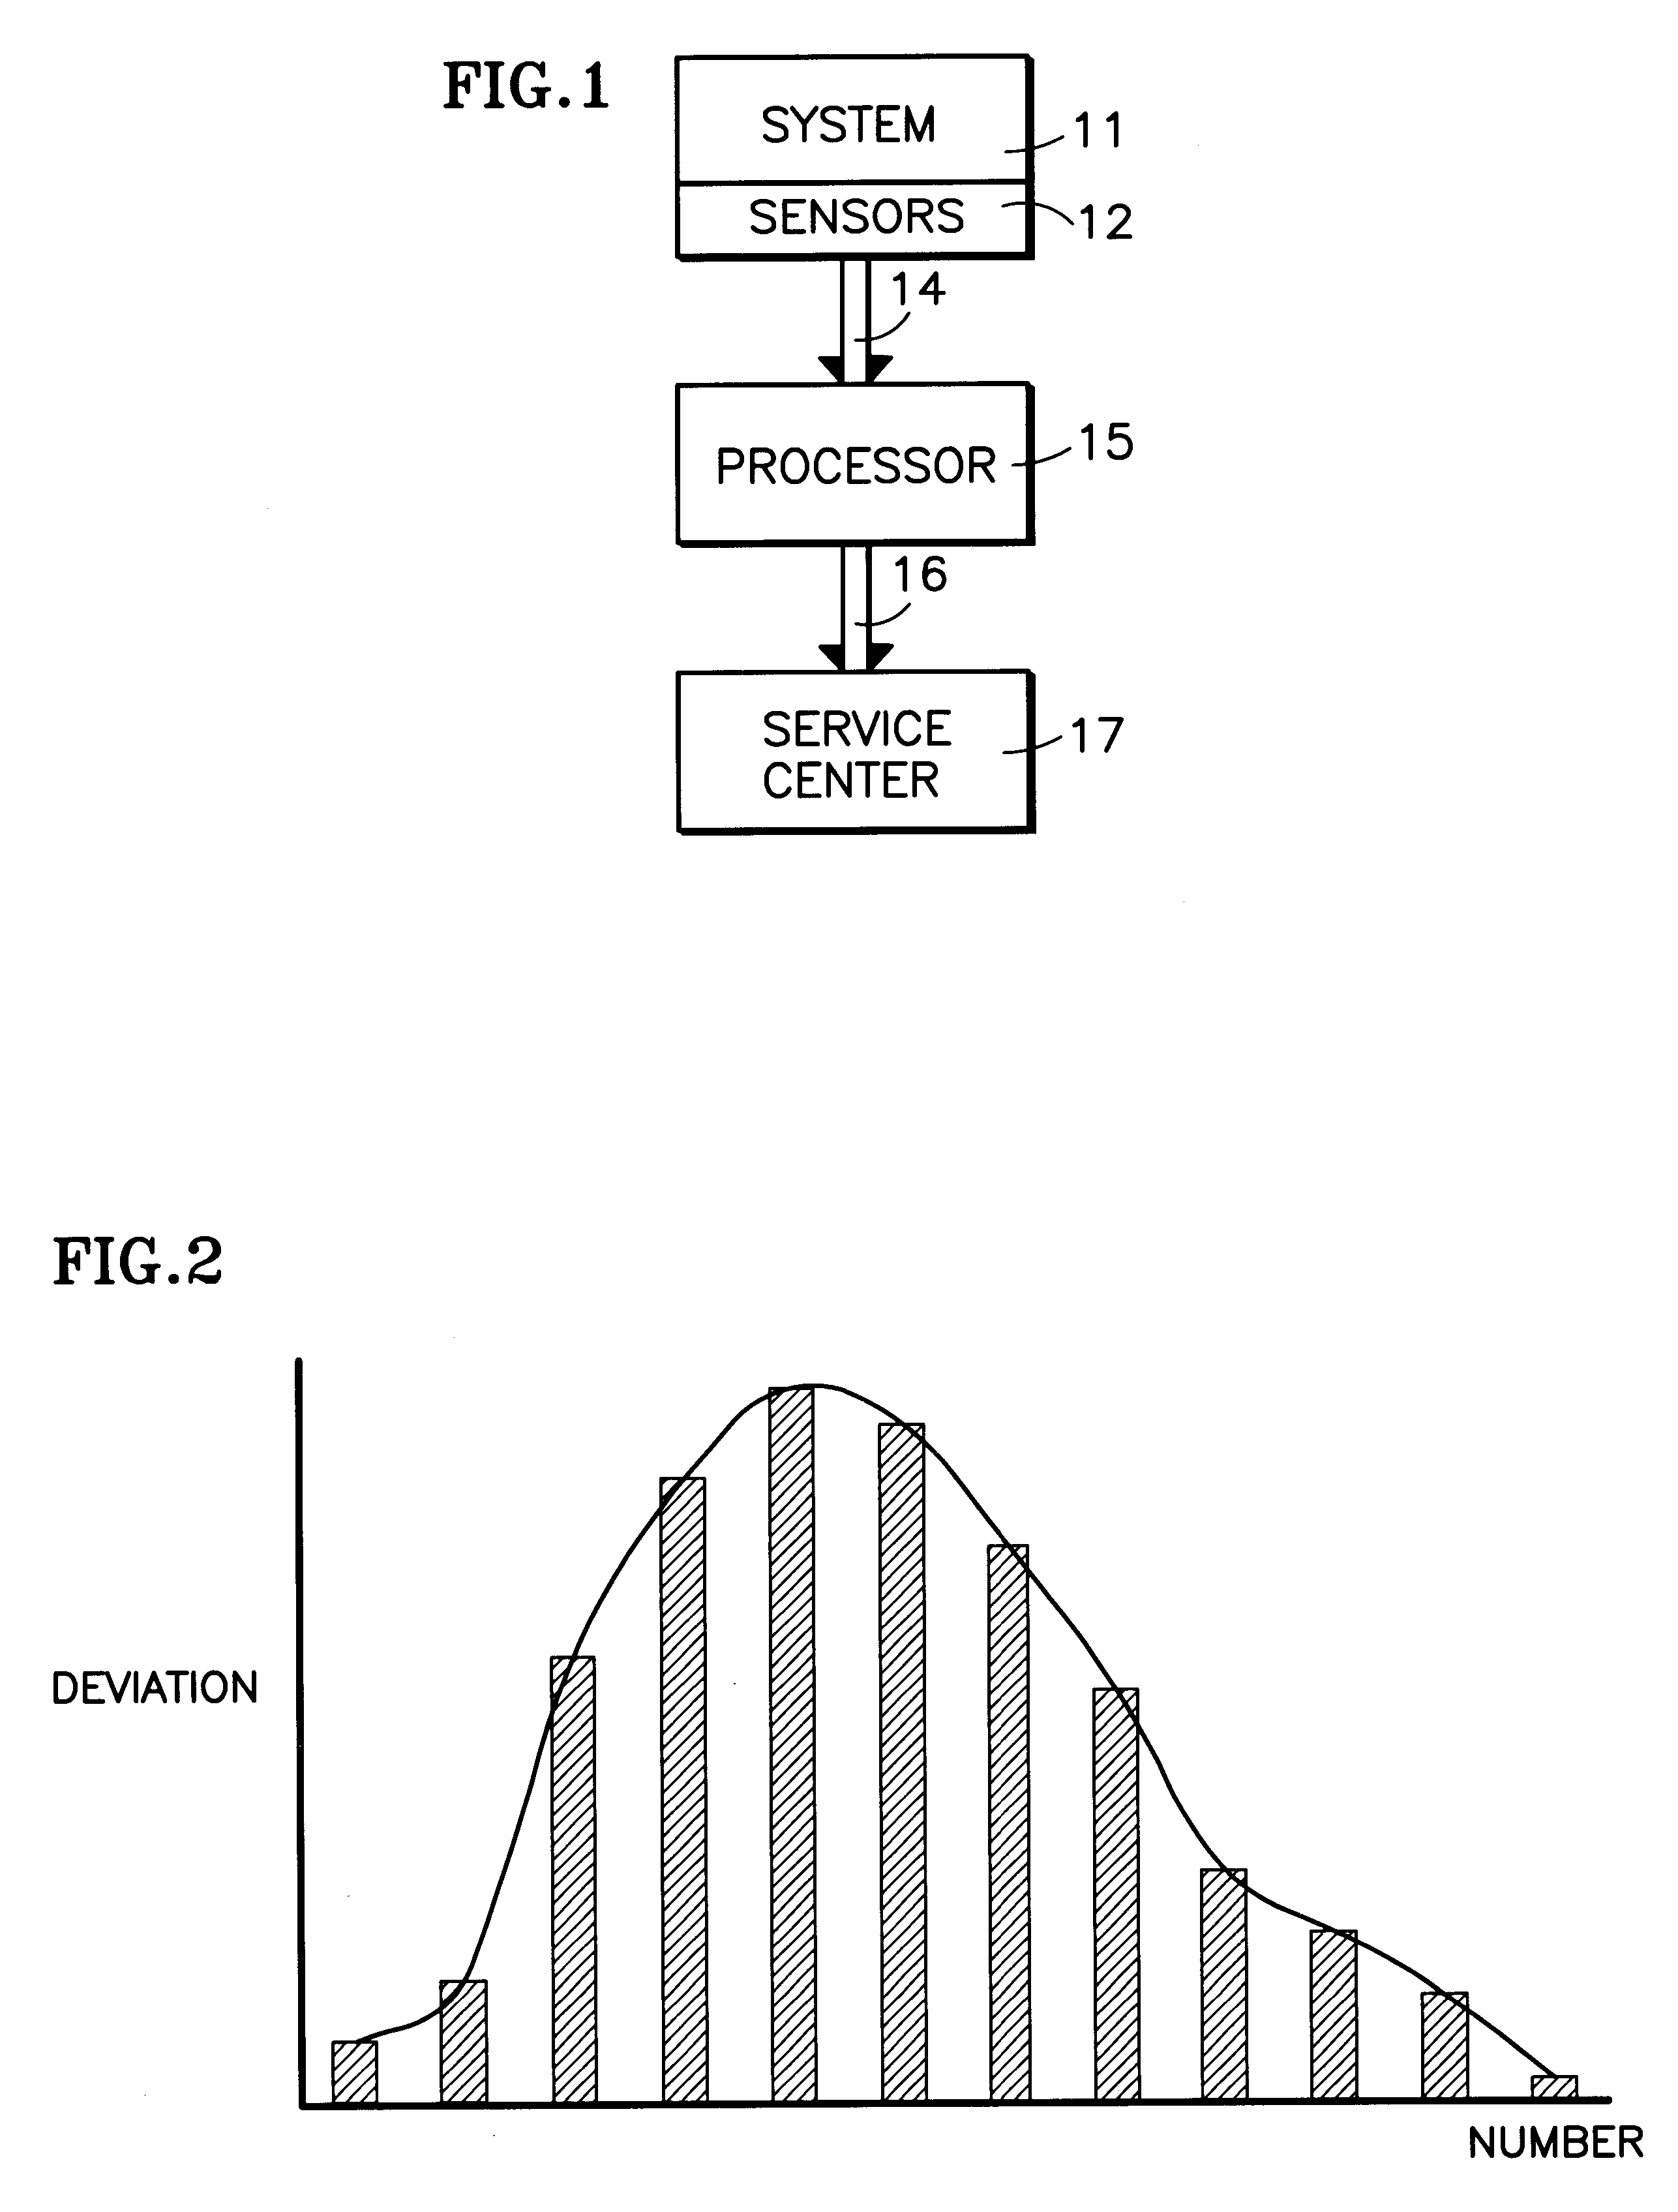
As an example only, in FIG. 1, a system 11 is fitted with a number of sensors 12, which in this embodiment is taken to be twenty-one sensors. The data from each of the sensors 12, provides suitably processed signals over a trunk of lines 14 to a mathematical processor 15, the output of which is applied on a trunk of lines 16 to a service center 17 to indicate notable prognostic or diagnostic information.

In addition to the stream of sensor data, a time stamp is associated with each group of sensor data. The discrete sensor data comprises a sequence of random vectors, X.sub.i (which for composition simplicity is hereinafter referred to simply as X.sub.i). Each vector indexed by a record number, one, two, three. . . , each having as values a 21-bit sensor status and a time stamp. The time stamp may typically be kept as minutes to the millisecond, or in any other conventional way.

As an initial consideration in determining how to monitor any particular sort of a system (such as an elevat...


PUM


Abstract

Sensors (12) attached to various parameters of a system (11), such as an elevator system or a chiller, provide values (14) of corresponding parameters which are utilized to build (15) an empirical distribution of the process, such as by means of bootstrapping methodology using a five-dimensional Markov chain model. In normal operation thereafter, the sensors are read periodically and in response to events, and an abnormality is determined by comparison of current information against the empirical distribution of the process. Deviations from normal behavior provide quantitative measure of system malfunction or abnormality; eliminating data from one or more sensors in each iteration of processing identifies one or more sensors associated with the abnormality. By utilizing cumulative distribution norm of deviation from normal behavior, the relative health of one system can be compared with the relative health of other, similar or dissimilar systems.

Description

This invention relates to monitoring machines or systems, such as elevators or chillers, using multiple sensor data, treated as a random sequence, to construct a stochastic process model of the machine or system, comprising an empirical distribution of the sequence of discrete data; comparison of empirical distribution of data acquired daily on-line with the base information of the stochastic process model provides quantitative and qualitative indicators of system health; use of a cumulative distribution norm, for each machine or system, allows relative comparison to other machines or systems.Conventional methods for detecting abnormal machine or system behavior typically use models to reconstruct the behavior from sensor data. Then a combination of schemes, based on knowledge of experts along with elementary statistical methods, are used to focus on what are deemed to be relevant features, looking for known troublesome patterns in the data. Such methodology suffers from an abundanc...

Claims


Application Information

Patent Timeline
IPC IPC(8): G05B23/02B66B3/00G06F11/30G06F17/18
CPCG06K9/6284G05B23/0254G06F18/2433
Inventor RADULOVIC, DRAGANLABARRE, ROBERT E.
Owner OTIS ELEVATOR CO
Why Eureka
Try Eureka