Business alliance identification in a web architecture framework

Inactive Publication Date: 2004-04-13
ACCENTURE GLOBAL SERVICES LTD
View PDF19 Cites 1046 Cited by
  • Summary
  • Abstract
  • Description
  • Claims
  • Application Information

AI Technical Summary

Benefits of technology

In many situations the Information Management team must make decisions that affect functional areas. To empower the Information Management team, the Application teams should include the Information Management team in relevant design discussions. This facilitates the validation of des

Problems solved by technology

Traditional graphs and charts, such as bar and pie charts, work well only for small amounts of information and are typically only useful for presenting statistical information.
Attempting to produce such graphs and charts for large amounts of information leads to presenting the information in such small increments, such as bars (in a bar chart) or wedges (in a pie chart), as to lead to confusion, not to mention the greatly reduced chance that a viewe

Method used


Image

  • Business alliance identification in a web architecture framework
  • Business alliance identification in a web architecture framework
  • Business alliance identification in a web architecture framework

Examples


Embodiment Construction

Links to all related documentation (datasheets, whitepapers)

Drills-down for additional detail

Integrates to centralized publishing for integrity

Downloads information

Tracks downloads for proactive notification (spec updates)

As shown in FIG. 66, operation 1502 outputs data relating to at least one of the products and services. Such data may include details of the products or services as well as specifications. The data and comparisons may be accessed through linking of pages containing the data with linkable pictures and text. For example, a more detailed picture of a particular product illustrating its most salient features may be linked to a smaller or more generic picture of the product on a page displaying various similar products. More links may be used on the page displaying the data to obtain additional detail. Optionally, the data may be integrated to centralized publishing for integrity. In such case, updated data would be downloaded to ensure the correctness and currentness o...


PUM


Abstract

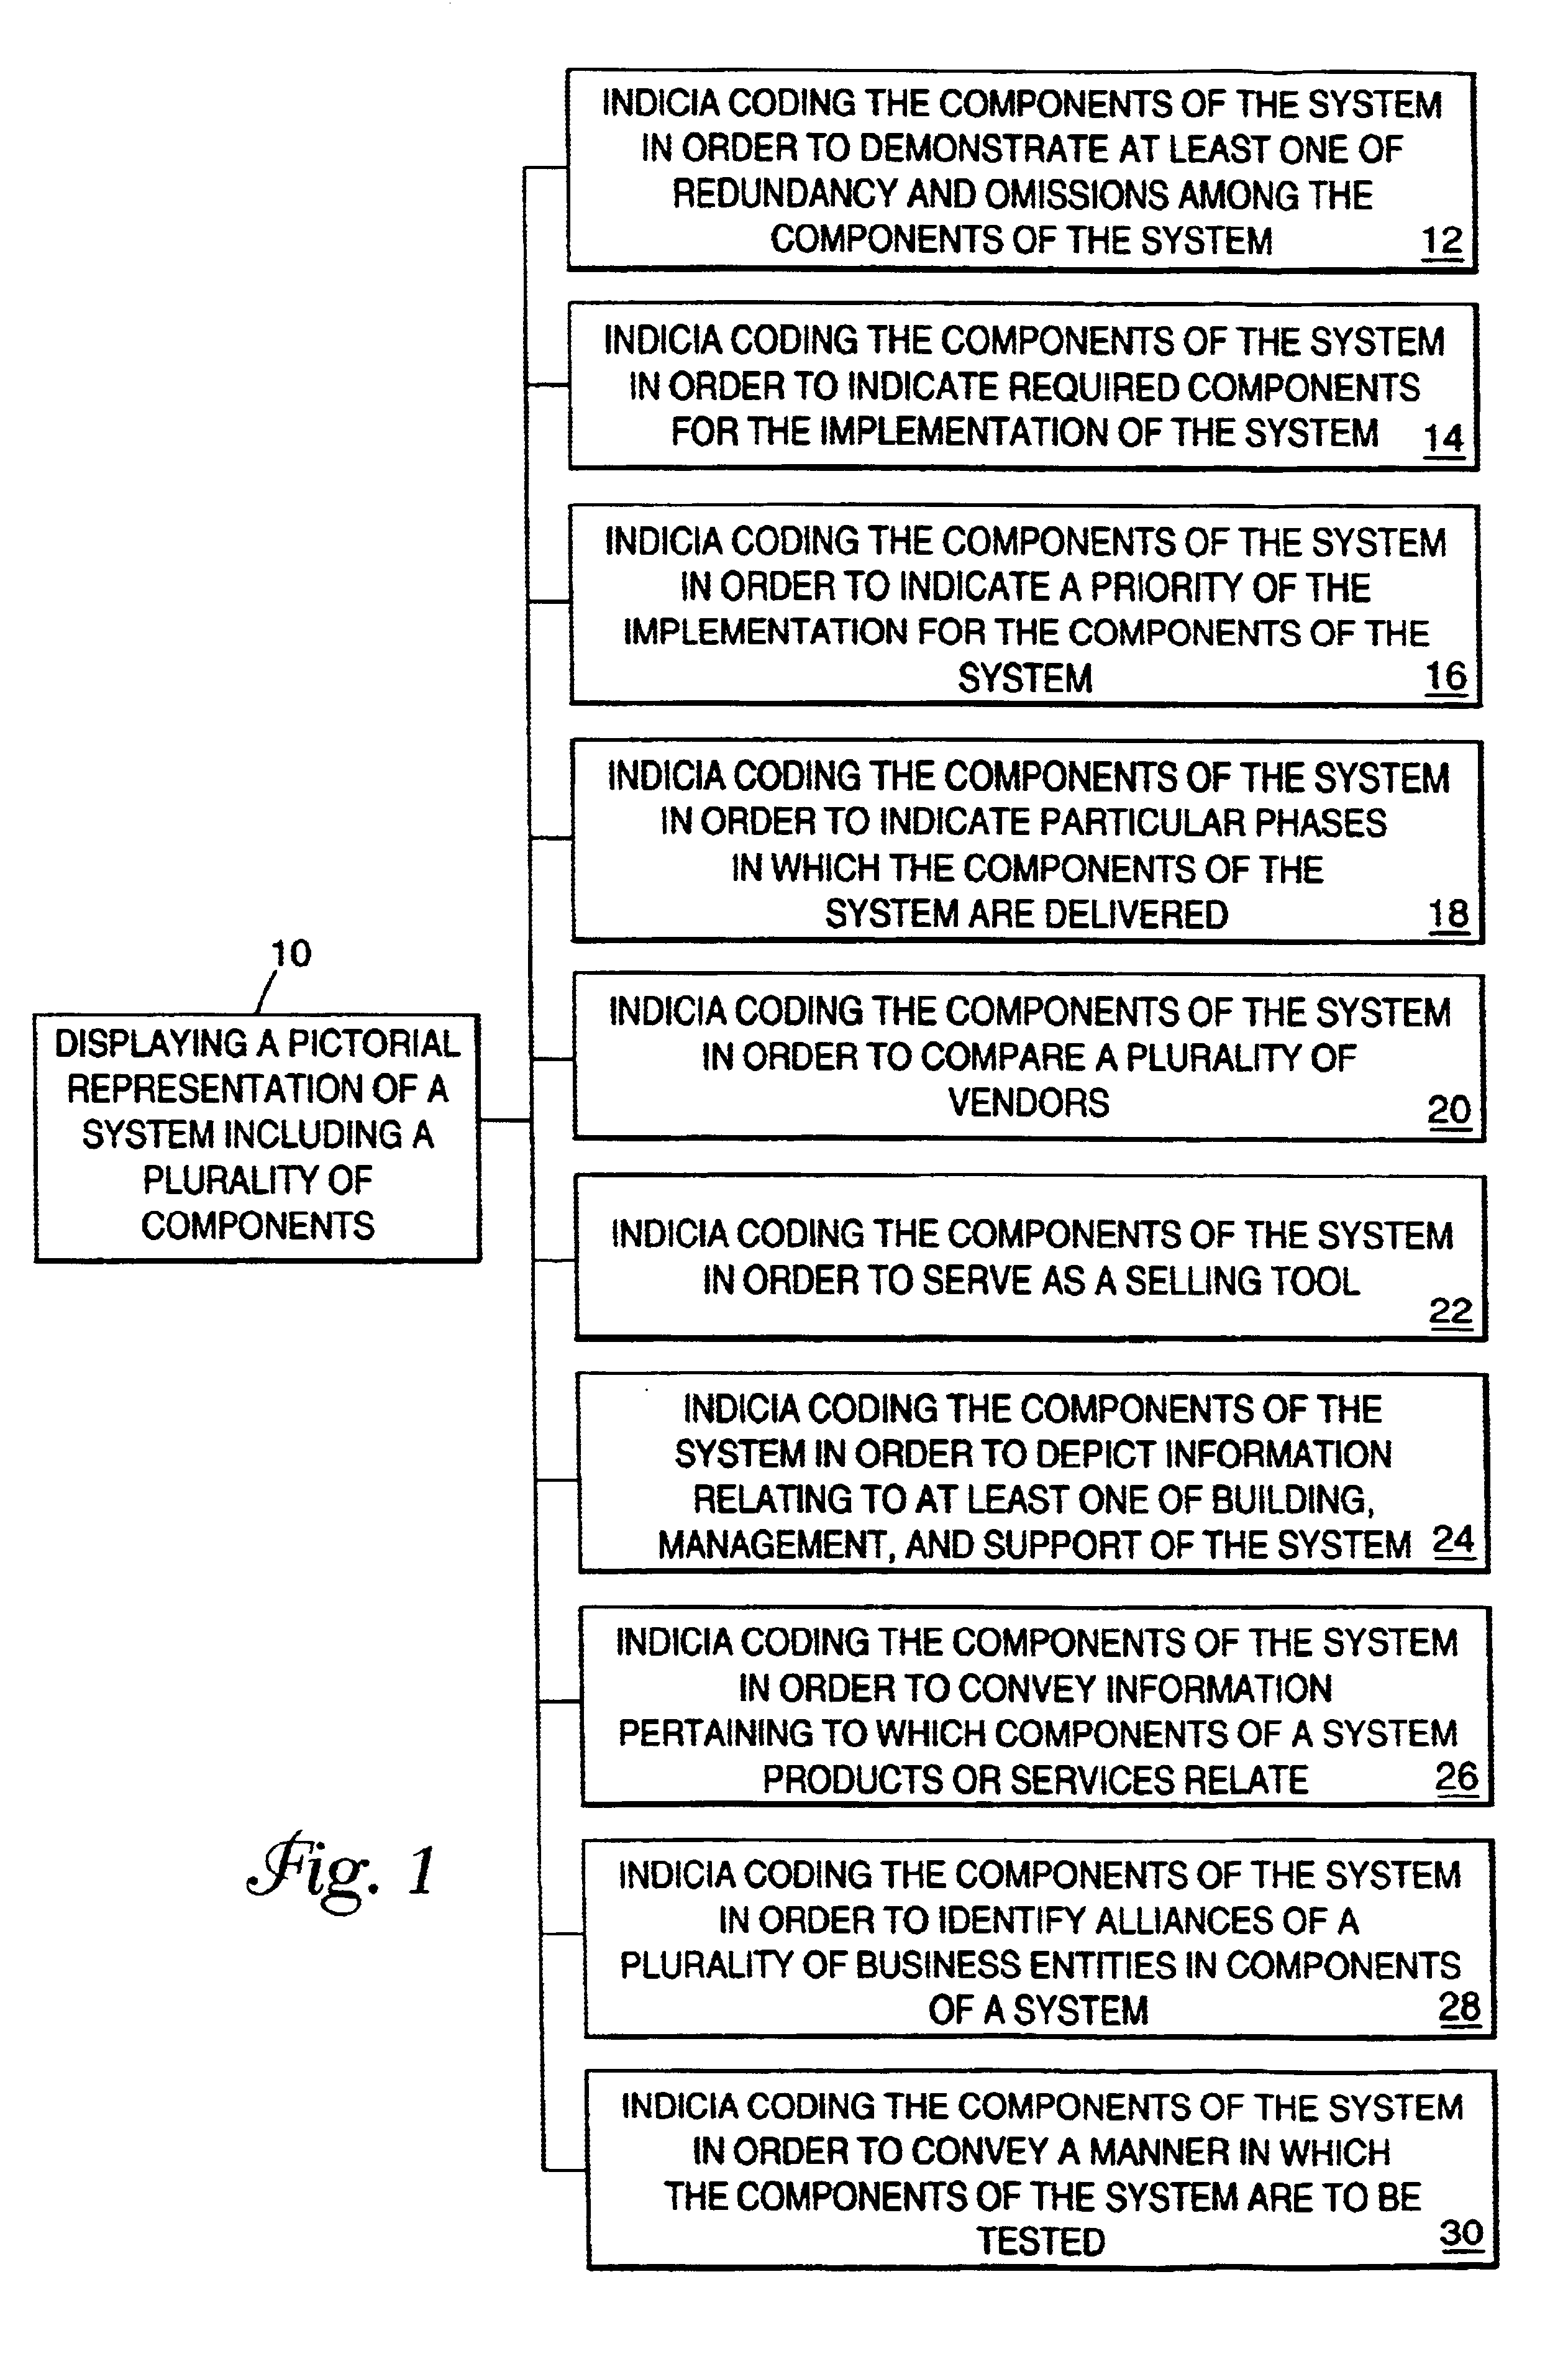
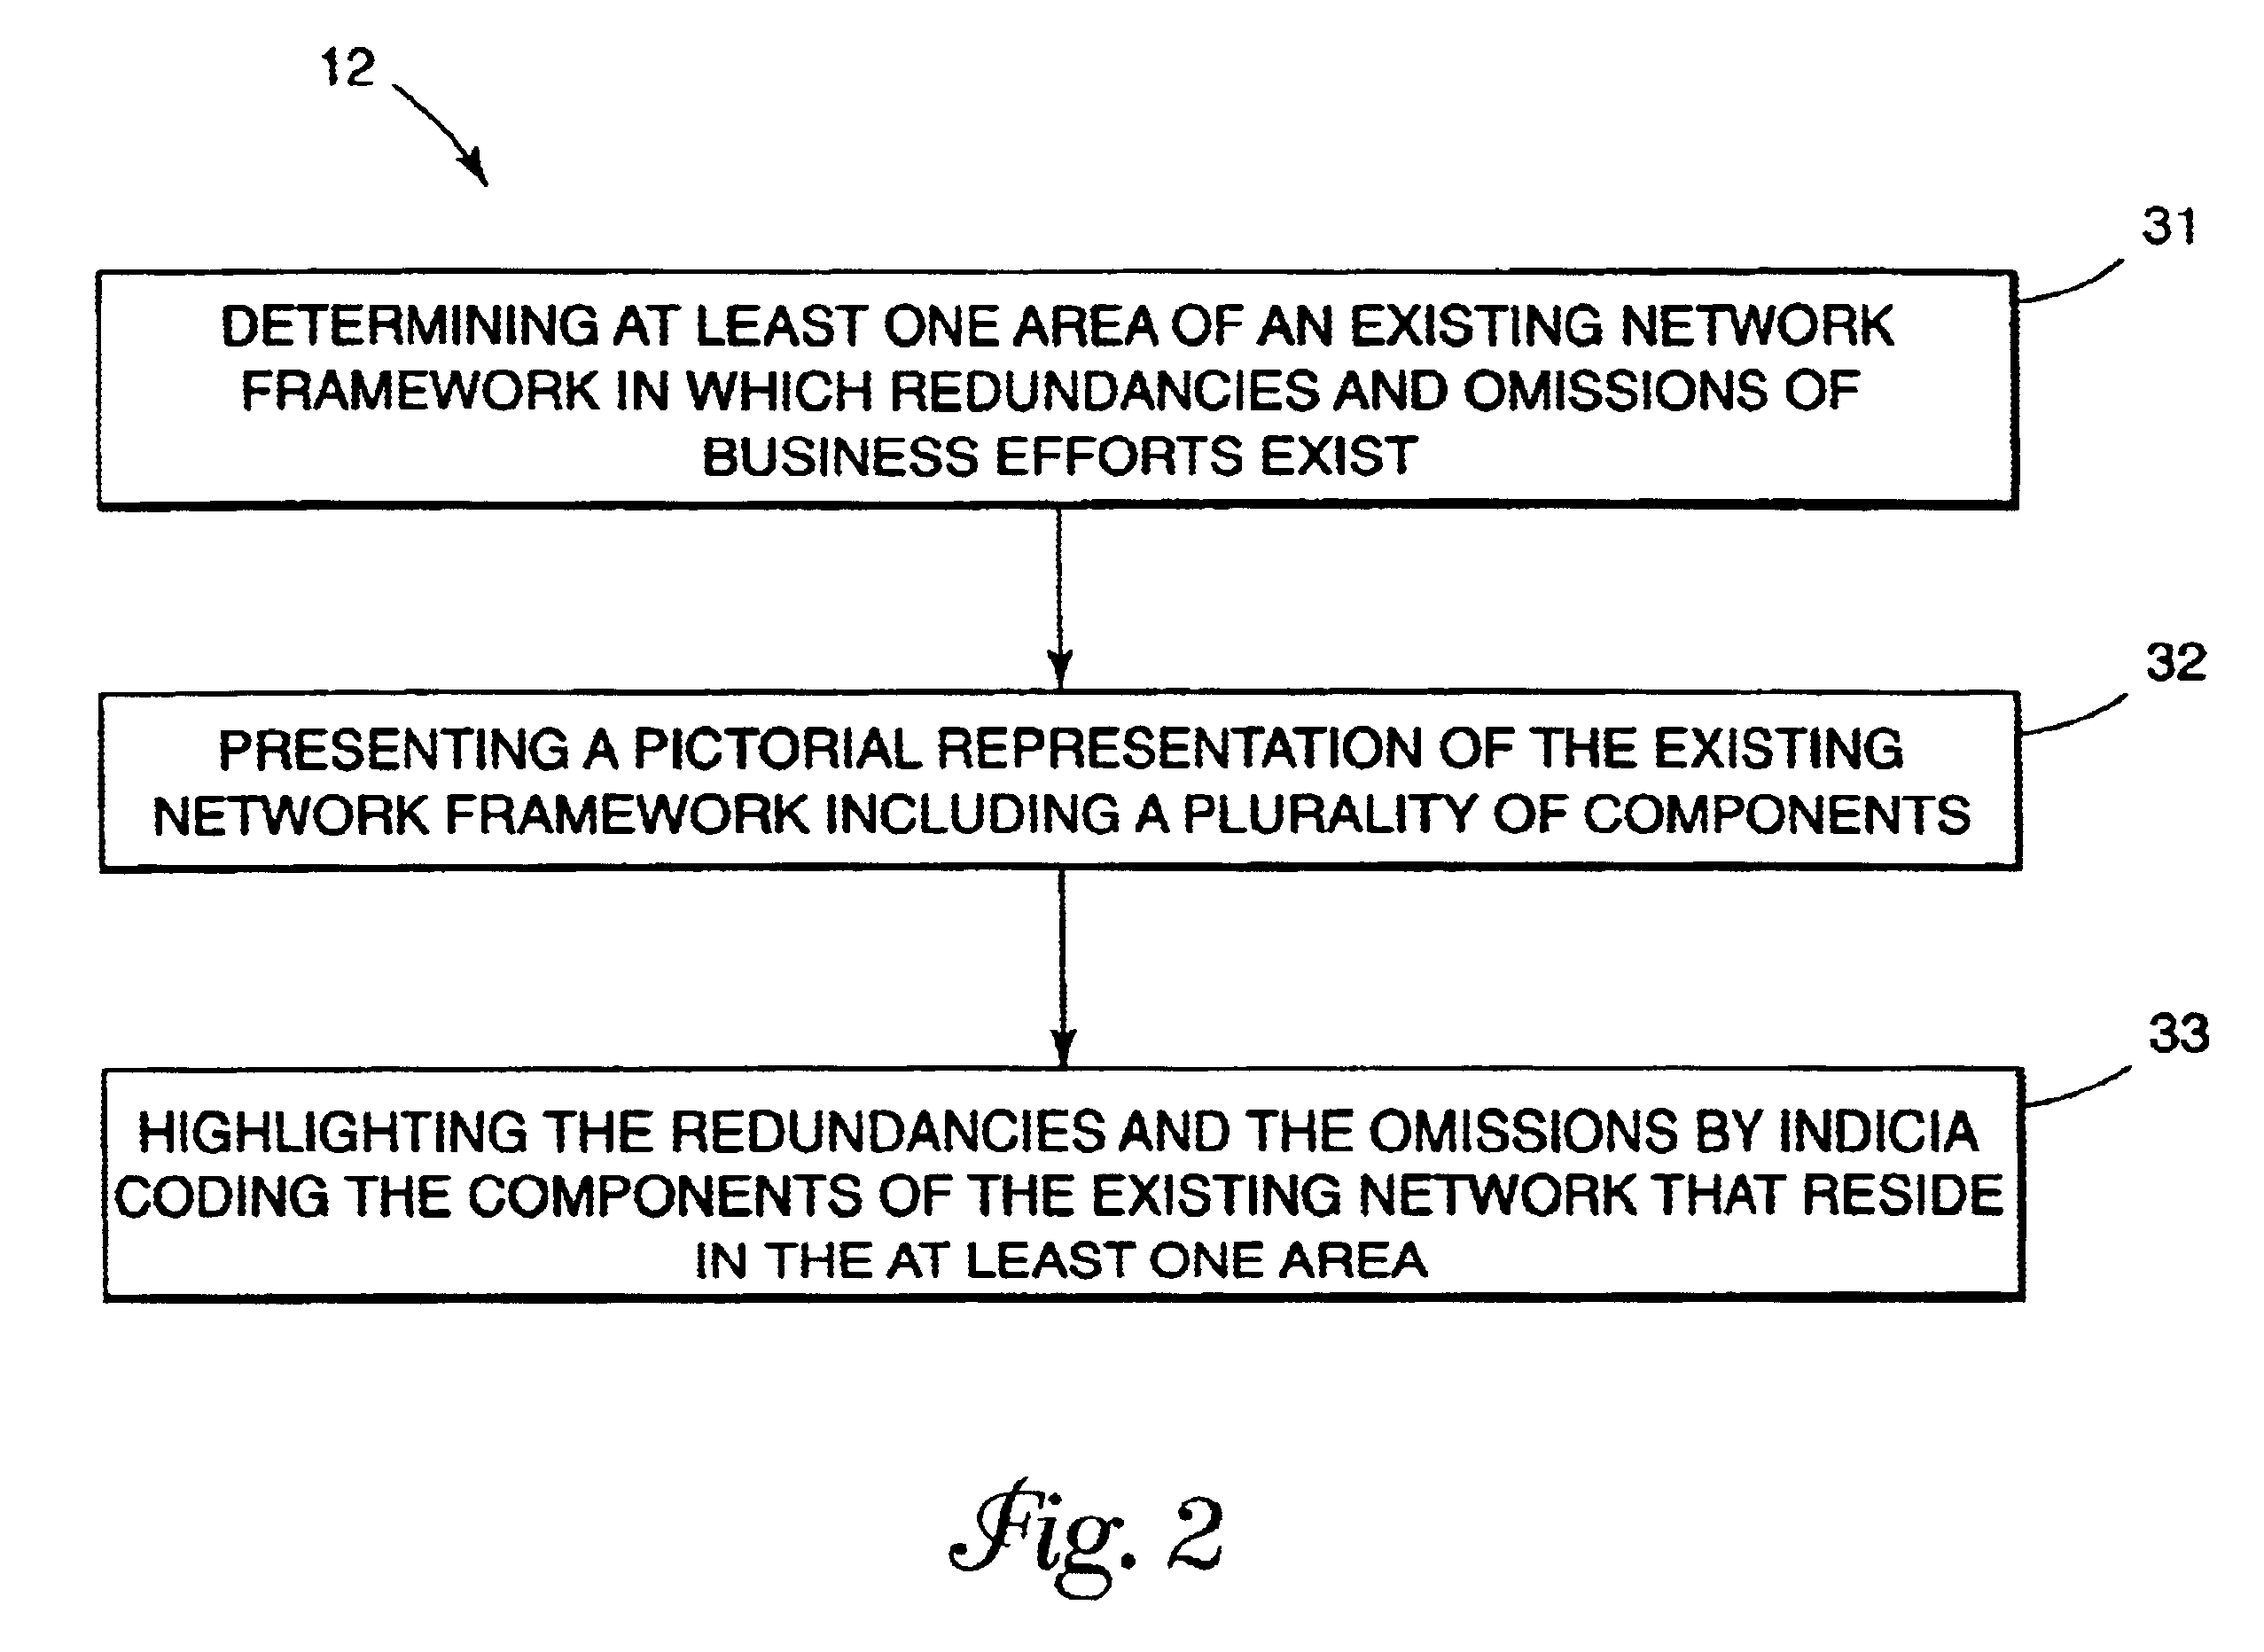
A system, method and article of manufacture are provided for identifying alliances among a plurality of business entities in components of a network framework. First, alliances are identified among a plurality of business entities in terms of components of a current network framework. Next, a pictorial representation is displayed of the current network framework and the components. The alliances are then conveyed by indicia coding the components of the current network framework in which the alliances exist.

Description

The present invention relates to conveying information regarding a web architecture framework and more particularly to identifying alliances of various business entities in a system.It is common in presentations and the like to present and convey information through graphic representations. These representations may take a variety of forms, such as alphanumeric characters, various sorts of graphs, as well as images of physical objects rendered on various mediums such as a computer display, paper product, transparency, etc. For example, various graphics such as line graphs, bar charts and pie charts have been quite popular in the presentation of business data such as sales, budgets and the like.Typically, a person can absorb and manipulate information placed in a visual or graphical context much faster than if the same information is represented merely by alphanumeric text or conveyed verbally. The person is also much more likely to retain that information. However, a balance must be...

Claims


Application Information

Patent Timeline
IPC IPC(8): G06F17/00G06Q99/00
CPCG06Q50/01G06Q99/00
Inventor GUHEEN, MICHAEL F.MITCHELL, JAMES D.BARRESE, JAMES J.
Owner ACCENTURE GLOBAL SERVICES LTD
Why Eureka
Try Eureka