

Interactive generation of graphical visualizations of large data structures
a technology of large data structure and interactive generation, which is applied in the field of database information visualization methods and systems, can solve the problems of unable to allow interactive browsing of the available space of visualizations by adjusting a limited number of parameters, and create challenges for extracting meaningful information from large data sets, etc., and achieve the effect of improving the flexibility of the described visualization process
- Summary
- Abstract
- Description
- Claims
- Application Information
AI Technical Summary
Benefits of technology
Problems solved by technology
Method used
Image

Examples
Embodiment Construction
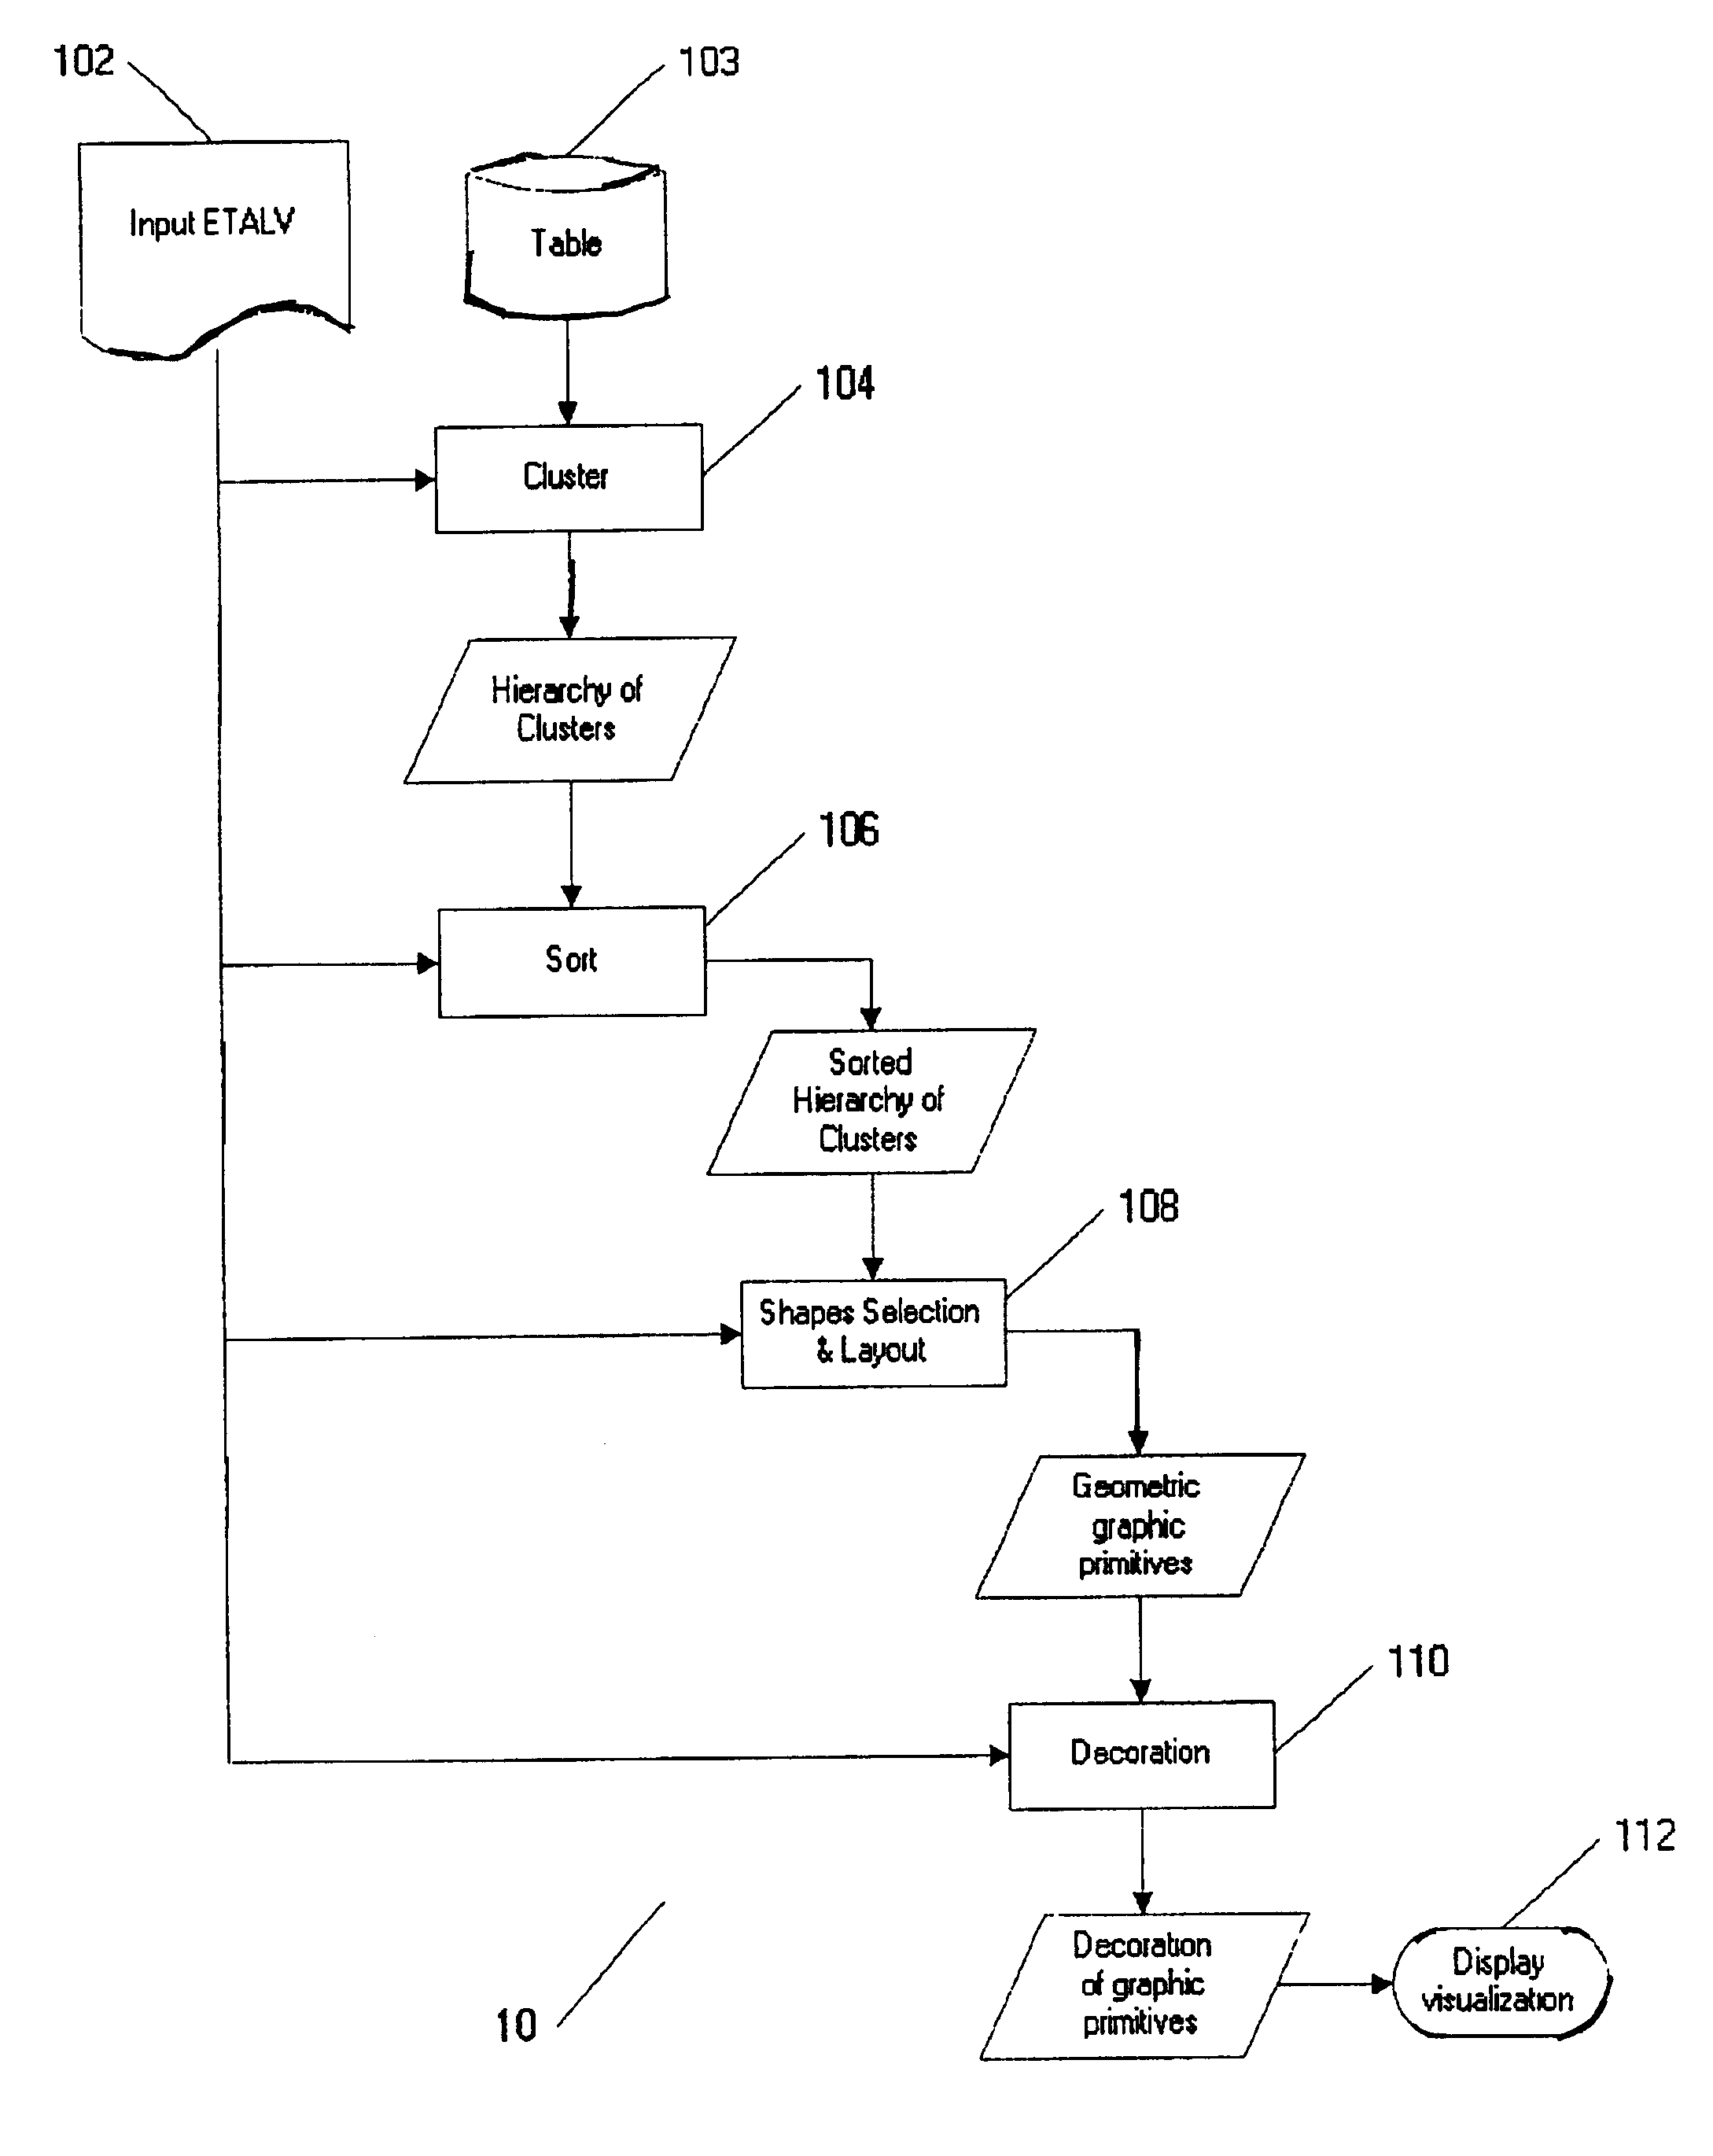
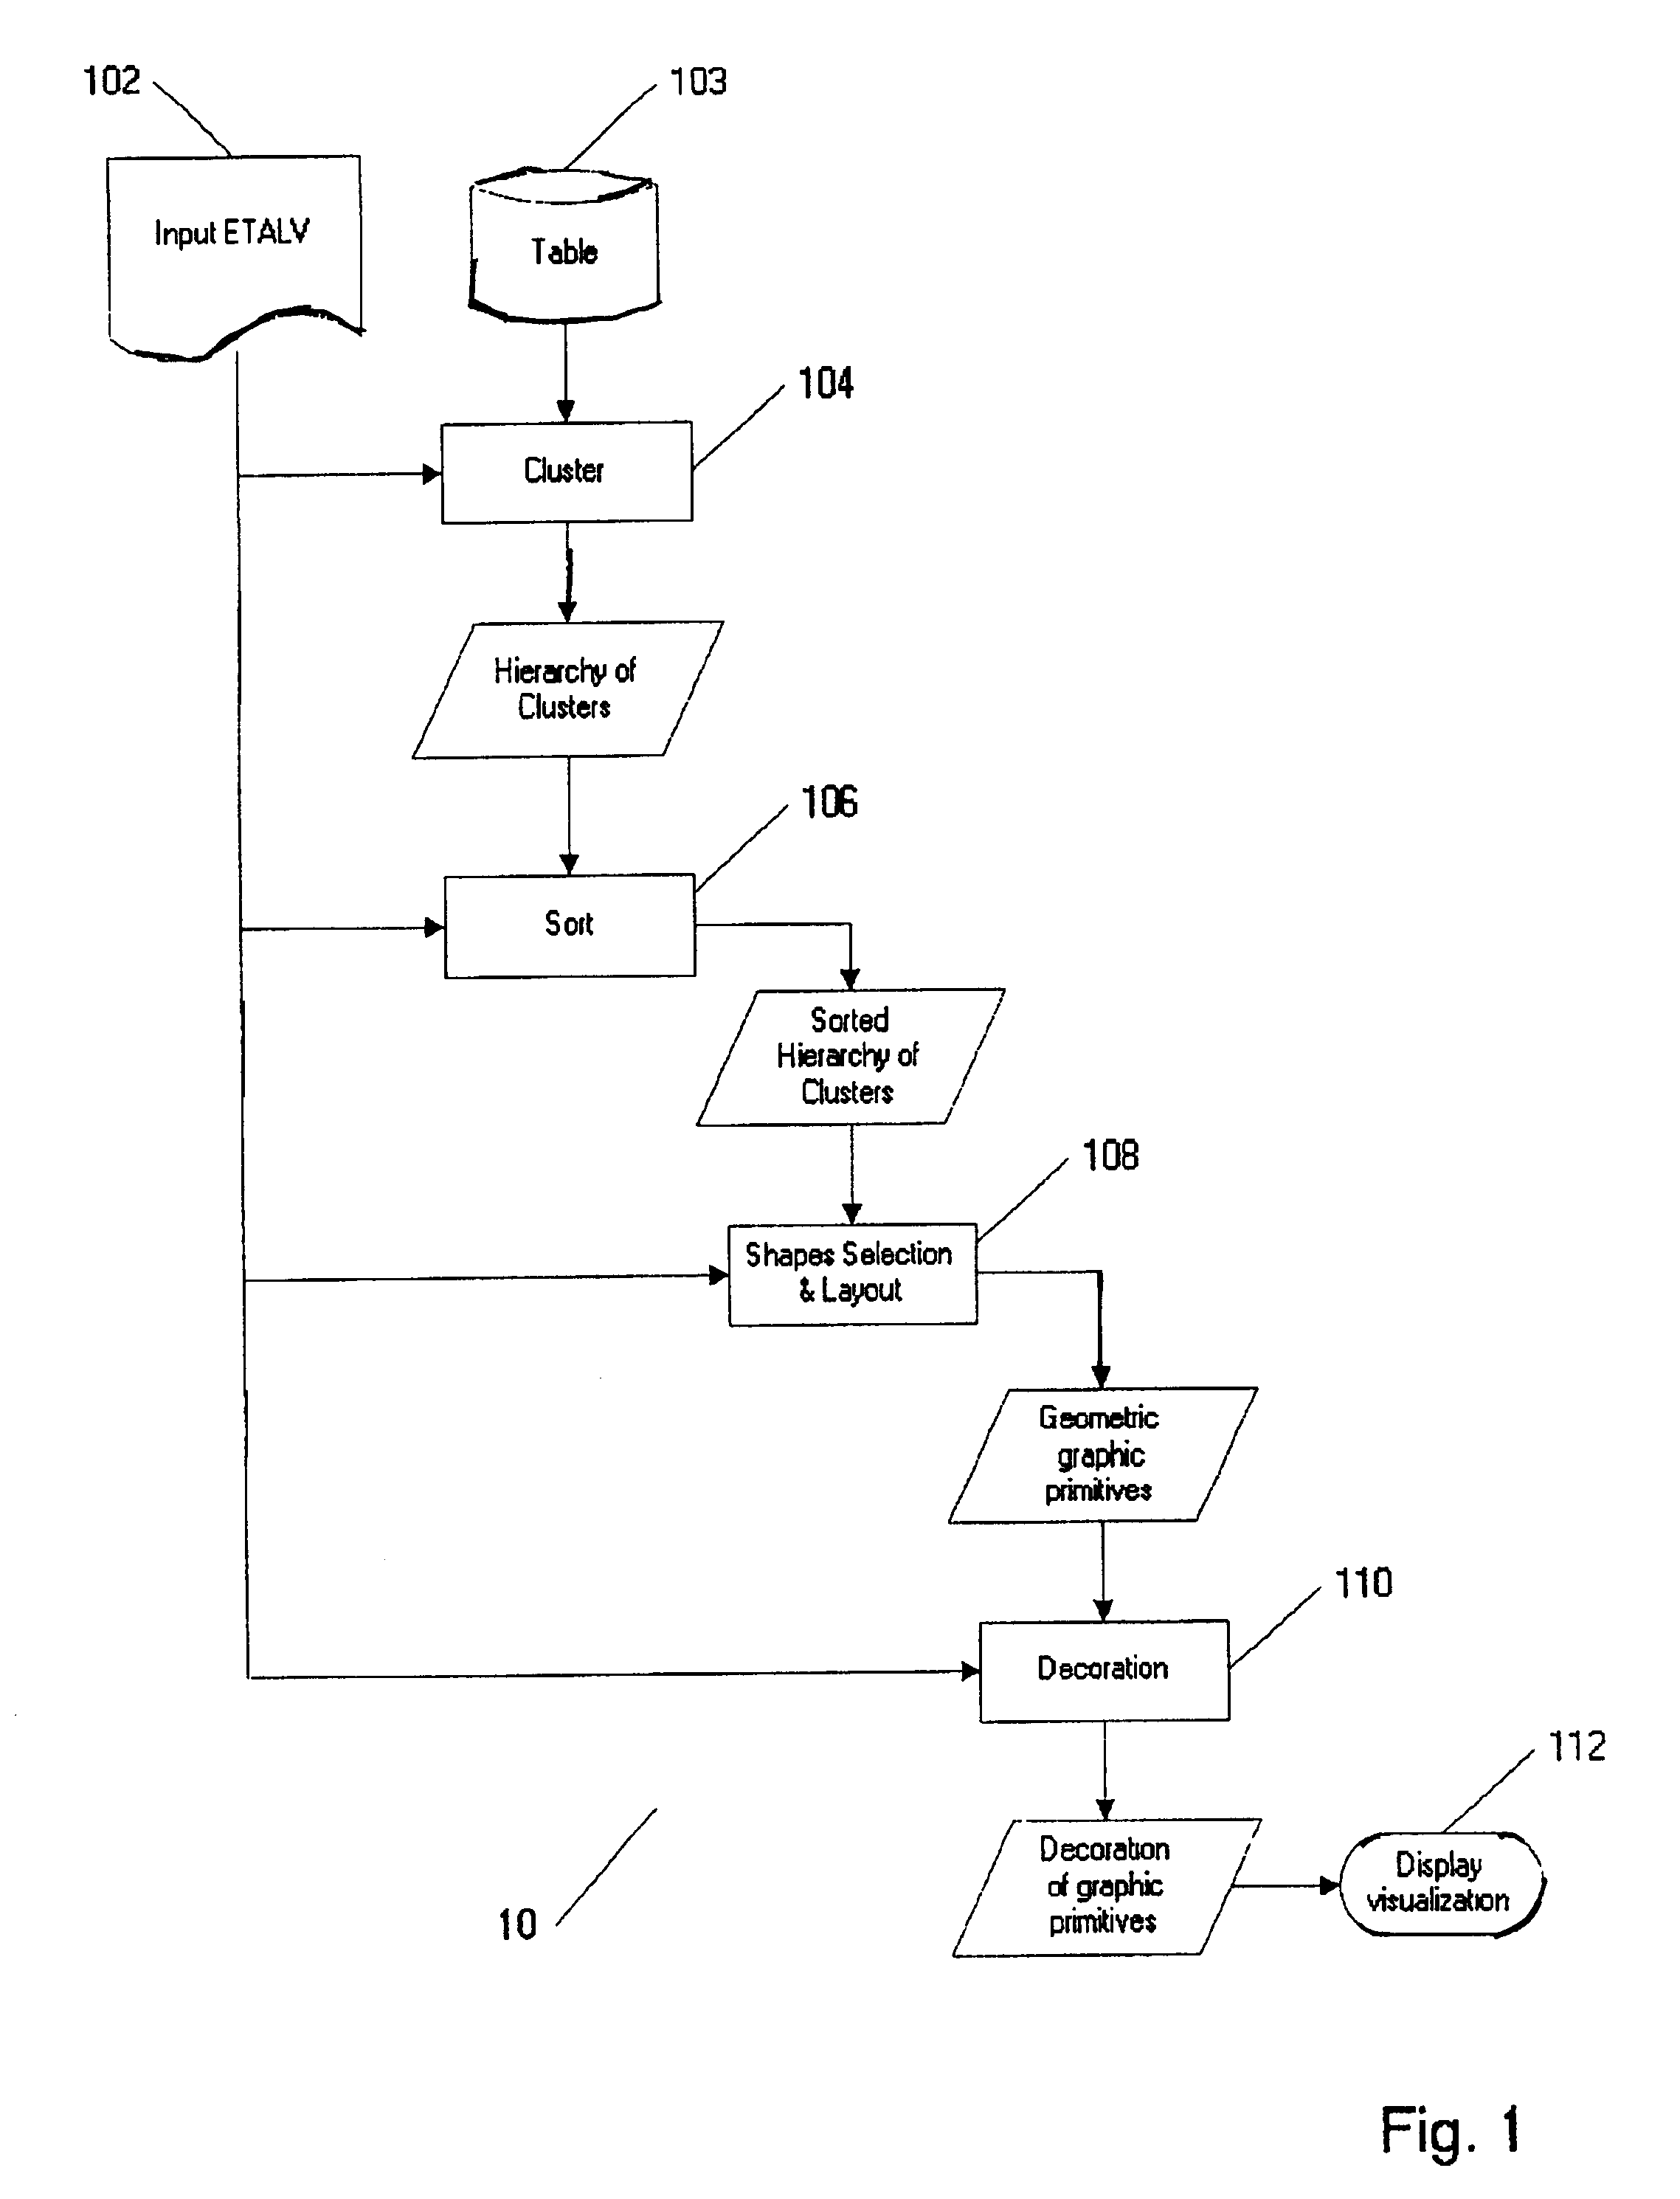
[0020]A method and computer-executable program is described for graphically rendering information of a database which can be arranged in form of a table, and for extraction associations between database records. An element and / or an arithmetic expression computed from the records in the database can be associated with a graphic representation consisting of instructions, such as setting a fill color, drawing a rectangle, and so on. The proposed visualization-rendering method is computationally fast, since at most O(N) graphic instructions need to be generated for a database of N records.
[0021]The following exemplary definitions refer to terminology used throughout the specification:[0022]Data Table—a data set organized in a matrix of rows and columns. The columns are referred to as attributes of the data set. Each column can have a header, a type, and additional properties, such as the format in which the data is stored and whether the column is to be cumulated or averaged when a set...
PUM
 Abstract
Description
Claims
Application Information