Animal models and methods for sepsis

a sepsis and animal model technology, applied in the field of animal models of sepsis, can solve the problems of death as an endpoint model, study takes longer than, and substantial amount of money and time gon

Inactive Publication Date: 2005-11-15
XENOGEN CORP
View PDF12 Cites 16 Cited by
  • Summary
  • Abstract
  • Description
  • Claims
  • Application Information

AI Technical Summary

Benefits of technology

[0022]The experiment also includes a method of predicting an expected time of death of an experimental animal in a model system of sepsis. The method includes the steps of (i) selecting a model system of sepsis, which model system comprises an animal species and a pathogen species capable of causing sepsis, and in which model system a correlation between actual time of death and a function of the rate of pathogen load increase has been established; (ii) infecting an experimental animal of the animal species with a reporter-labeled pathogen of the pathogen species; (iii) measuring the level of the reporter in the experimental animal at the selected time; and (iv) predicting the expected time of death from the level of the reporter and the correlation.

Problems solved by technology

Accordingly, a substantial amount of money and time has gone into the search for drugs effective to treat sepsis and / or eliminate the pathogens (e.g., bacteria) which cause sepsis.
For example, because the investigator must wait until animals die before useful data may be obtained from the study, the study takes longer than it would if such data could be obtained at a time before death of the animals.
From an animal welfare standpoint, death-as-an-endpoint models are disadvantageous because the animals die directly from the disease or toxic compounds under study, and are thus more likely to suffer as compared with animals that are euthanized by humane means earlier in the study.

Method used


Image

  • Animal models and methods for sepsis
  • Animal models and methods for sepsis
  • Animal models and methods for sepsis

Examples


example 1

Development of Septicemia

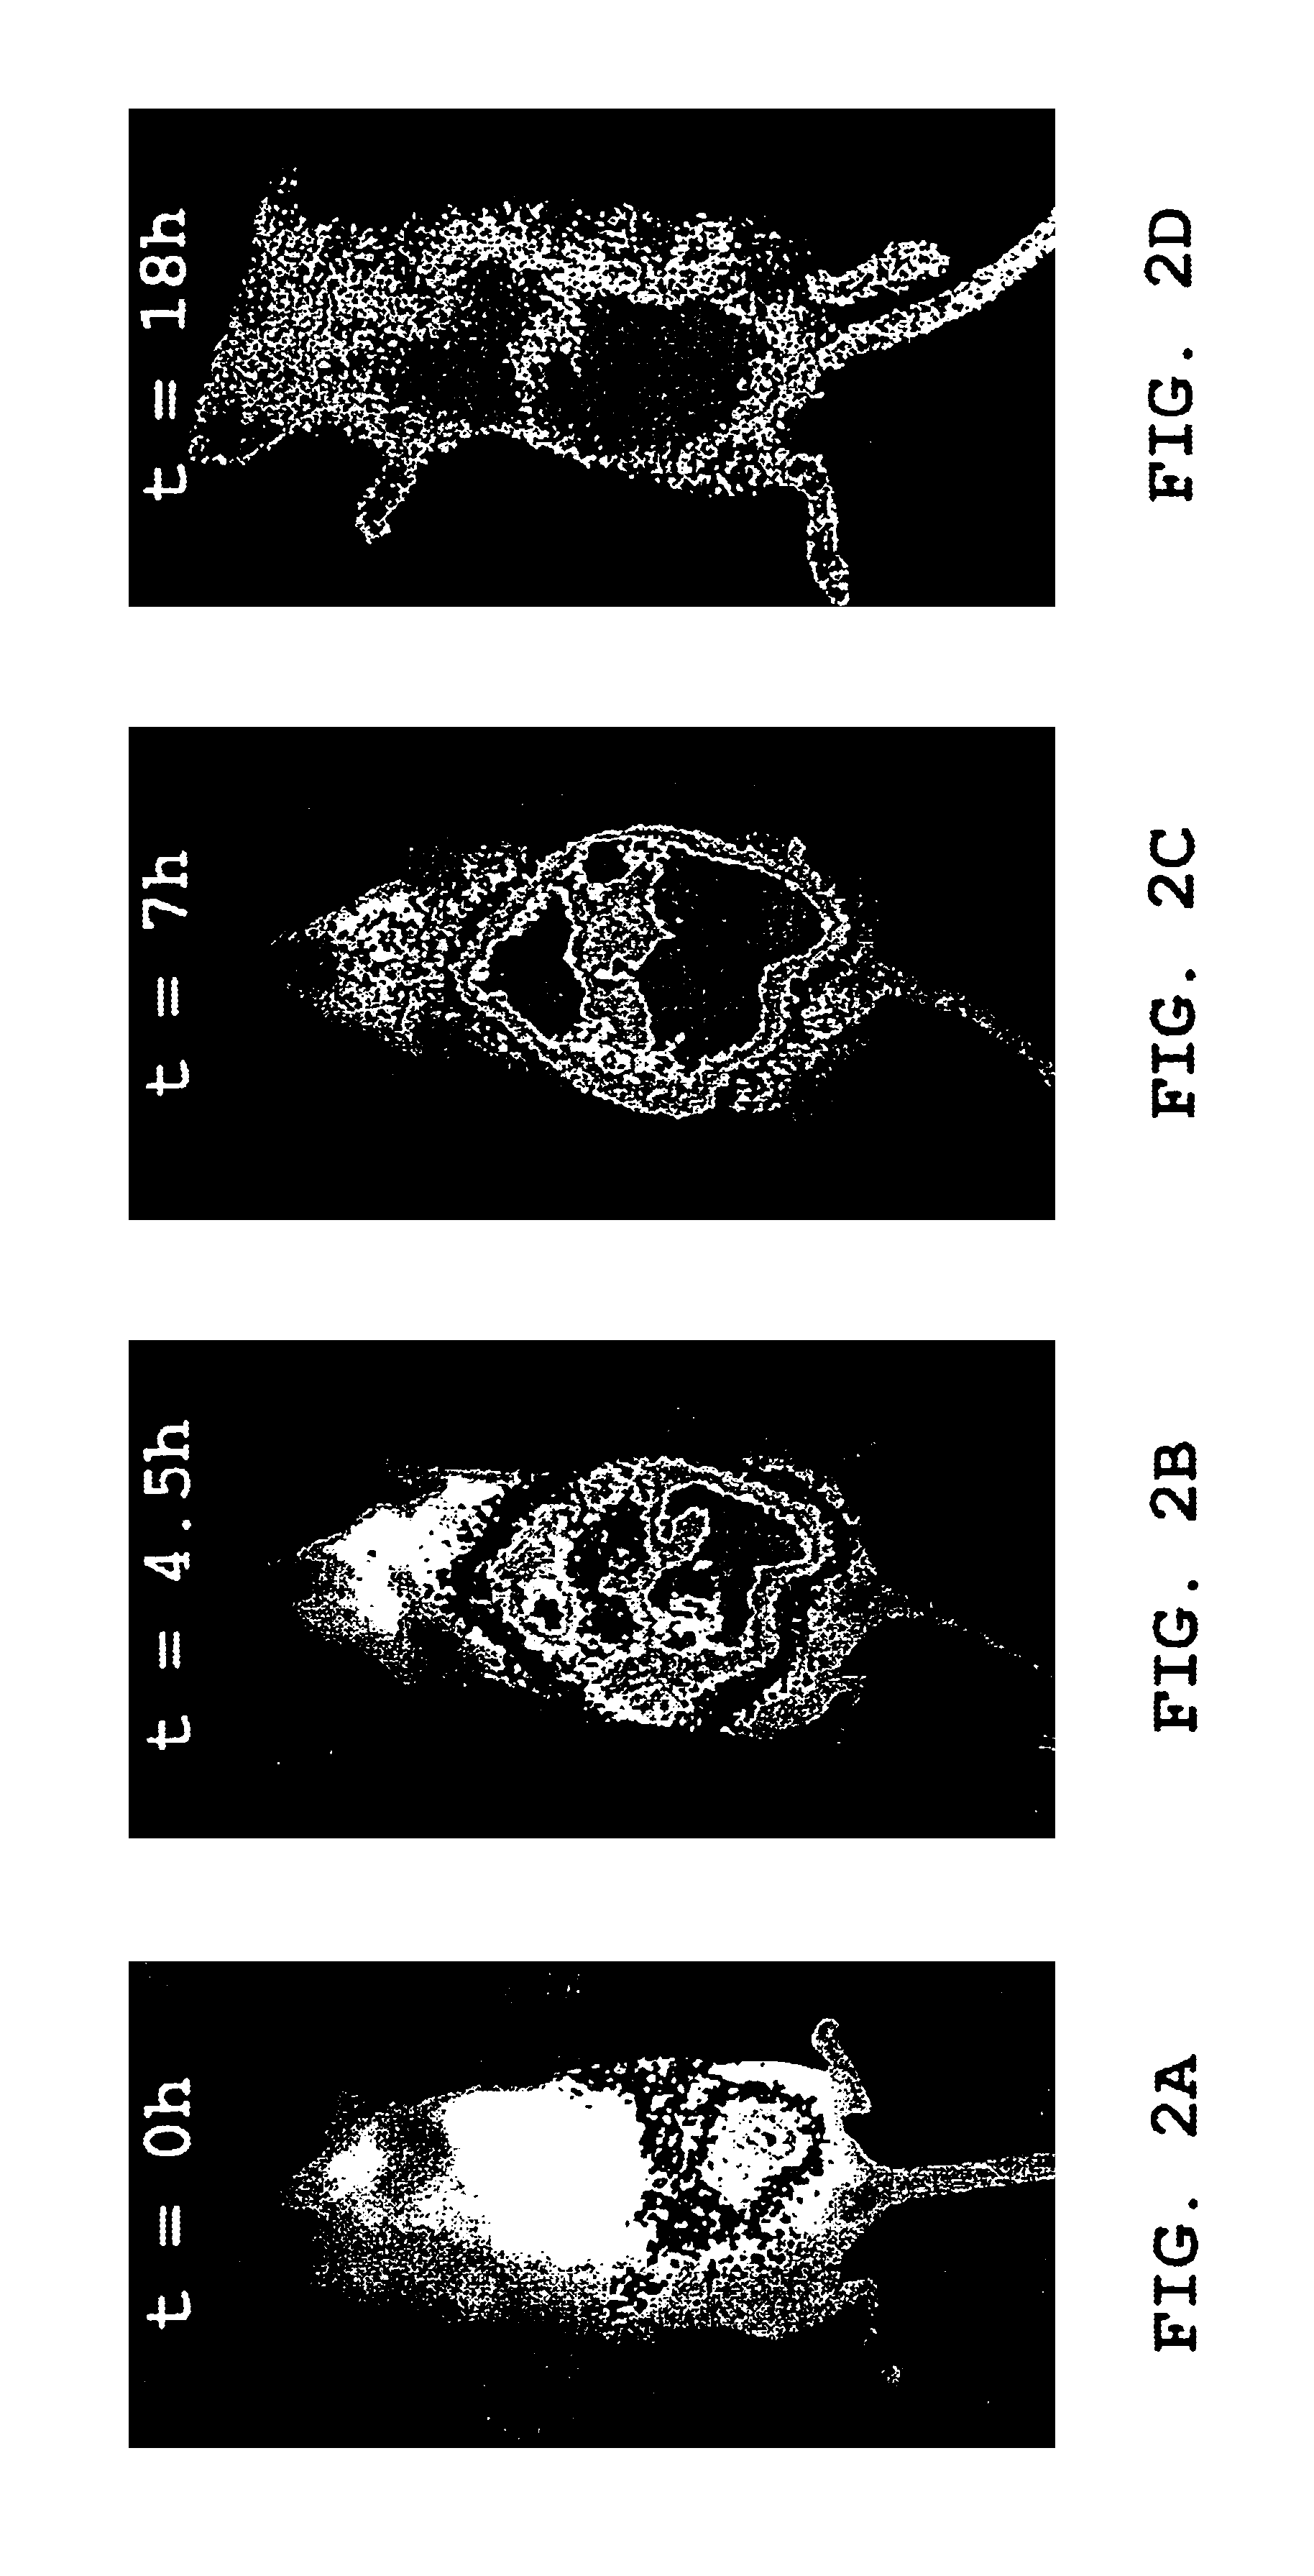
[0129]Female Balb / c mice (10-12 weeks old), anesthetized as described above, were injected intraperitoneally (i.p.) with 1×10⁶ luminescent 2-11 lux P. aeruginosa bacteria suspended in a total volume of 0.25 ml, and imaged at selected times as described above. Exemplary images are shown in FIGS. 2A, 2B, 2C and 2D. FIGS. 2A, 2B and 2C are images from one of the mice, taken at t=0, 4.5 and 7 hours, respectively. FIG. 2D is an image of another (similarly-infected) mouse taken at 18 hours. The relative intensity of photon counts is shown in pseudocolor in both images, and is superimposed over a grayscale reflected light image of the mouse in FIGS. 2A, 2B and 2C.

example 2

Signal Increase with Time in Mice Infected with 2-11 lux

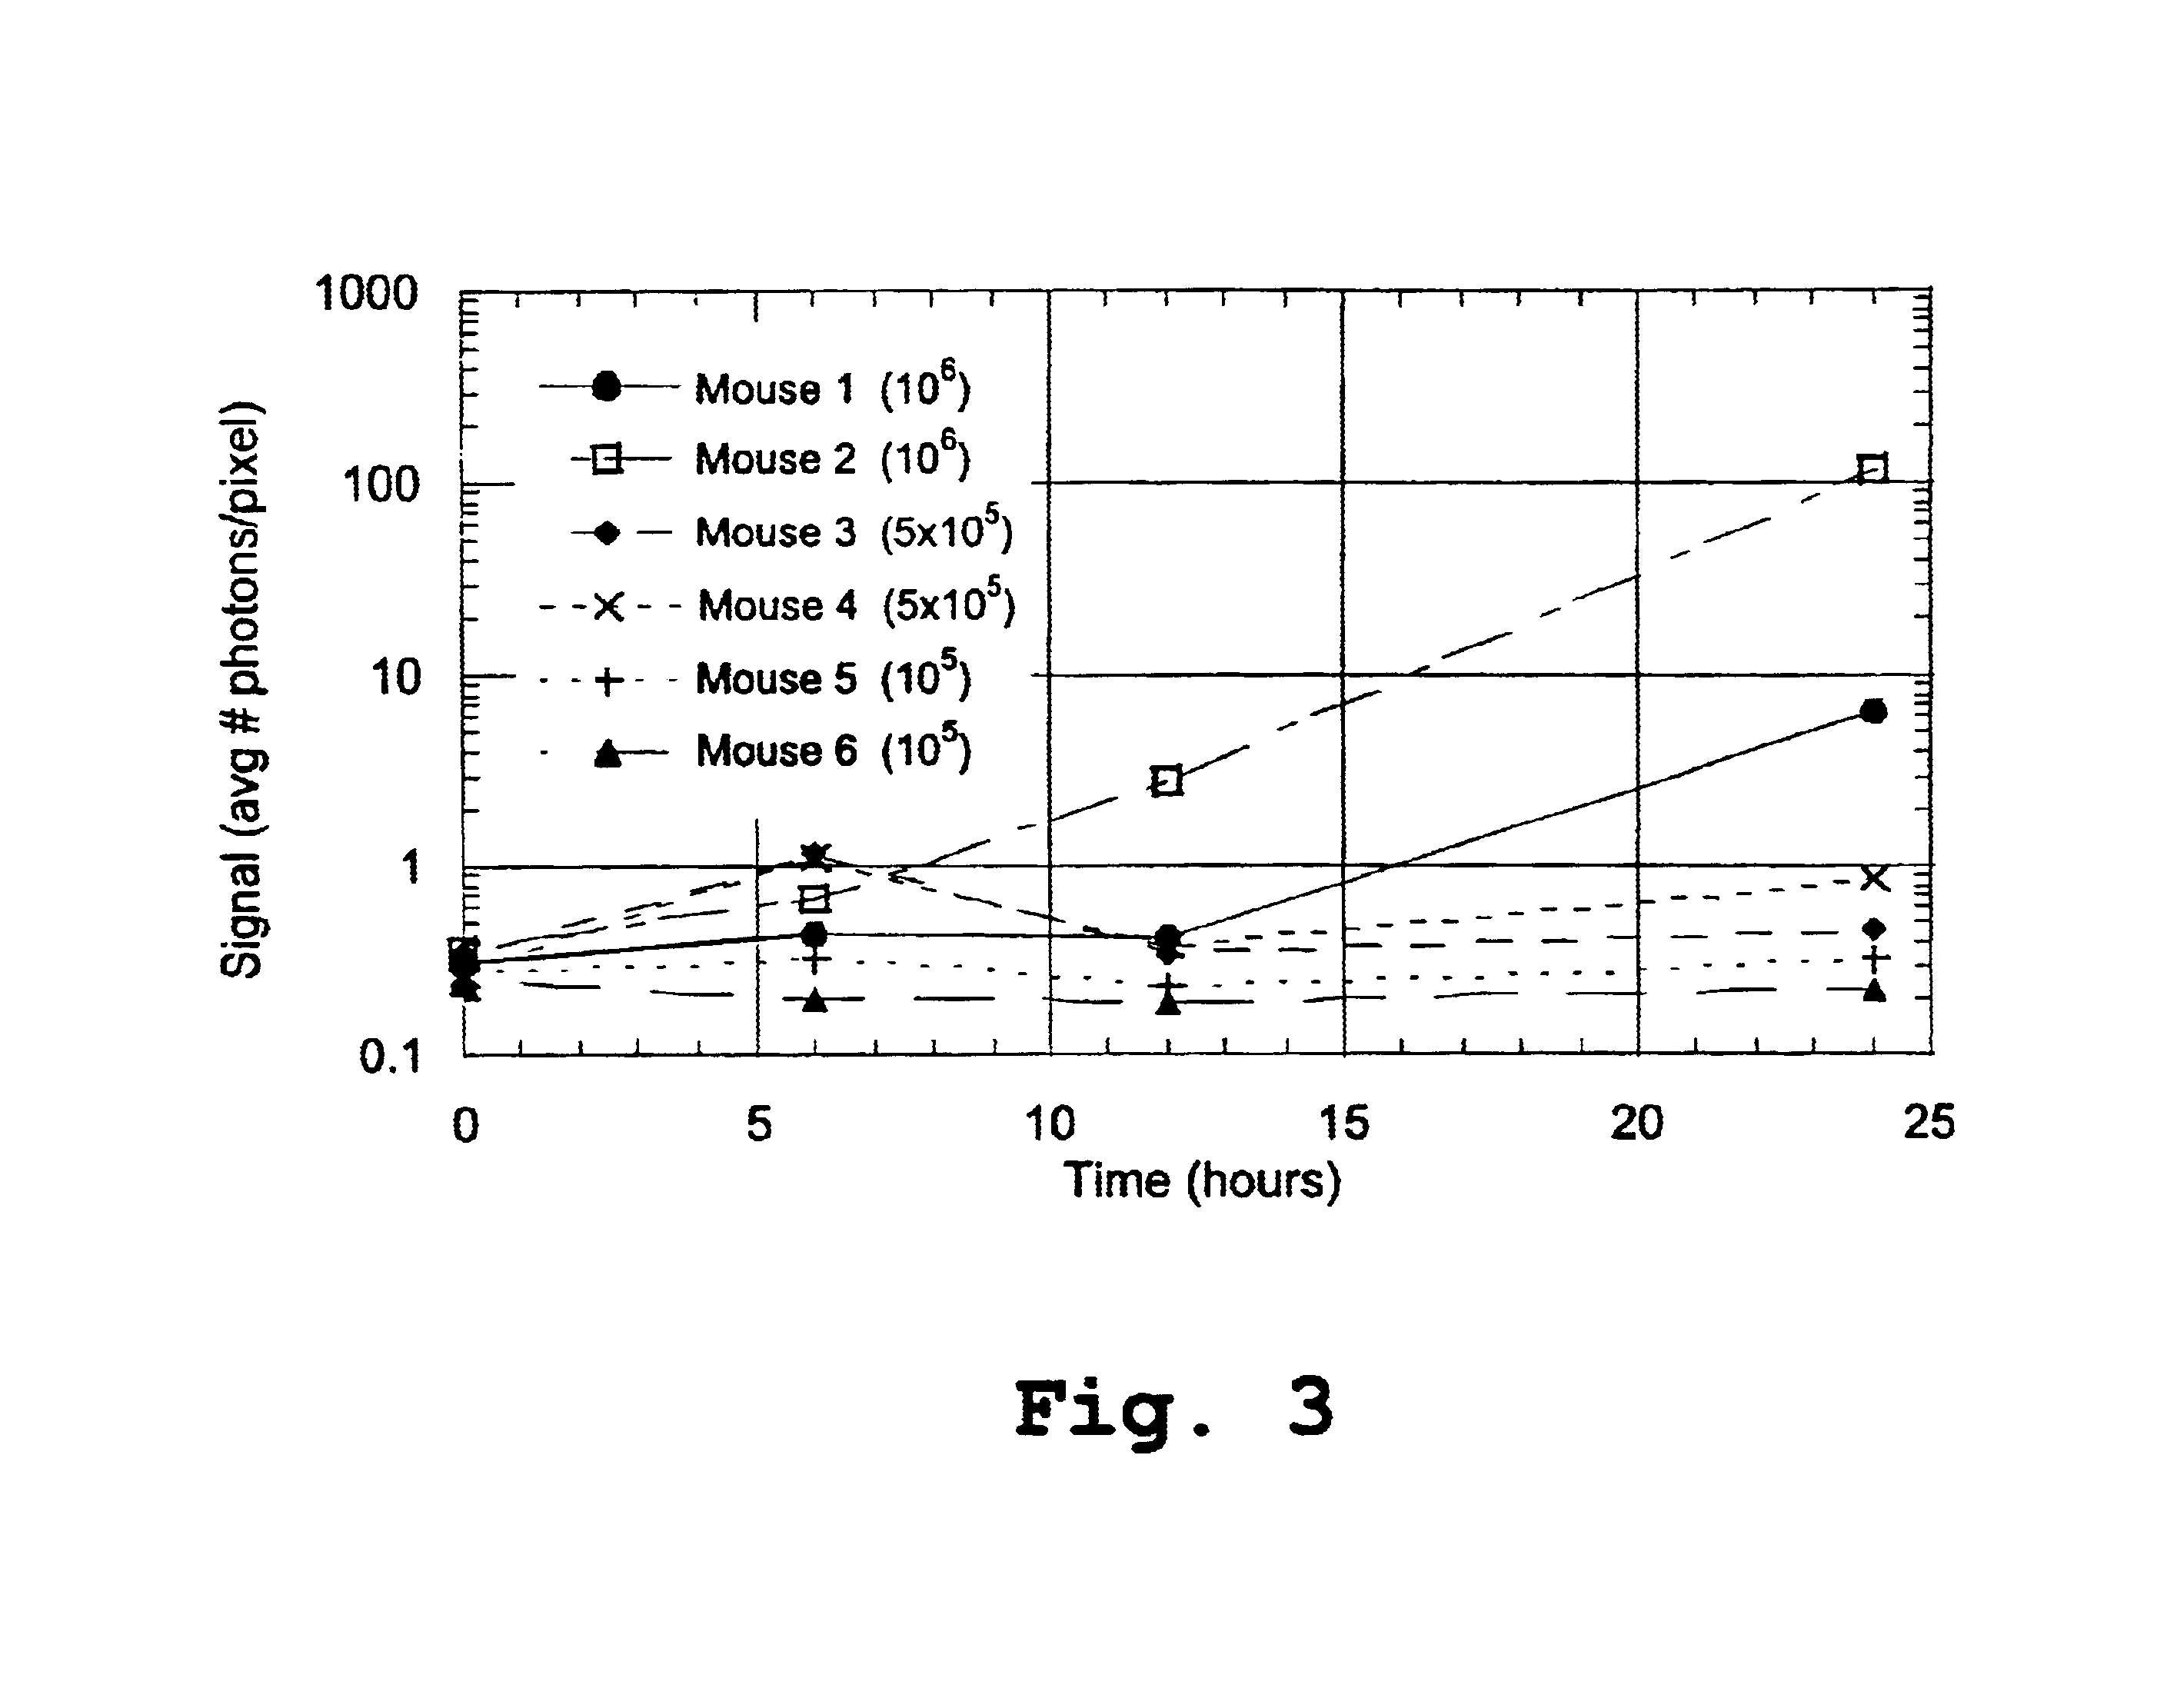
[0130]Six female Balb / c mice (8-12 weeks old), anesthetized as described above, were injected i.p. with 2-11 lux P. aeruginosa as described above. The doses were selected to fall in the same order of magnitude as the range of LD50 values from previous studies with this species. Mice 1 and 2 received 1×10⁶ bacteria, mice 3 and 4 received 5×10⁵ bacteria, and mice 5 and 6 received 1×10⁵ bacteria. The luminescent signal in each mouse was imaged in vivo at 0, 6, 12, and 24 hours post-infection and quantified as relative number of photons per pixel. The data are summarized in Table 1, below, and graphed in FIG. 3.

[0131]

TABLE 1MouseMouseMouseMouseMouseMouseTime (h)12345600.3090.3620.3490.2710.2820.23860.4460.6931.1701.1300.3280.198120.4182.8100.3350.3740.2330.185246.380118.600.4640.8660.3190.220

[0132]FIG. 3 shows the signal, in average number of photons per pixel, for the 6 mice, at 6, 12 and 24 hours. It can be appreciated from the d...

example 3

Death Expectation Curve

[0133]The mice described in Example 2 were monitored for 55 hours. Mice 1, 2, and 4 died during the course of the experiment, whereas mice 3, 5, and 6 were able to clear the infection. Based on the data in FIG. 3 and Table 1, above, the onset of terminal sepsis for this experiment was determined to be between 12 and 24 hours post-infection. The 24 hour time point was selected as a convenient point in time after the onset of terminal sepsis, but before the death of the animals, for use in constructing death expectation curves. The curves were thus constructed based on the survival information and the signal data at 24 hours, which are summarized below in Table 2.

[0134]

TABLE 2SignalSignalTime ofMouse #Dose0 hours24 hoursDeltaRatioDeath11.E+060.3096.836.5222.1˜38 h21.E+060.362118118327˜27 h35.E+050.3490.4640.1151.33Survived45.E+050.2710.8660.5953.20˜49 h51.E+050.2820.3190.0371.13Survived61.E+050.2380.220−0.0180.92Survived

[0135]Death expectation curves were constr...


PUM

PropertyMeasurementUnit
volumeaaaaaaaaaa
timeaaaaaaaaaa
timeaaaaaaaaaa

Abstract

Methods for selecting a candidate drug for treating sepsis are disclosed. The methods involve labeling a sepsis-causing pathogen with a reporter and monitoring the progress of infection by detecting levels of the reporter in animals treated with test compounds or drugs. The comparisons may be made between experimental and control animals, as well as within a single animal or group of animals. Also disclosed is a method for predicting an expected time of death of an experimental animal in a model system of sepsis using data generated in the initial part of the experiment.

Description

CROSS REFERENCE TO RELATED APPLICATIONS[0001]This application is a divisional of U.S. patent application Ser. No. 09 / 527,061, filed 16 Mar. 2000 now U.S. Pat. No. 6,610,503, issued Aug. 26, 2003, from which priority is claimed under 35 U.S.C. § 120, and which application is related to U.S. Provisional Patent Application Ser. No. 60 / 124,725 filed Mar. 17, 1999, from which priority is claimed under 35 U.S.C. § 119(e)(1), and which applications are incorporated herein by reference in their entireties.TECHNICAL FIELD[0002]The present invention relates to animal models of sepsis and methods of use thereof. In particular, the invention relates to methods of predicting survival time of animals with sepsis, and methods of screening test compounds for effectiveness in treating sepsis.BACKGROUND OF THE INVENTION[0003]Sepsis, or illness caused by a severe infection, is the third leading cause of infectious death (Bone, et al., 1997). The majority of sepsis cases are caused by bacterial infecti...

Claims


Application Information

Patent Timeline
Patent Type & Authority Patents(United States)
IPC IPC(8): C12Q1/68C12Q1/02A01K67/027C12Q1/18G01N33/15G01N33/50
CPCC12Q1/025C12Q1/6897A61K2123/00
Inventor BELLINGER-KAWAHARA, CAROLECONTAG, PAMELA R.HUBBARD, ALAN
Owner XENOGEN CORP
Why Eureka
Try Eureka