Method of characterizing spectrometer instruments and providing calibration models to compensate for instrument variation

a technology of spectrometer and calibration model, applied in instruments, optical radiation measurement, diagnostics using spectroscopy, etc., can solve the problems of instrument spectral response variation, time-consuming and expensive calibration data sets, and inability to adapt to the production of similar instruments produced by other manufacturers, so as to achieve significant reduction of the number of calibration transfers

Inactive Publication Date: 2006-05-02
GLT ACQUISITION
View PDF8 Cites 53 Cited by
  • Summary
  • Abstract
  • Description
  • Claims
  • Application Information

AI Technical Summary

Problems solved by technology

Many of the analytical applications for spectrometers require calibration data sets that are time-consuming and expensive to create.
In addition, a calibration set for an instrument produced by one manufacturer is generally not suitable for a similar instrument produced by another manufacturer.
Furthermore, repairs to a single instrument can cause the instrument's spectral response to vary.
In applications requiring analysis of very low concentration analytes, non-invasive blood glucose prediction, for example, even minor instrument variation can introduce an unacceptable degree of error into the analysis.
However, development of new calibration models is time-consuming, labor-intensive, and costly.
No methodology exists for providing calibrations for large numbers of instruments quickly and inexpensively.
Because these currently known methods act as a smoothing function when transferring calibrations, they degrade the signal to noise that can be observed, thus hindering analysis of low concentration analytes.
Additional problems of changes in resolution or bandwith across time or between instruments have not been addressed.
Furthermore, the currently known methods have only been successfully applied in situations involving a small number of instruments.
The reported methods are not capable of modeling the complexity encountered when large numbers of instruments are involved.

Method used


Image

  • Method of characterizing spectrometer instruments and providing calibration models to compensate for instrument variation
  • Method of characterizing spectrometer instruments and providing calibration models to compensate for instrument variation
  • Method of characterizing spectrometer instruments and providing calibration models to compensate for instrument variation

Examples


Embodiment Construction

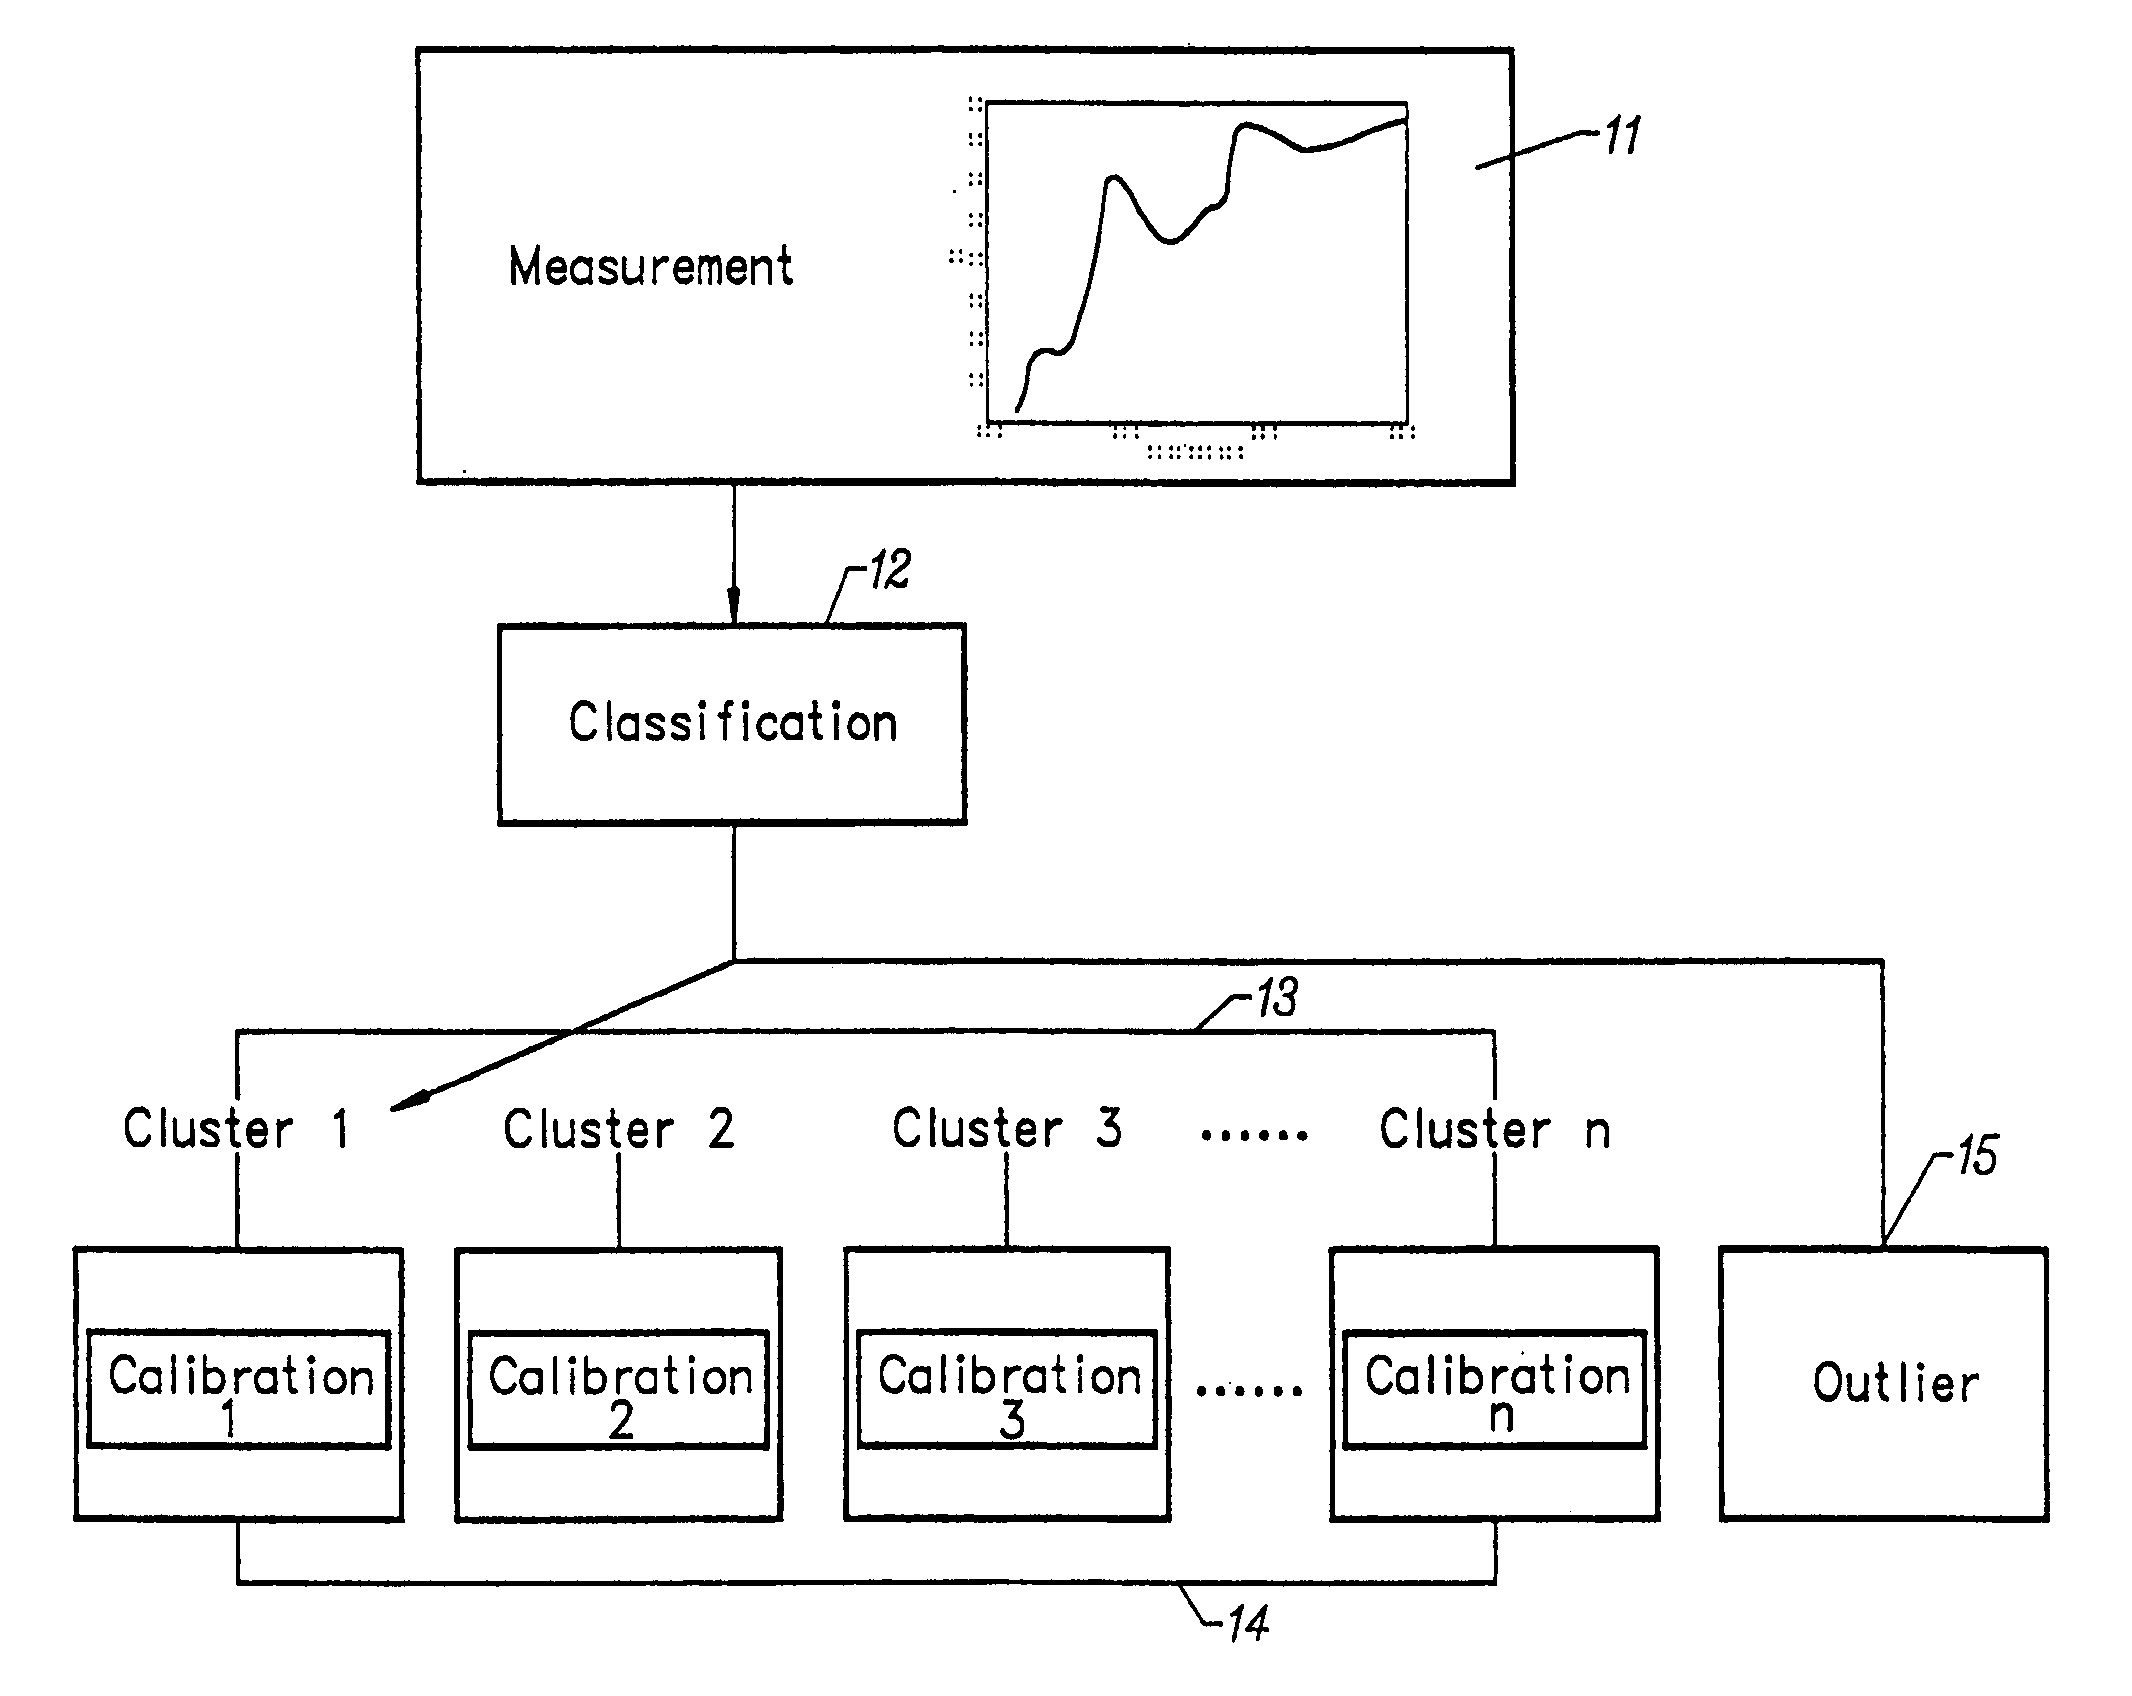
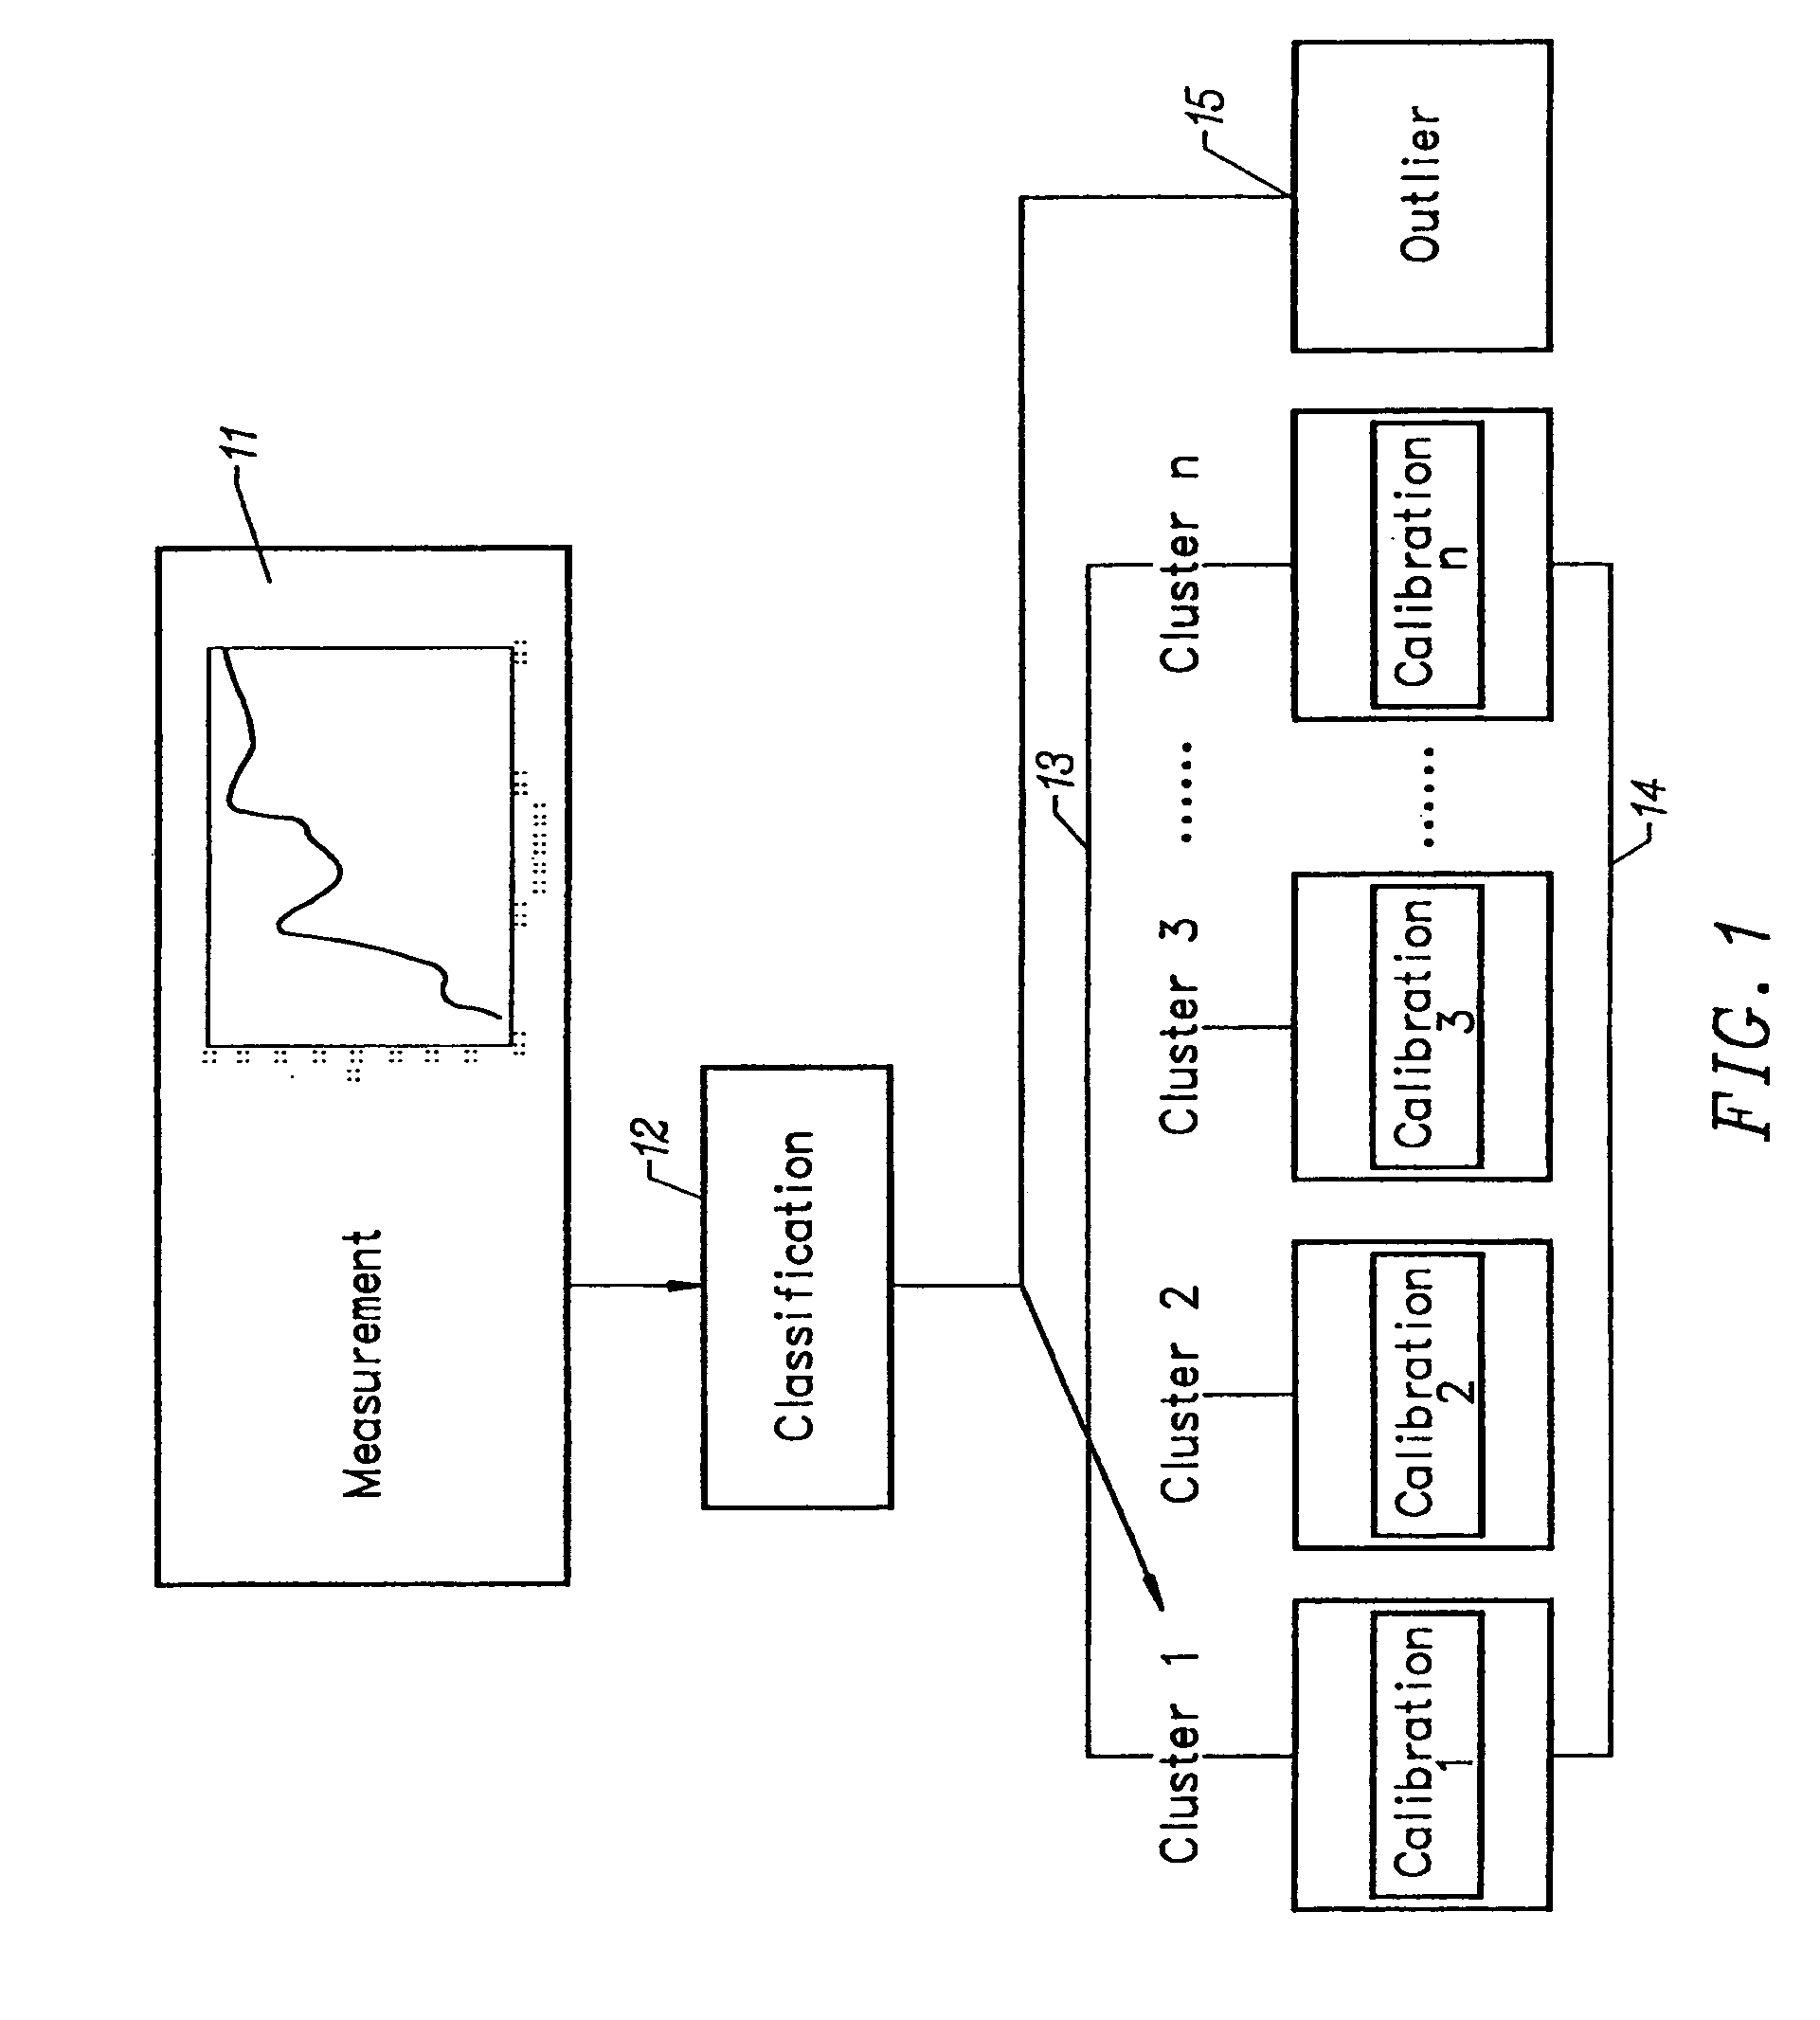
[0017]The invention provides a method of characterizing spectrometer instruments by classifying spectral responses from a large number of spectrometers (analyzers) into a limited number of previously defined clusters. The clusters constitute groups that are defined based on the similarity of specific features. Grouping of instruments according to spectral features and performance characteristics reduces the spectral variation between instruments in a given group. Therefore, spectral measurements corresponding to an individual cluster are more homogeneous than those from the entire group of analyzers. Calibrations created for each cluster may then be used for subsequent analysis. The calibration created for a cluster has instrument variations included in the model that mirror variations resulting from the particular analyzer employed for the subsequent analysis. Calibration models specific to the clusters are expected to be less complex and have an improved level of accuracy. Therefo...


PUM

PropertyMeasurementUnit
spectrumaaaaaaaaaa
concentrationaaaaaaaaaa
current spectral responseaaaaaaaaaa

Abstract

Spectrometer instruments are characterized by classifying their spectra into previously defined clusters. The spectra are mapped to the clusters and a classification is made based on similarity of extracted spectral features to one of the previously defined clusters. Calibration models for each cluster are provided to compensate for instrumental variation. Calibration models are provided either by transferring a master calibration to slave calibrations or by calculating a separate calibration for each cluster. In one embodiment, a simplified method of calibration transfer maps clusters to each other, so that a calibration transferred between clusters models only the difference between the two clusters, substantially reducing the complexity of the model.

Description

CROSS-REFERENCE TO RELATED APPLICATION[0001]This application is a divisional application of U.S. patent application Ser. No. 09 / 664,973 filed Sep. 18, 2000 now U.S. Pat. No. 6,864,978, which is a continuation-in-part of U.S. patent application Ser. No. 09 / 359,191 filed Jul. 22, 1999, now U.S. Pat. No. 6,280,381 (Aug. 28, 2001).BACKGROUND OF THE INVENTION[0002]1. Field of the Invention[0003]The invention relates to variations in spectrometer instruments. More particularly the invention relates to characterizing spectrometer instruments by classifying their spectral responses into a limited number of clusters and developing calibration transfer models between clusters that compensate for instrument variations.[0004]2. Description of the Prior Art[0005]Many of the analytical applications for spectrometers require calibration data sets that are time-consuming and expensive to create. Typically, these calibrations are highly specific. For example, apparently identical instruments produce...

Claims


Application Information

Patent Timeline
Patent Type & Authority Patents(United States)
IPC IPC(8): G01J3/28A61B5/00G01N21/35A61B5/107A61B5/145A61B5/1455A61B5/1495G01J3/02G01N21/27G01N21/47G01N21/49G06F19/00
CPCA61B5/0075G01N21/49A61B5/14532A61B5/1455A61B5/1495A61B5/7264G01J3/28G01N21/274G01N21/359G01N21/4785A61B2560/0223A61B2560/0233G01J2003/2866G01N21/3563A61B5/1075G16H50/20
Inventor HAZEN, KEVIN H.BLANK, THOMAS B.MONFRE, STEPHENRUCHTI, TIMOTHY L.
Owner GLT ACQUISITION
Why Eureka
Try Eureka