Method for charting financial market activities

a financial market and activity technology, applied in finance, data processing applications, instruments, etc., can solve the problems that only ohlc prices display a complete picture of the underlying market conditions, and achieve the effect of facilitating analysis of time-series behavior and relationship with the usual ohl

Inactive Publication Date: 2006-05-09
PROSTICKS COM
View PDF5 Cites 126 Cited by
  • Summary
  • Abstract
  • Description
  • Claims
  • Application Information

AI Technical Summary

Benefits of technology

[0021]Before the present invention, traders who want to keep track of volume and time distribution information have to do so manually. Furthermore, they do not have consistent quantifying standard and only rely on rough estimation. Under the present invention, with the intra-market information quantified and overlaid on the chart, traders no longer...

Problems solved by technology

The conventional OHLC charts which displays only the OHLC prices obvio...

Method used


Image

  • Method for charting financial market activities
  • Method for charting financial market activities
  • Method for charting financial market activities

Examples


Embodiment Construction

[0043]In this section, the present invention is described in detail with regard to the drawing figures briefly described above.

Terminology

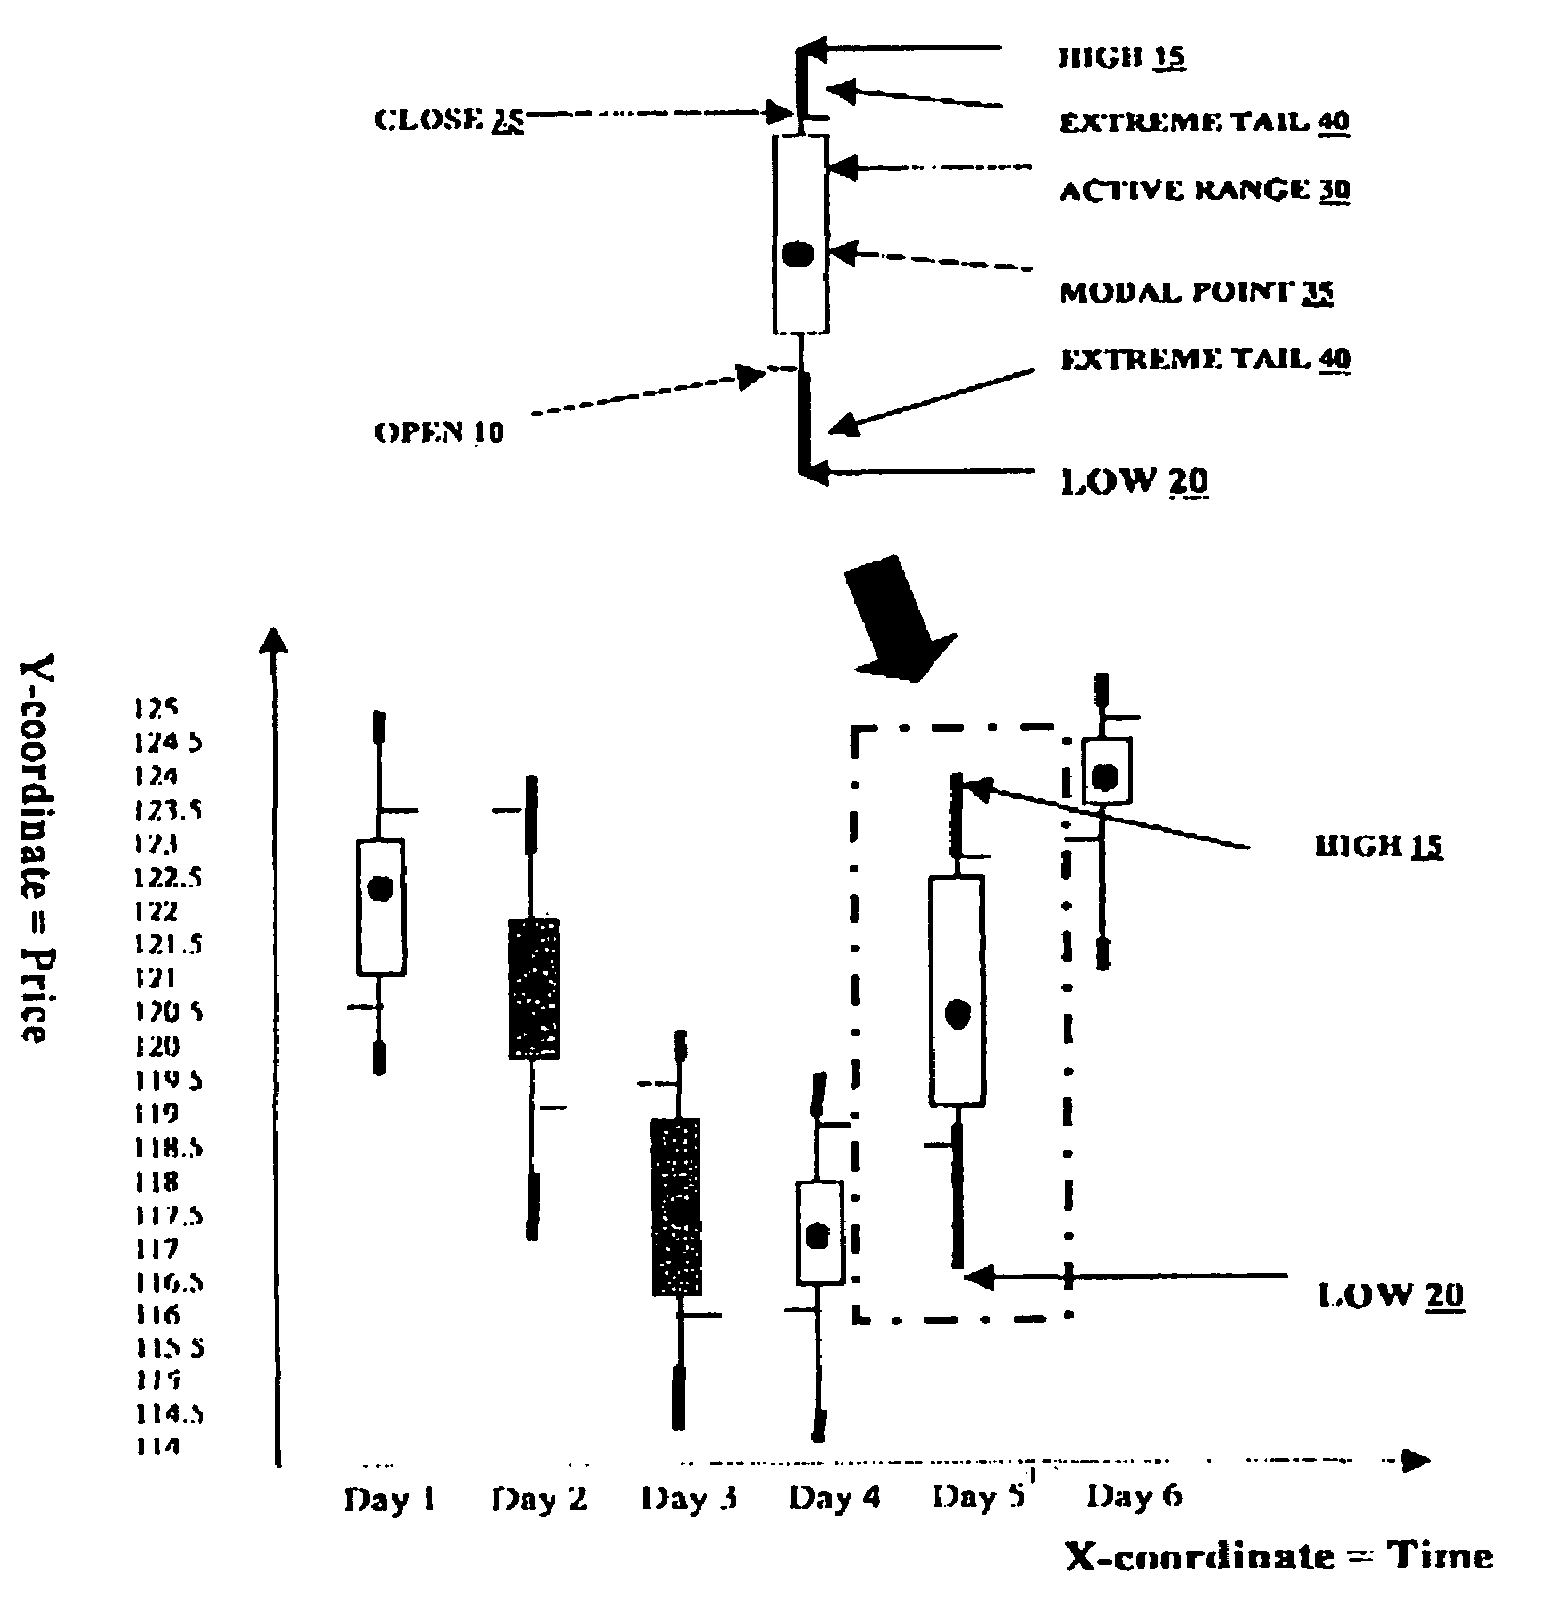
[0044]For the sake of subsequent discussion, the term “volume” means either shares or dollar amount turnover. It also applies to open interest of futures and commodities.

[0045]The term “bar” is used to mean a graphical entity for a given time interval on any price-time chart, no matter if it is a Bar Chart or Japanese Candlestick Chart.

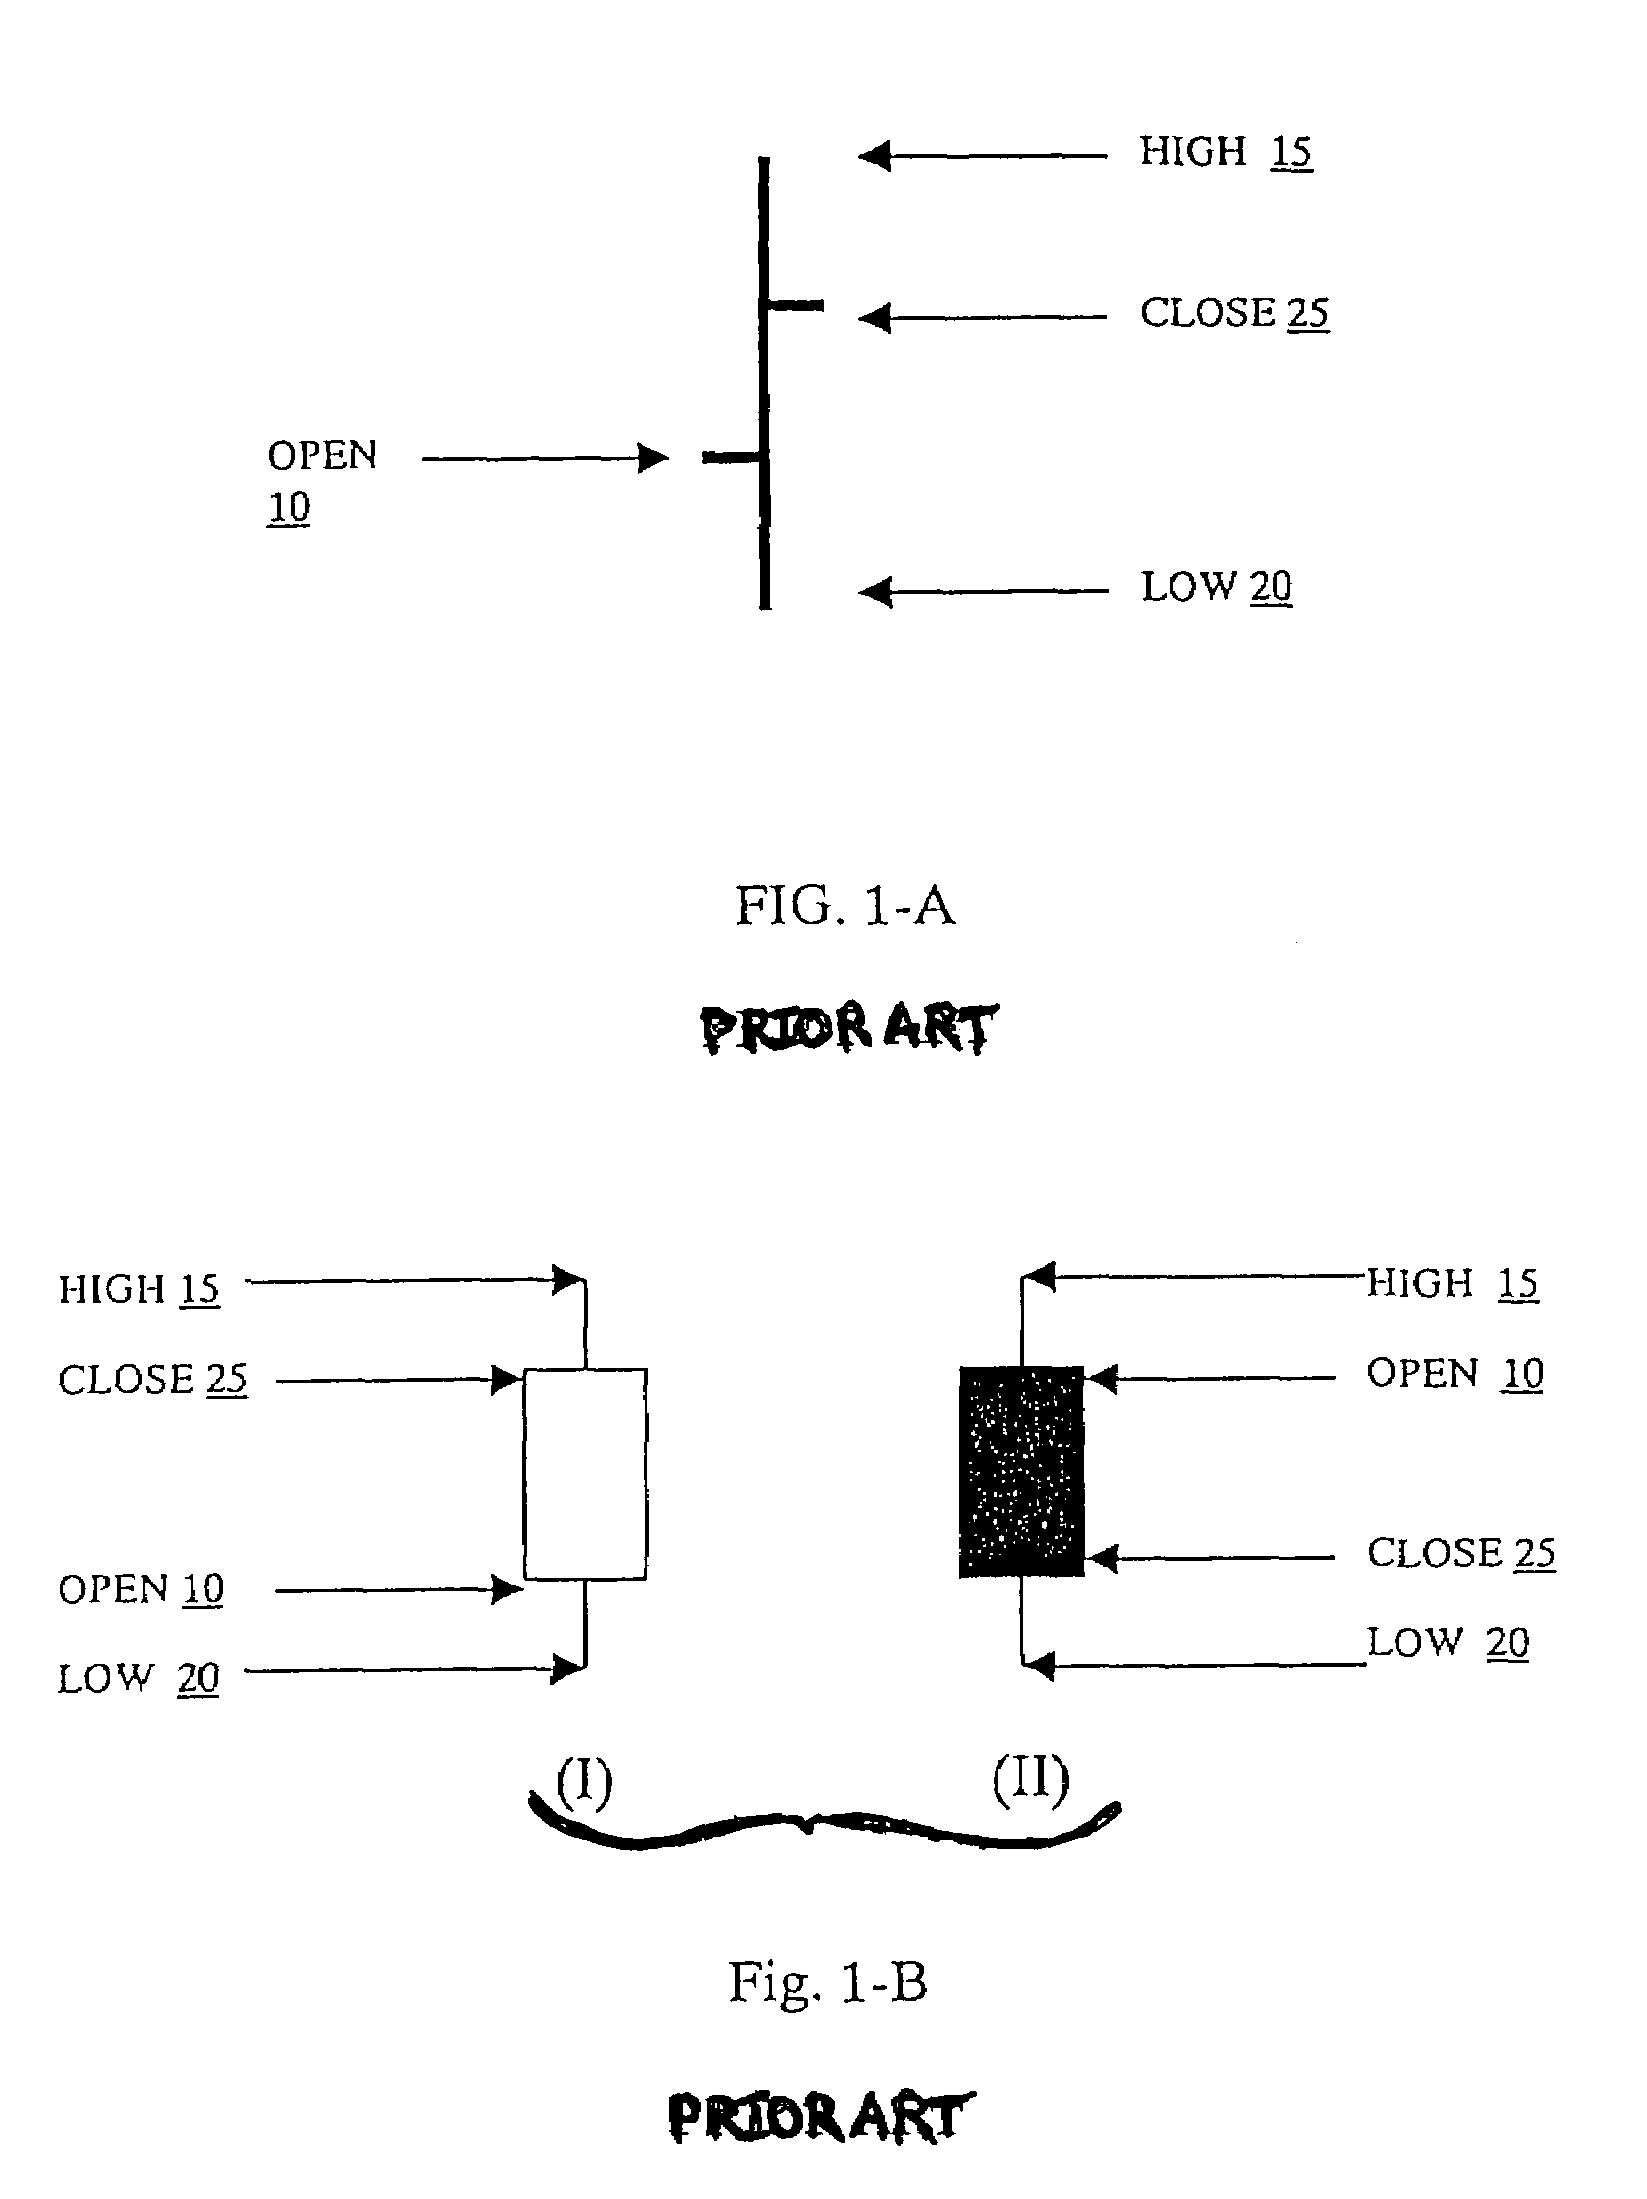
[0046]The term OHLC means open, high, low and close prices which are respectively the first, highest, lowest, and the last traded price in the time period.

[0047]The term “OHLC chart” means a Bar chart, a Japanese candlestick chart, or a special form of chart which looks like the Bar Chart but without the open price, or the close price, or both.

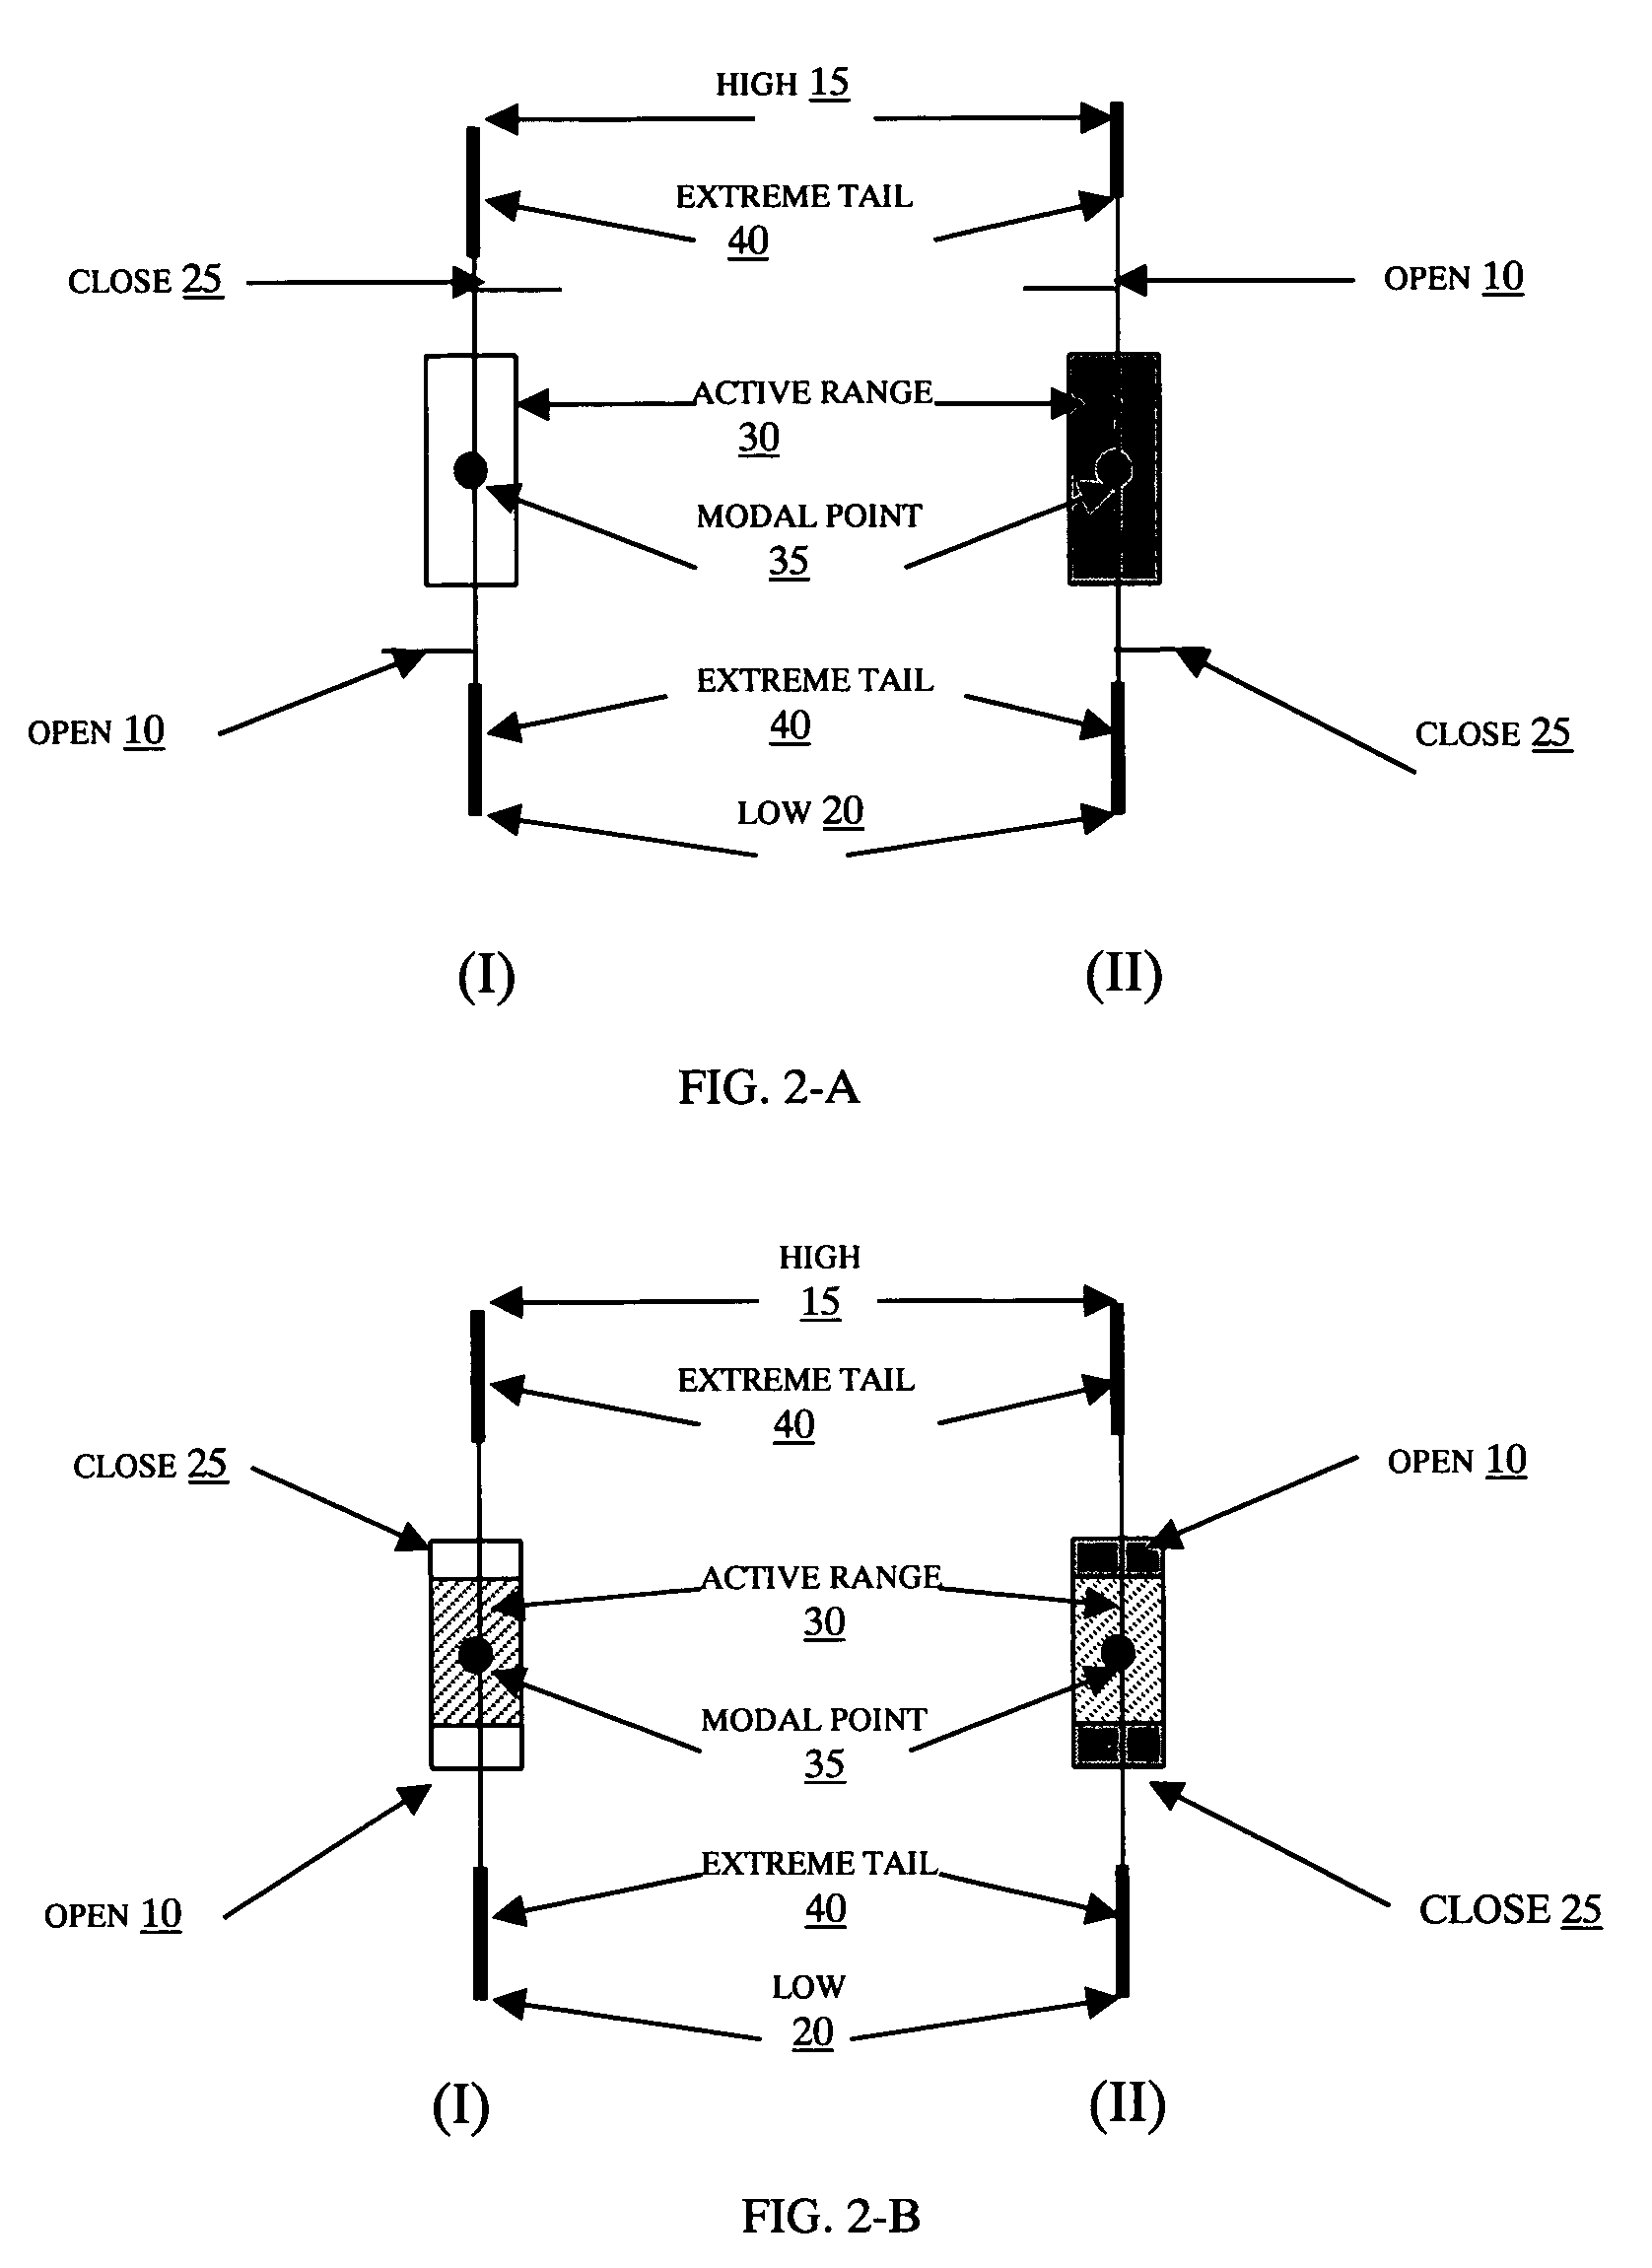
[0048]For a bar on the Bar Chart, the central vertical line joining the high and low price is called the central axis.

[0049]For the candlestick, the rectangle encompassing the...


PUM


Abstract

A method and apparatus for augmenting the conventional price-time chart used for technical analysis of securities price movements. In a preferred embodiment, the method takes a conventional Bar Chart or Japanese Candlestick Chart with a definite timeframe and then for each bar on the chart; it statistically quantifies the volume and time distribution throughout the range of the bar into discrete elements, using price and volume data within the bar interval from a sub-timeframe. The discrete elements are then graphically overlaid on the bar in a way which preserves its original appearance as close as possible. The apparatus is an application software which implements the method by displaying the conventional price-time chart, calculating the relevant elements and overlaying the values on the chart bars, either in a static or real-time market setting.

Description

BACKGROUND[0001]1. Field of Invention[0002]This invention relates to a computer implemented charting method for charting movements of financial market traded instruments by overlaying discrete quantified elements of time and volume distributions onto the conventional price-time chart.[0003]2. Description of Prior Art[0004]In financial charting, the Bar Chart and the Japanese Candlestick Chart are two forms of price-time charts most widely used by traders and analysts as means of predicting future price movements. Each bar in these two types of charts displays the open, high, low and close prices (herein after abbreviated as OHLC) traded by a financial instrument (e.g. stocks, indices, currencies) in a given time interval, which is called the timeframe of the chart. Thousands of tools and techniques have been developed based on the time-series analysis of these OHLC prices and collectively this is known as technical analysis.[0005]However, for every financial commodity, between the m...

Claims


Application Information

Patent Timeline
IPC IPC(8): G06Q40/00G06F19/00G06T11/20G09G
CPCG06Q40/00G06Q40/06G06Q40/04
Inventor LI, VINCENT CHING PINGCHONG, RAYMOND
Owner PROSTICKS COM
Why Eureka
Try Eureka