
Method for visualizing graphical data sets having a non-uniform graphical density for display

a graphical data and display technology, applied in the field of visual and graphical displays, can solve the problems of user suffering, loss of context, loss of crucial information, etc., and achieve the effect of increasing resolution and increasing resolution in the display area

Inactive Publication Date: 2006-05-16
MICRO FOCUS LLC
View PDF10 Cites 29 Cited by
  • Summary
  • Abstract
  • Description
  • Claims
  • Application Information

AI Technical Summary

Benefits of technology

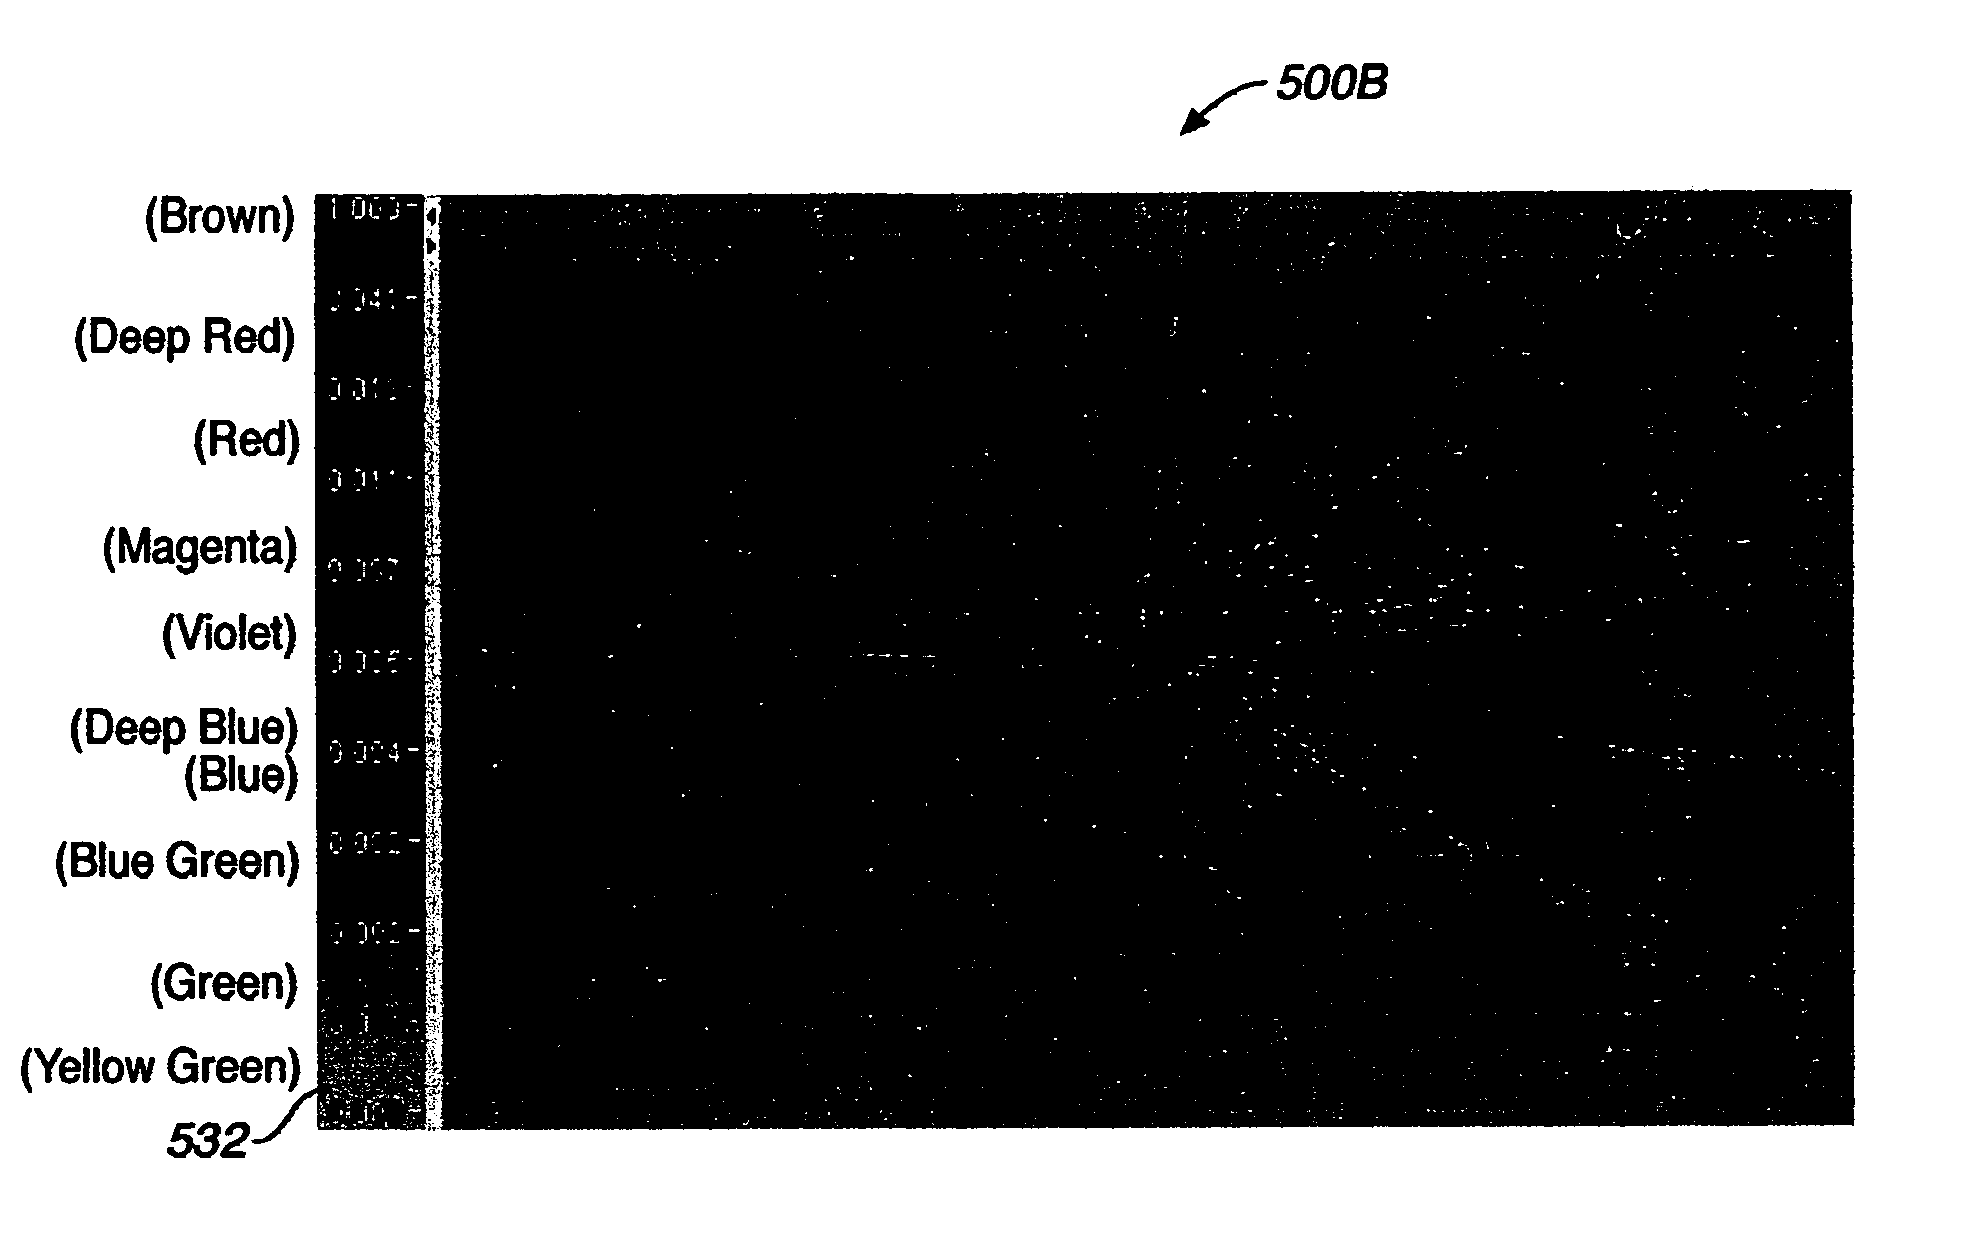
[0024]A method for visualizing high density graphical data sets for display is effectuated by determining the graphical density corresponding to an area of the display, where the graphical density is of a non-uniform nature. A non-linear visual space transformation corresponding to the graphical density is processed. Resolution in the area of the display is increased in response to the non-linear visual space transformation and the area is displayed with increased resolution.

Problems solved by technology

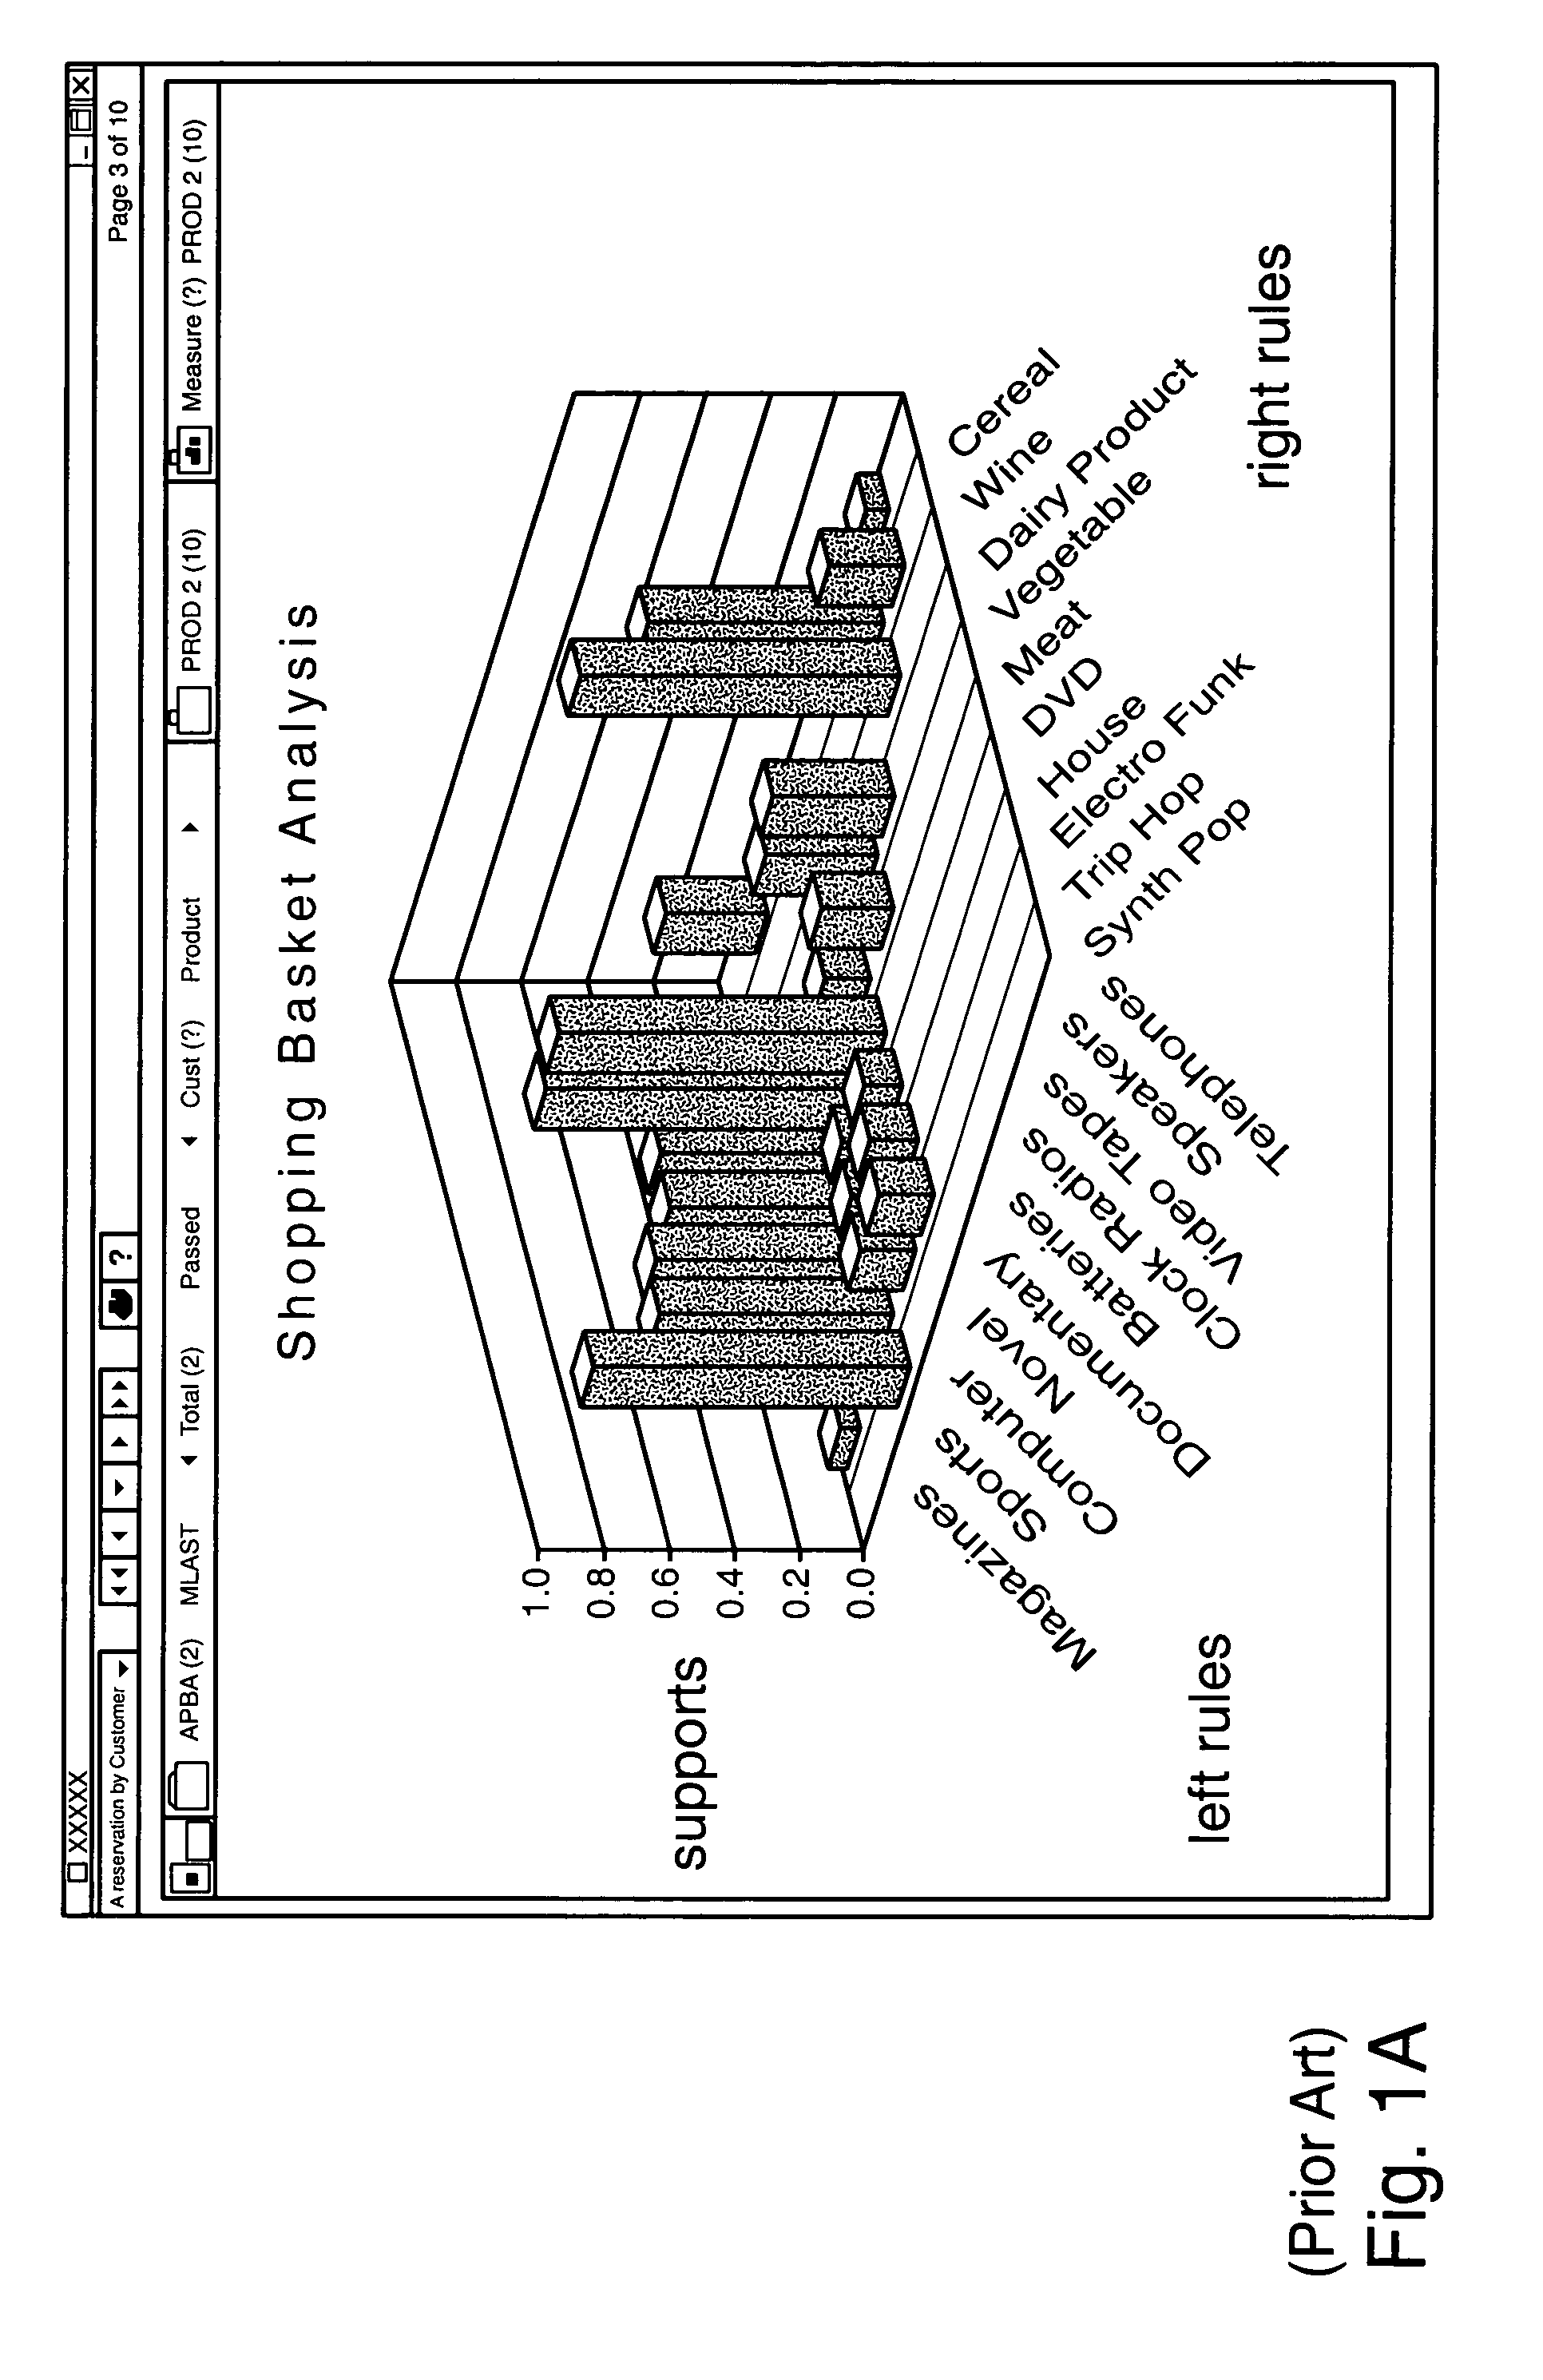
Thus, the user suffers not simply loss of informational content available in his graphical display of data, but further suffers a lose of context, which in many modern analytical applications may cause lose of crucial information.
Individually, combining the consequences of loss of content and loss of context is serious enough.
However, combining the effects of each loss may amplify the significance of both losses in a manner worse than simple arithmetic addition, such that the total loss of analytical value is much greater in certain situations.
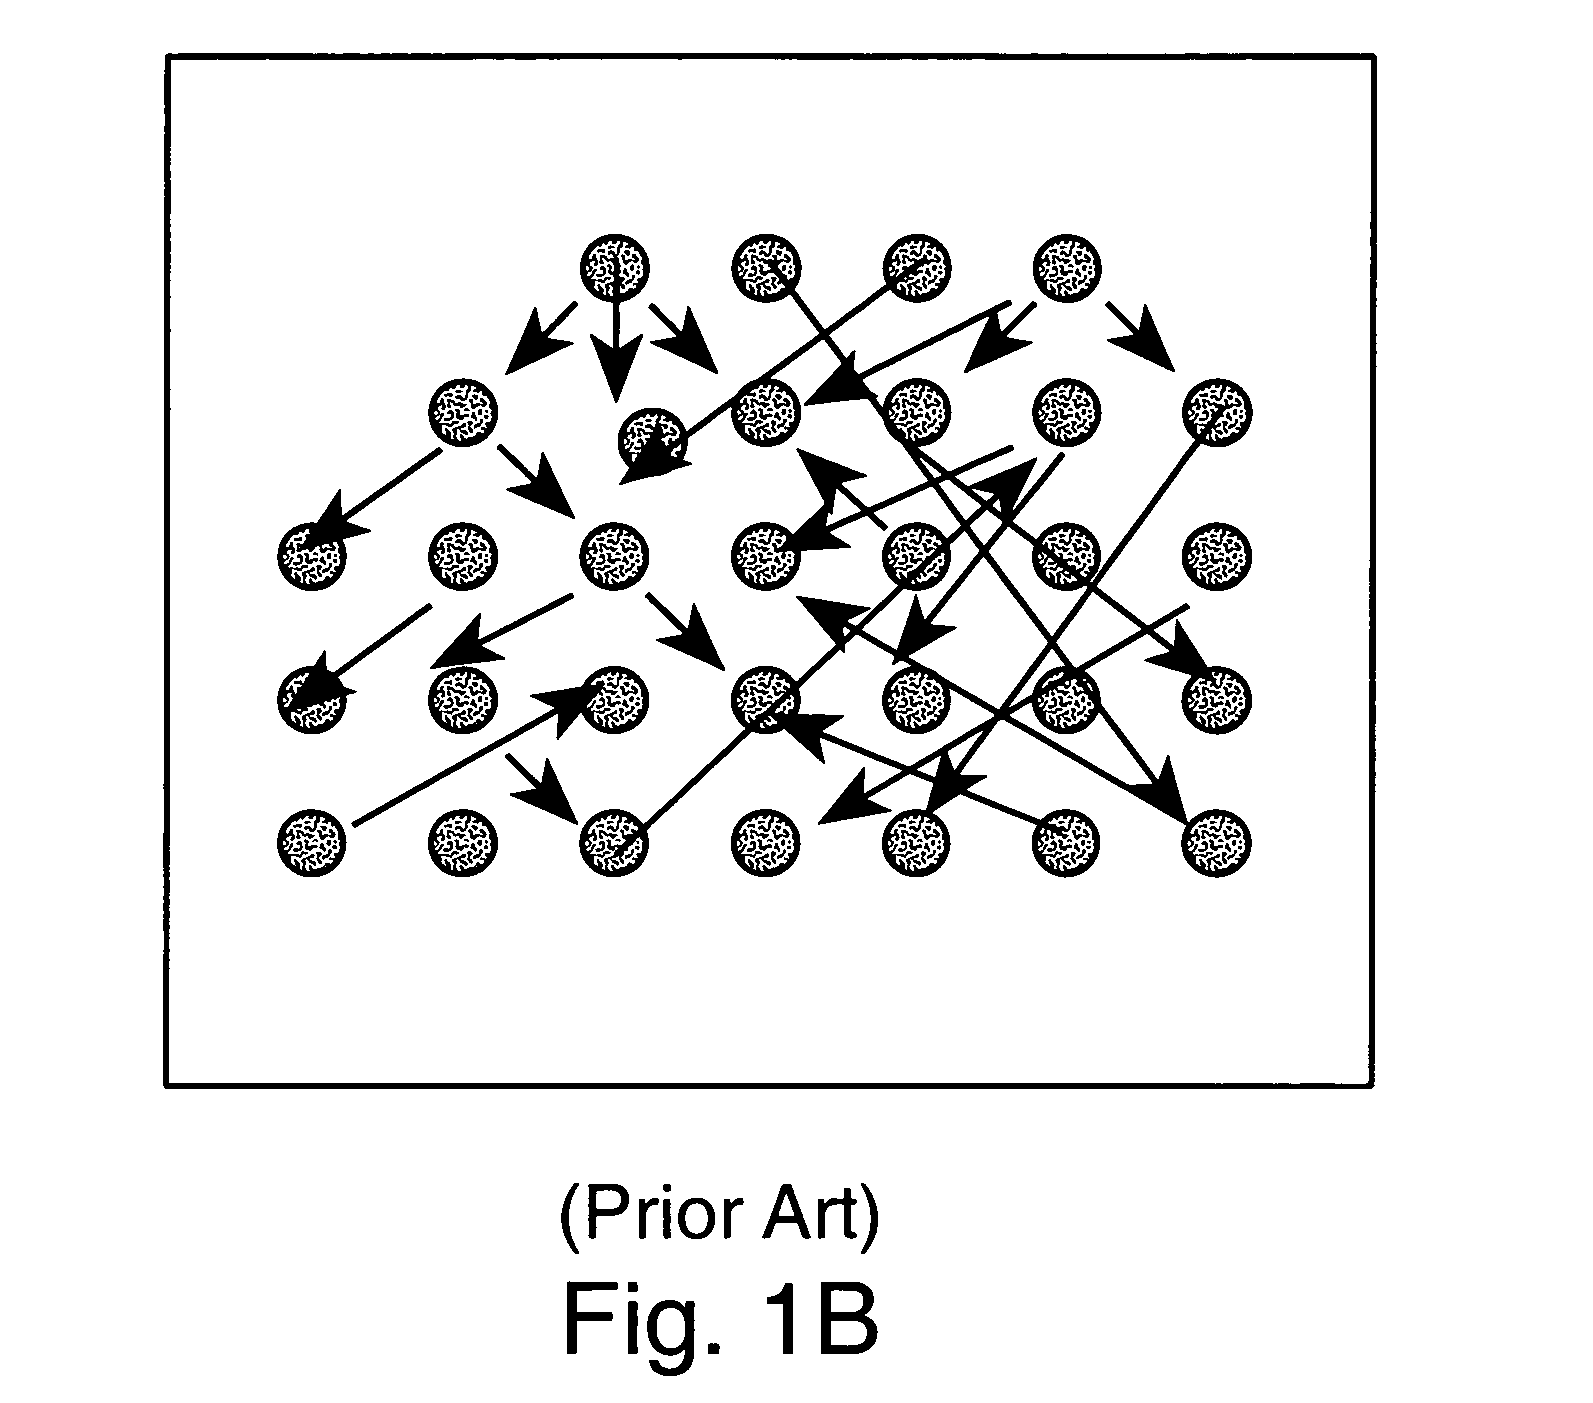
However, such pseudo coloring schemes fail as, for instance, all the similarity edges are colored identically or nearly so, due to the non-uniformed dataset.

Method used


Image

  • Method for visualizing graphical data sets having a non-uniform graphical density for display
  • Method for visualizing graphical data sets having a non-uniform graphical density for display
  • Method for visualizing graphical data sets having a non-uniform graphical density for display

Examples


Embodiment Construction

[0039]In the following detailed description of embodiments of the present invention, numerous specific details are set forth in order to provide a thorough understanding of the present invention. However, it will be recognized by one skilled in the art that the present invention may be practiced without these specific details or with equivalents thereof. Embodiments of the present invention are discussed primarily in the context of a method for generating graphical data for display. In one embodiment, a method and system for visualization of high density three dimensional graphs, using non-linear visual space transformations is effectuated.

[0040]With reference to FIG. 2A, an automated visual mining platform 10 is depicted, in accordance with one embodiment of the present invention. In one embodiment, automated visual mining platform 10 is a software system implemented in a computer system. The computer system that embodies the automated visual mining platform 10 can be any kind of c...


PUM


Abstract

A method for visualizing high density graphical data sets for display is effectuated by determining the graphical density corresponding to an area of the display, where the graphical density is of a non-uniform nature. A non-linear visual space transformation corresponding to the graphical density is processed. Resolution in the area of the display is increased in response to the non-linear visual space transformation and the area is displayed with increased resolution.

Description

BACKGROUND OF THE INVENTION[0001]1. Field of the Invention[0002]The present invention relates to the field of visual and graphical displays for the representation of data. Specifically, the present invention relates to a method for visualizing high density graphical data for display.[0003]2. Related Art[0004]Modern computer systems and other media for accessing and interacting with information typically display data visually in various graphical formats. Visually displayed graphically formatted data is an important medium in many fields. These fields include electronically based commerce and business, also known as e-commerce and e-business, operations research, epidemiology, information technology (IT) network administration and engineering, and a wide-ranging host of others.[0005]The are numerous examples of applications of visually displayed graphically formatted data in these fields. E-business relies heavily on market basket analysis and customer profiling. IT depends on manage...

Claims


Application Information

Patent Timeline
IPC IPC(8): G06T11/20G09G5/00
CPCG06T11/206
Inventor HAO, MING C.DAYAL, UMESHWARCOTTING, DANIELGROSS, MARKUSHOLENSTEIN, THOMASONO, BRIANKARP, ALAN
Owner MICRO FOCUS LLC
Learn More