Image sensing apparatus for calculating a histogram of image data and its control method
Active Publication Date: 2006-08-01
CANON KK
4 Cites 10 Cited by
AI-Extracted Technical Summary
Problems solved by technology
However, the aforementioned camera that can display the histogram of the entire image data does not have a function of calculating the histogram of only a specific range ...
Method used
[0036]When images are to be continuously shot, image data are temporarily stored in the buffer memory 19, unprocessed image data are read out via the memory controller 13 and undergo the basic processes or compression process by the video signal processing circuit 10 during a processing time, thus improving the continuous shot speed.
[0083]In FIG. 4C, the histogram 44 within the selected photometry area is narrower and smaller than the histogram 43 of the entire image data. As shown in FIG. 4C, when the histogram 44 within the selected photometry area may become smaller than the histogram 43 of the entire image data and may be hard to be observed, the hist...
Benefits of technology
[0005]It is an object of the present invention to provide an apparatus which can improve a histogram display function of image data, a histogram display method,...
Abstract
This invention provides an image sensing apparatus and method, which can independently calculate and display the histograms of the entire range and selected range of image data sensed by an image sensing element.
In an image sensing apparatus of this invention, a microcomputer (16) calculates the histogram of the entire area of image data sensed by an image sensing element (6), and that of image data of an area selected by an operation member (18) which is used to select a photometry mode, and identifiably displays these calculation results on an EVF (12) via circuits from a video signal processing circuit (10) to an EVF driving circuit.
Application Domain
Television system detailsPicture signal generators +1
Technology Topic
HistogramSignal processing circuits +5
Image
Examples
- Experimental program(4)
Example
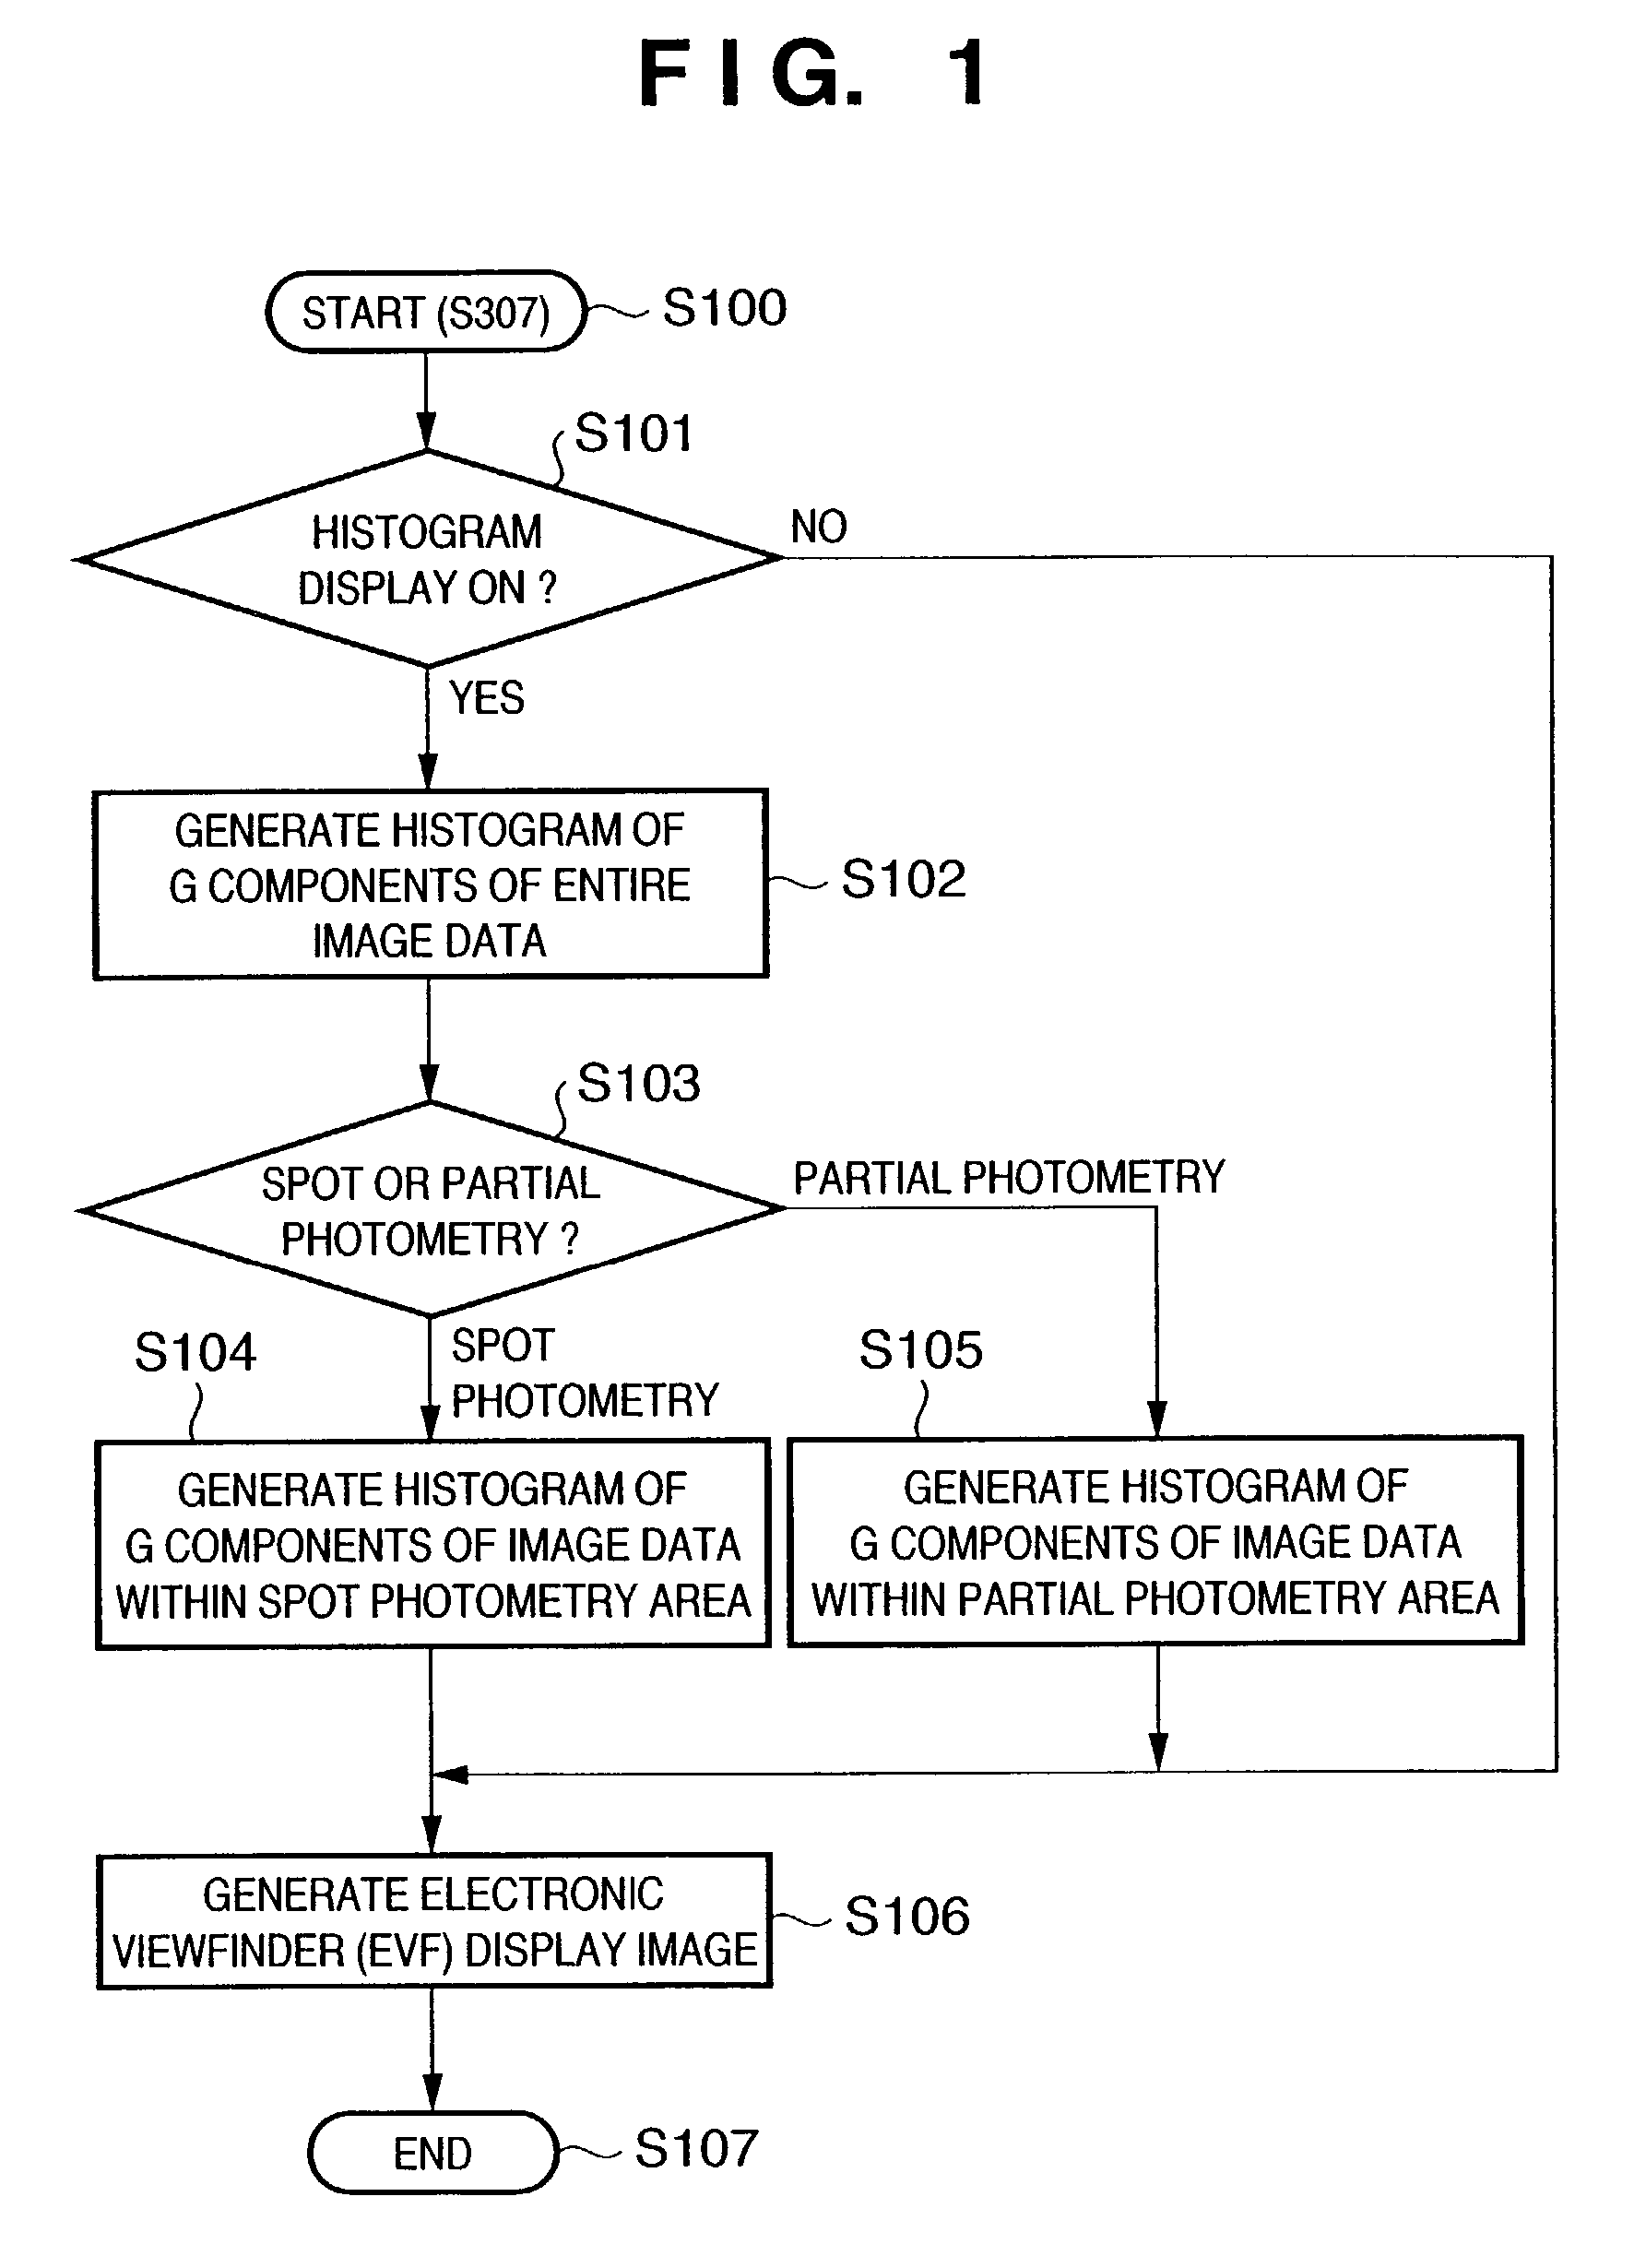
[0068]A characteristic feature of the first embodiment will be described below using the flow chart shown in FIG. 1.
[0069]The process shown in the flow chart in FIG. 1 is included in step S307 in FIG. 3.
[0070]In the following description, a method of displaying histograms on the electronic viewfinder using G components of the entire range of the image sensing frame of image data, and a partial range selected from the entire image sensing range of image data will be exemplified. However, the process to be described below is not limited to G components, and may use R or B components or luminance signal.
[0071]The process starts in step S100.
[0072]It is checked in step S101 based on the operation member 18 if the histogram display mode is ON or OFF. If the histogram display mode is OFF, the flow jumps to step S106 to display an image alone.
[0073]If it is determined in step S101 based on the operation member 18 that the histogram display mode is ON, the flow advances to step S102 to calculate a histogram on the basis of G components of entire image data.
[0074]The current photometry mode set by the operation member 18 is checked in step S103. If a spot photometry mode is set, the flow advances to step S104; if a partial photometry mode is set, the flow advances to step S105.
[0075]In step S104, a histogram is calculated using G components of image data corresponding to a spot area 61 shown in FIG. 6A, and the flow then advances to step S106.
[0076]On the other hand, in step S105 a histogram is calculated using G components of image data corresponding to a partial photometry area 62 shown in FIG. 6B, and the flow then advances to step S106.
[0077]In step S106, image data to be sent to the EVF driving circuit 11 is generated on the basis of the histogram of the entire image calculated in step S102, and that of image data within the selected photometry area calculated in step S104 or S105. As image data to be sent to the EVF driving circuit 11, a histogram may be superimposed on an image, or a small image and histogram may be displayed side by side.
[0078]In step S107, a series of operations end.
[0079][Example of Histogram Display: FIGS. 4A to 4C]
[0080]FIGS. 4A to 4C show examples of histogram display.
[0081]FIG. 4A shows a display example of a histogram 43 of the entire image data alone.
[0082]FIG. 4C shows an example in which the histogram 43 of the entire image data calculated in step S102 of the flow chart in FIG. 1, and a histogram 44 within the selected photometry area calculated in step S104 or S105 of the flow chart in FIG. 1 are simultaneously superimposed.
[0083]In FIG. 4C, the histogram 44 within the selected photometry area is narrower and smaller than the histogram 43 of the entire image data. As shown in FIG. 4C, when the histogram 44 within the selected photometry area may become smaller than the histogram 43 of the entire image data and may be hard to be observed, the histogram calculated in step S104 or S105 may be multiplied by a predetermined coefficient (e.g., α) to make the histogram easy to see, as shown in FIG. 4B.
[0084]FIG. 4B shows an example in which the histogram 43 of the entire image data calculated in step S102, and a histogram 42 within the photometry area as the product of the histogram 44 within the selected photometry area calculated in step S104 or S105, and a predetermined constant α (histogram 44×α) are superimposed.
[0085]Note that it is preferable to respectively display the histogram 43 of the entire image data and the histogram 42 within the selected photometry area using identifiable colors or patterns.
[0086]As described above, the image sensing apparatus of this embodiment has a function of calculating the histogram of a specific range (partial photometry area, spot photometry area, or the like) alone of image data independently of that of the entire image data, and displaying that calculation result so as to obtain an appropriate exposure value. For this reason, whether or not a principal object can undergo appropriate exposure can be easily determined using histogram display shown in, e.g., FIG. 4B, and a principal object can undergo appropriate exposure upon photographing.
[0087]In the first embodiment, the image sensing apparatus which can calculate the histogram of image data corresponding to a given photometry range when the selected photometry mode is, e.g., a partial or spot photometry mode, in addition to the histogram of the entire image data, and can identifiably superimpose both the histograms of the entire image data and the selected range, and its image sensing method have been explained.
Example
[0088]On the other hand, in the second embodiment to be described below, an image sensing apparatus which can calculate the histogram of image data corresponding to a given photometry range when the selected photometry mode is other than the partial or spot photometry mode, i.e., an average or split photometry mode, and the photometry area is broad or indefinite, and can identifiably superimpose both the histograms of the entire image sensing range of image data, and a partial range selected from the entire image sensing range, and its image sensing method will be explained.
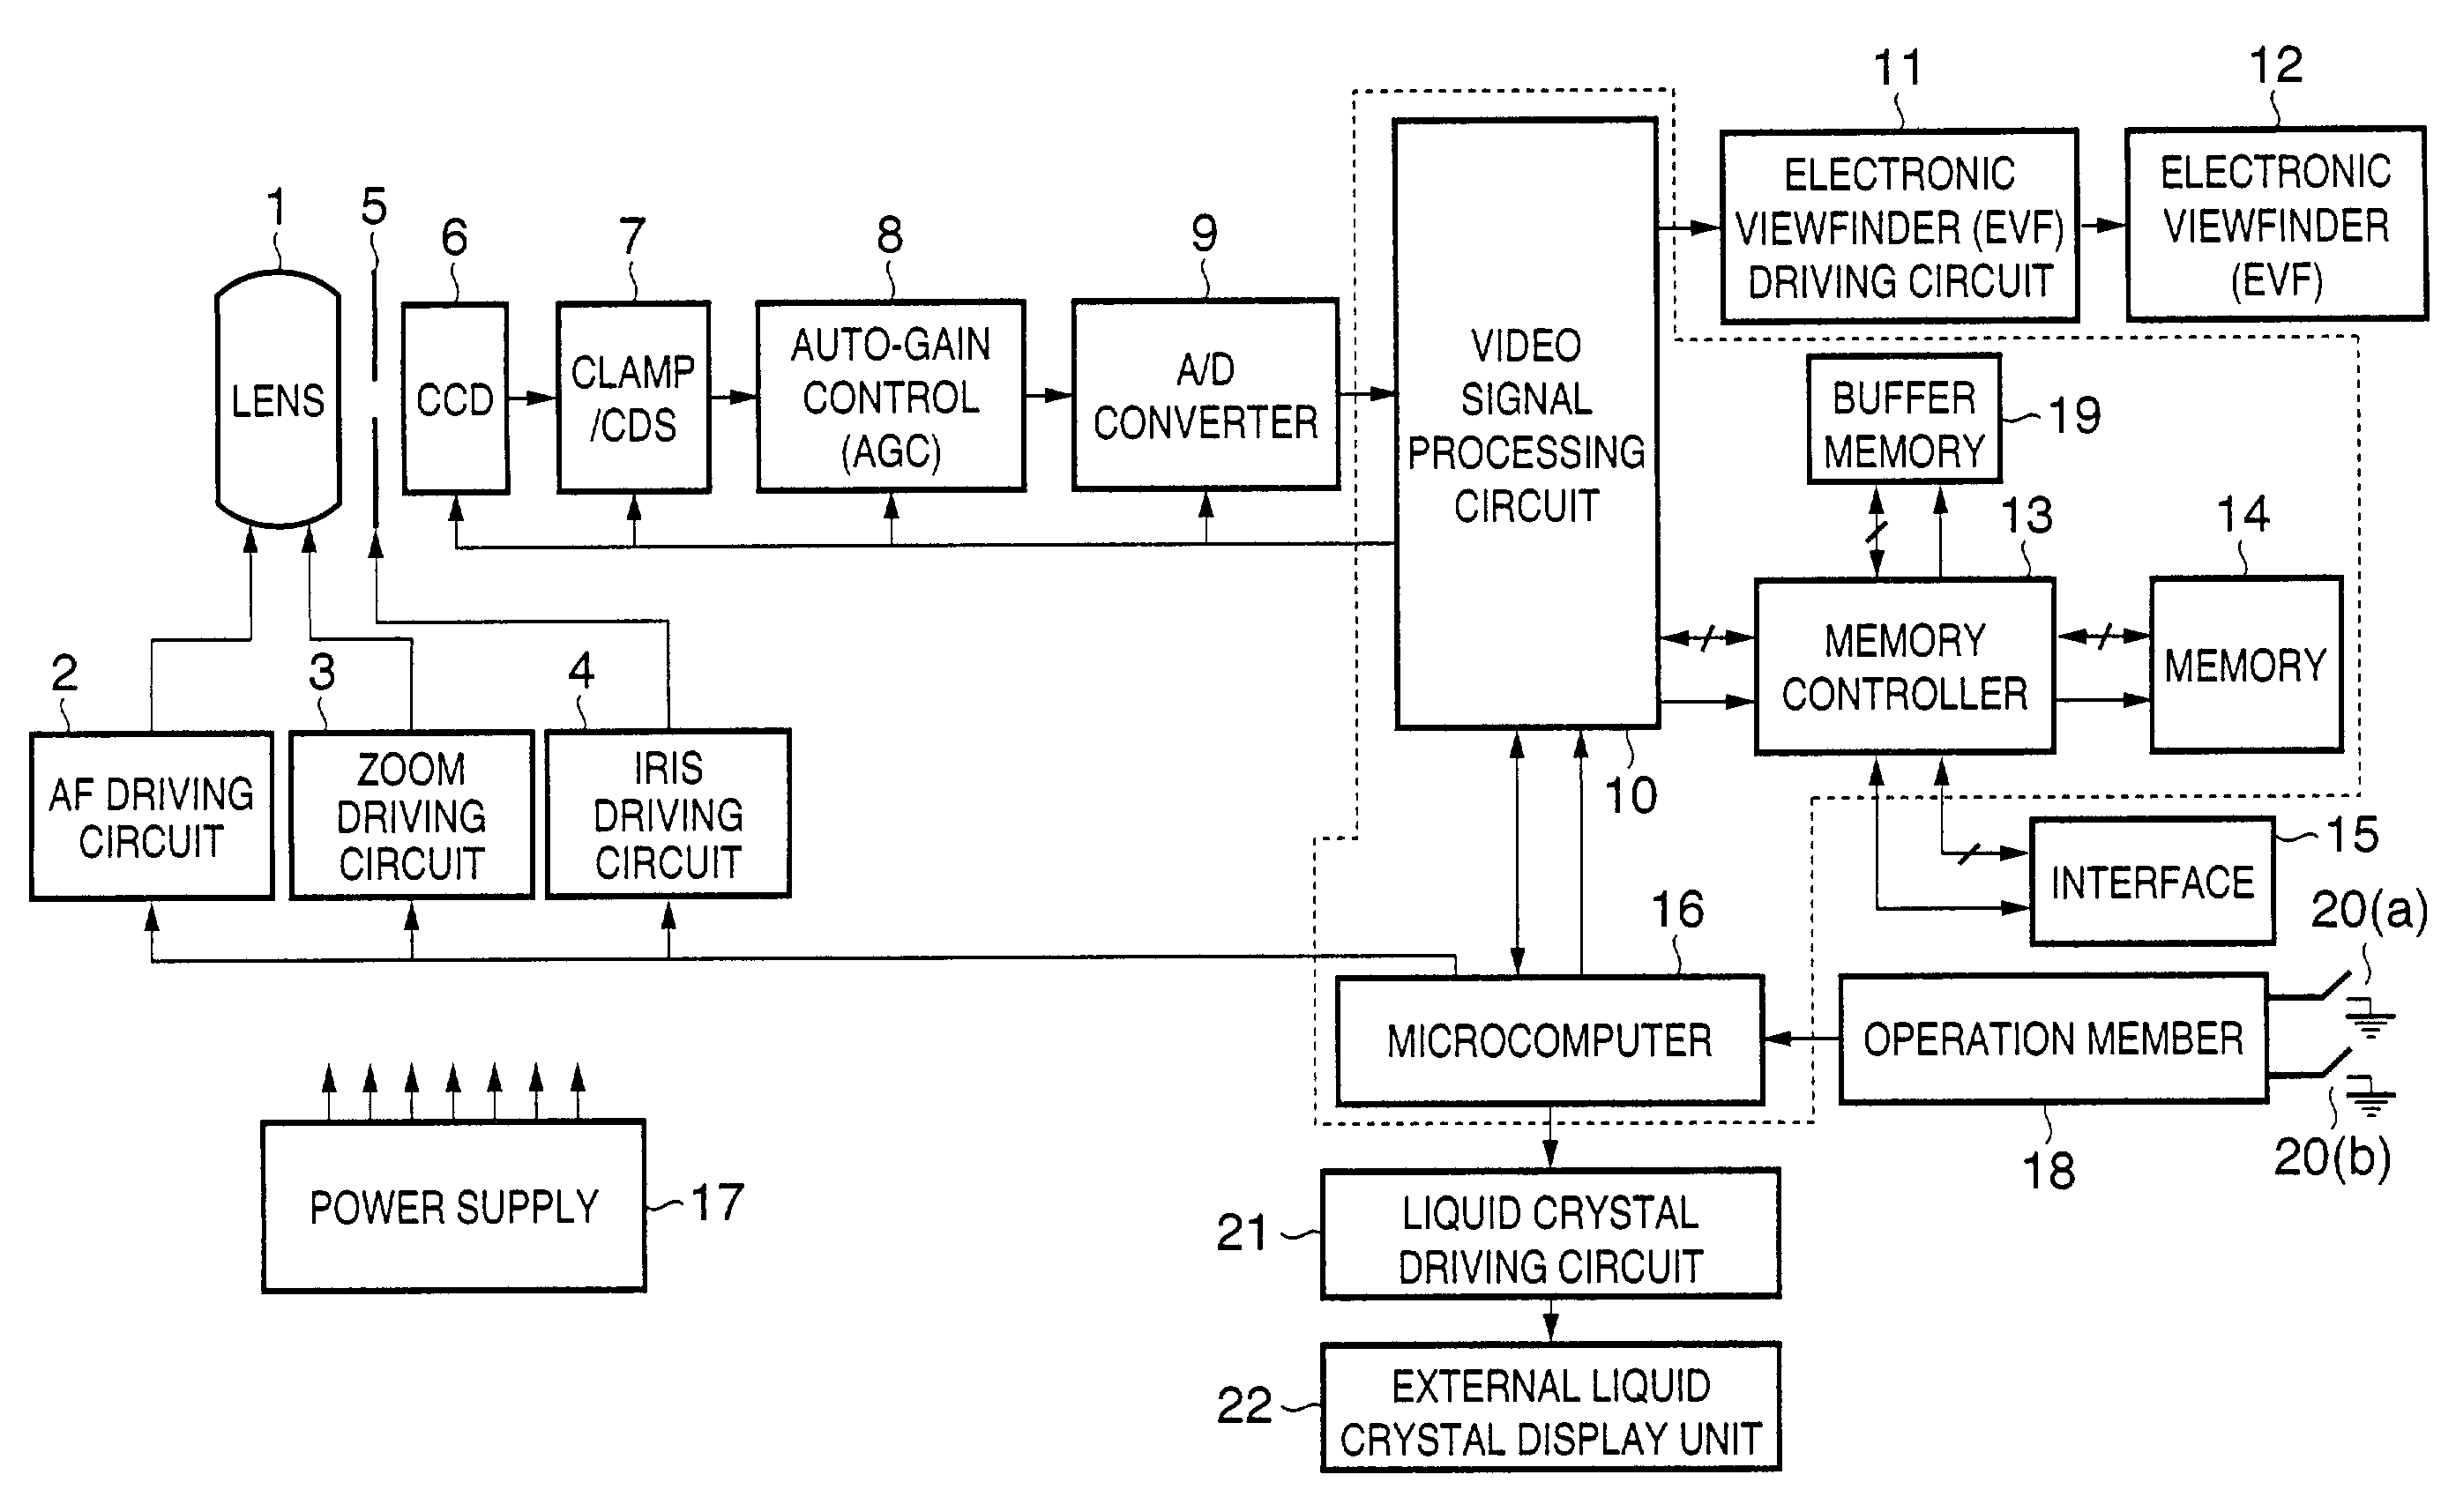
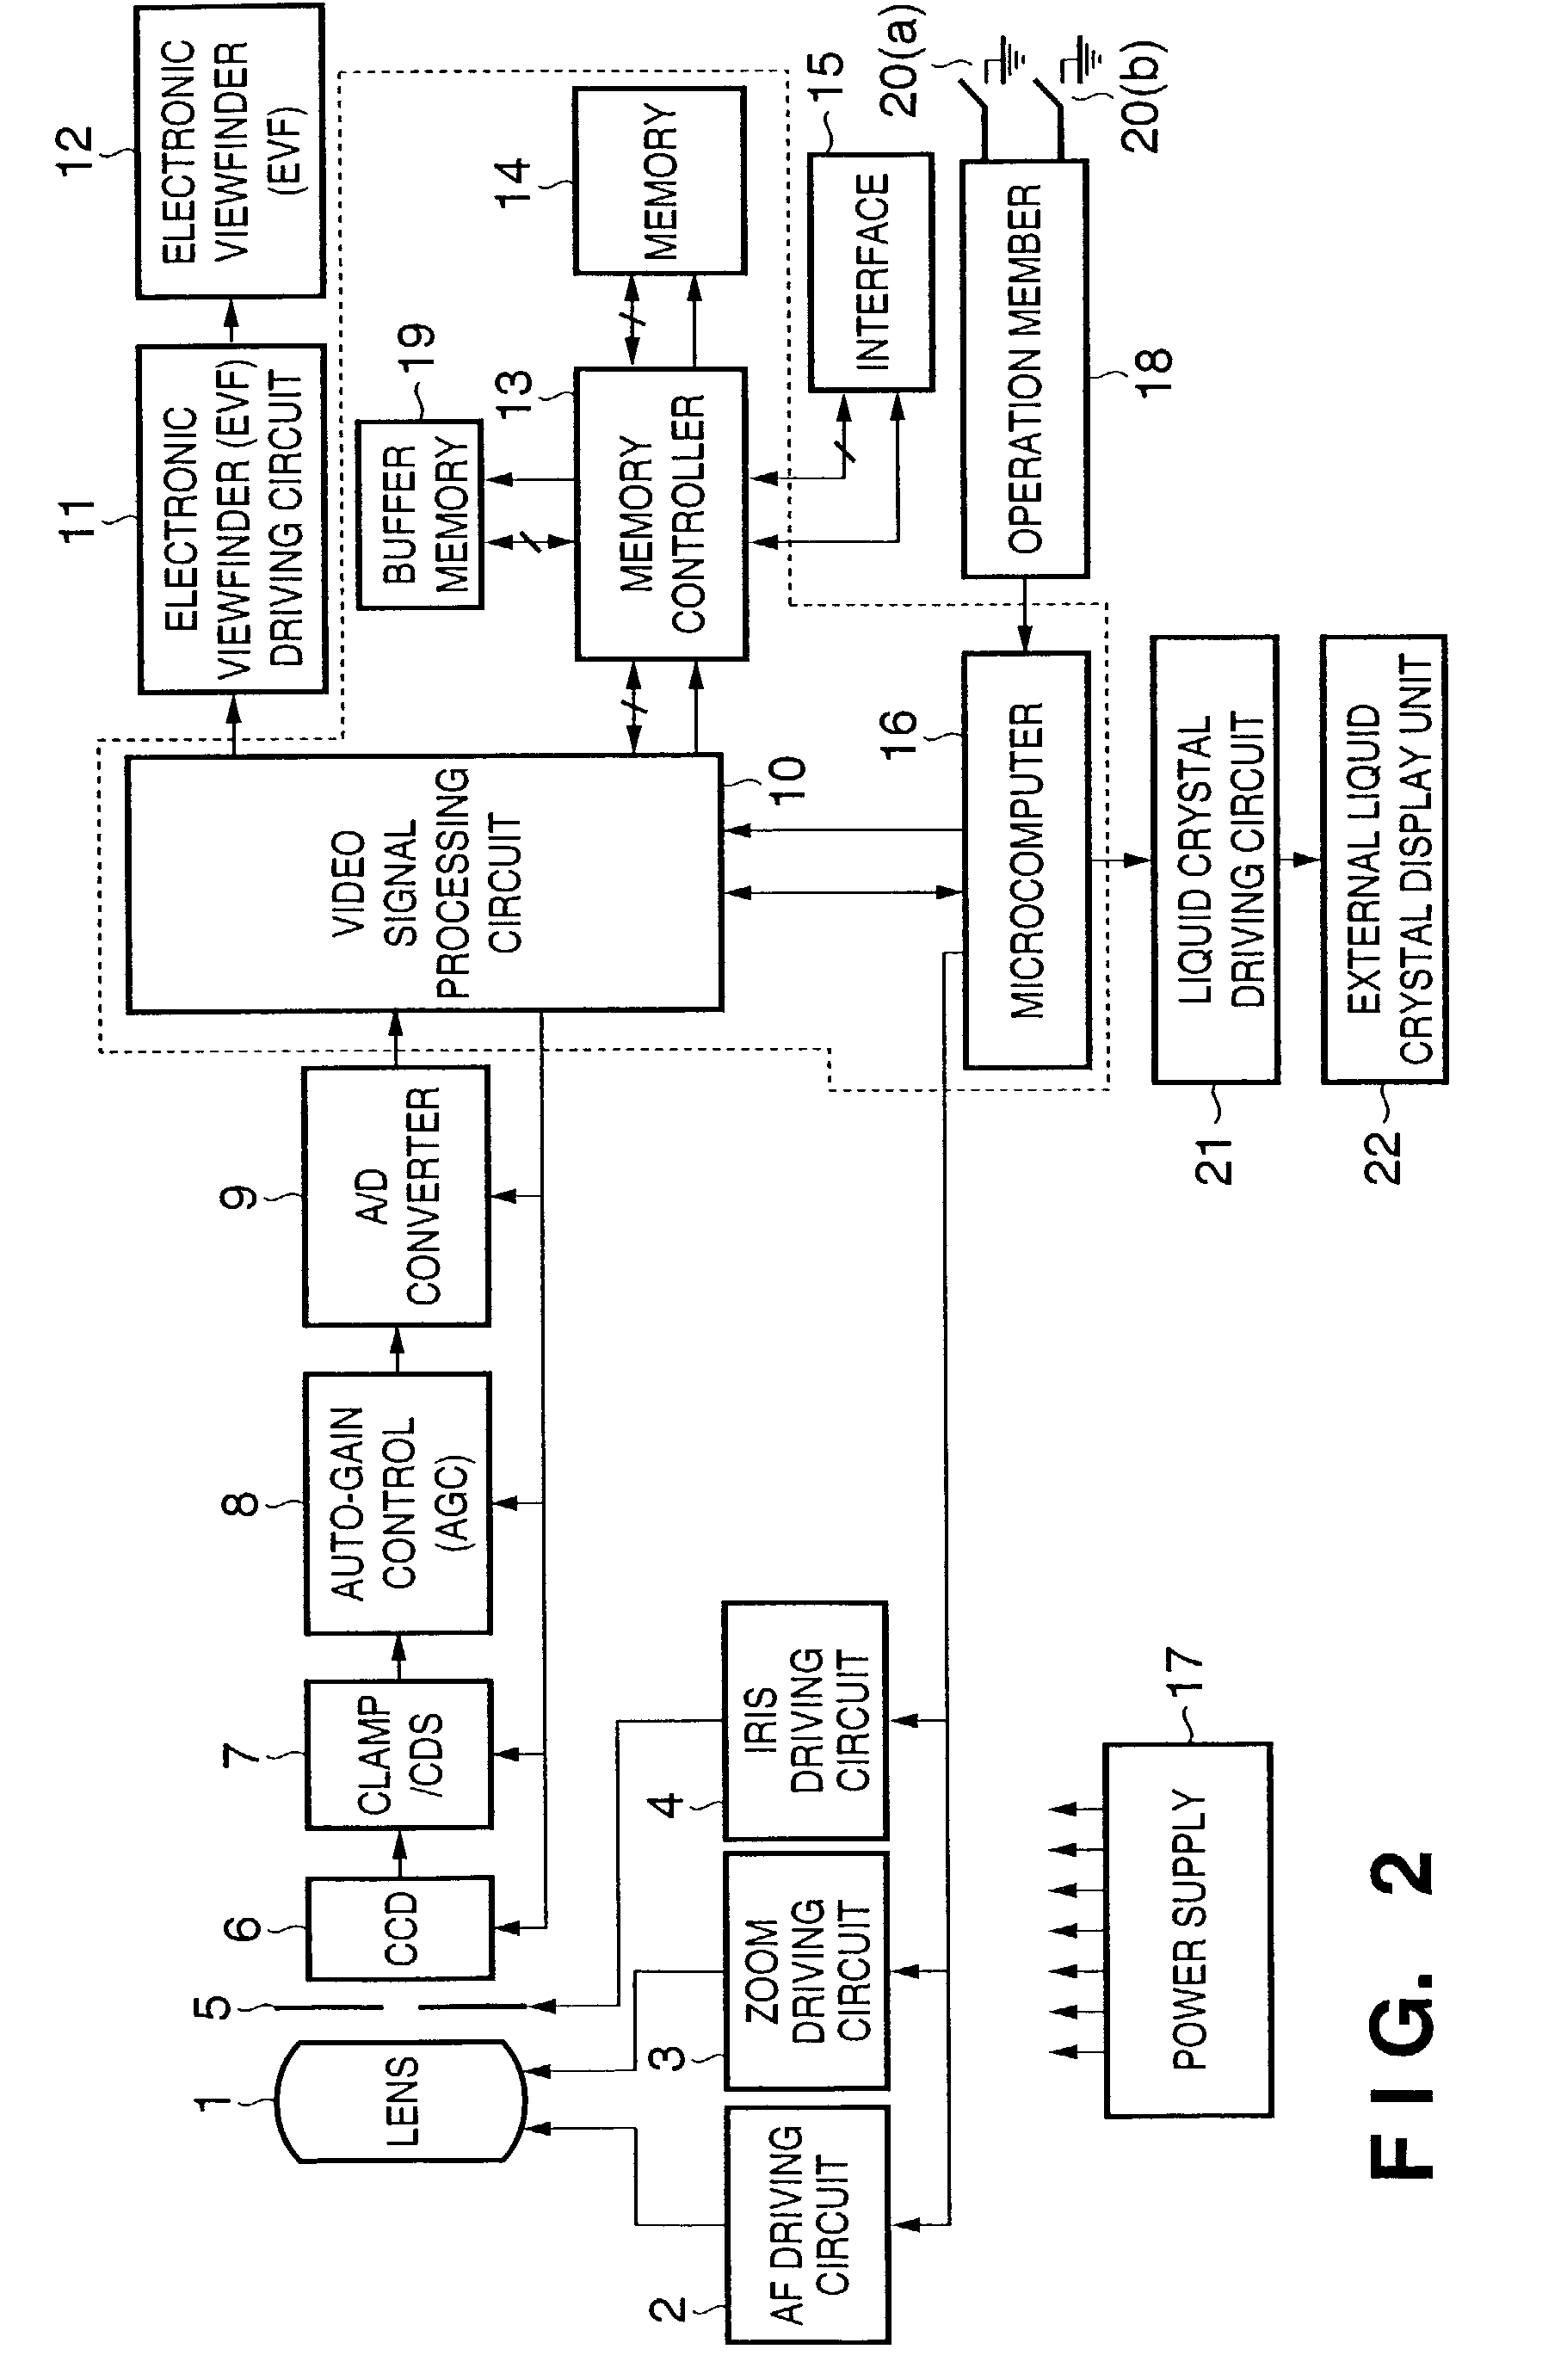
[0089][Arrangement of Image Sensing Apparatus: FIG. 2]
[0090]Note that the arrangement of the image sensing apparatus that mounts an image processing apparatus of the second embodiment is the same as that of the first embodiment, which has been explained using FIG. 2. Therefore, since the block diagram that shows the arrangement of an image sensing apparatus which mounts an image processing apparatus of the second embodiment and its description are redundant, a description thereof will be omitted.
[0091][Operation in Photographing Mode: FIG. 3]
[0092]The operation of the image sensing apparatus in the photographing mode used in the second embodiment will be described below.
[0093]The basic operation of the image sensing apparatus in the photographing mode used in the second embodiment is substantially the same as that in the first embodiment that has been explained using FIG. 3, except for the process in step S307 in FIG. 3.
[0094]In the following description of the second embodiment, a repetitive description of FIG. 3 will be avoided, and only a characteristic feature of the second embodiment, which is different from the first embodiment, will be explained using FIG. 5. In the following description, a method of displaying histograms on the electronic viewfinder using G components of the entire range of the image sensing frame of image data, and a partial range selected from the entire image sensing range of image data will be exemplified. However, the process to be described below is not limited to G components, may use R or B components or luminance signal.
[0095][Histogram Display on EVF: FIG. 5]
[0096]The operation in the photographing mode starts in step S500.
[0097]It is checked in step S501 based on the operation member 18 if the histogram display mode is ON or OFF. If the histogram display mode is OFF, the flow jumps to step S507 to display an image alone.
[0098]If it is determined in step S501 based on the operation member 18 that the histogram display mode is ON, the flow advances to step S502 to calculate a histogram on the basis of G components of entire image data.
[0099]The current photometry mode set by the operation member 18 is checked in step S503. If an average or split photometry mode is set, the flow jumps to step S507 without any process; if the spot or partial photometry mode is set, the flow advances to step S504.
[0100]The current photometry mode set by the operation member 18 is checked in step S504. If a spot photometry mode is set, the flow advances to step S505; if a partial photometry mode is set, the flow advances to step S506.
[0101]In step S505, a histogram is calculated using G components of image data corresponding to a spot area 61 shown in FIG. 6A, and the flow then advances to step S507.
[0102]On the other hand, in step S506 a histogram is calculated using G components of image data corresponding to a partial photometry area 62 shown in FIG. 6B, and the flow then advances to step S507.
[0103]In step S507, image data to be sent to the EVF driving circuit 11 is generated on the basis of the histogram of the entire image calculated in step S502, and that of image data within the selected photometry area calculated in step S505 or S506. As image data to be sent to the EVF driving circuit 11, a histogram may be superimposed on an image, or a small image and histogram may be displayed side by side.
[0104]In step S508, a series of operations end.
[0105]As described above, the image sensing apparatus of the second embodiment has a function of inhibiting display of the histogram of image data within a specific range when the relationship between the photometry area and principal object is ambiguous, in addition to the function of the image sensing apparatus of the first embodiment.
[0106]That is, the image sensing apparatus of the second embodiment has a function of displaying the histograms of the selected range and entire image data, as has been proposed in the first embodiment, and also a function of displaying only the histogram of the entire image data and inhibiting display of the histogram of image data within a specific range when a photometry area for which it is nonsense to display the histogram of only a specific range of image data photometry area is selected.
[0107]For this reason, only when a spot or partial photometry area is selected, whether or not a principal object can undergo appropriate exposure can be easily determined by displaying two different histograms, as shown in, e.g., FIG. 4B, and a principal object can undergo appropriate exposure upon photographing.
[0108]In the first embodiment, the image sensing apparatus which can calculate the histogram of image data corresponding to a given photometry range when the selected photometry mode is, e.g., a partial or spot photometry mode, in addition to the histogram of the entire image data, and can identifiably superimpose both the histograms of the entire image data and the selected range, and its image sensing method have been explained.
Example
[0109]On the other hand, in the third embodiment to be described below, the selected photometry mode corresponds to a selected range within an in-focus ranging point mark (e.g., a point determined to have a highest contrast or the nearest distance from a plurality of specific areas) controlled by, e.g., the AF driving circuit 2, video signal processing circuit 10, and microcomputer 16.
[0110]In case of the third embodiment, an image sensing apparatus which can calculate the histogram of image data corresponding to the selected range within the in-focus ranging point mark, and can identifiably superimpose it on the histogram of the entire image data, and its image sensing method will be explained.
[0111][Arrangement of Image Sensing Apparatus: FIG. 2]
[0112]Note that the arrangement of the image sensing apparatus that mounts an image processing apparatus of the third embodiment is the same as that of the first embodiment, which has been explained using FIG. 2. Therefore, since the block diagram that shows the arrangement of an image sensing apparatus which mounts an image processing apparatus of the third embodiment and its description are redundant, a detailed description thereof will be omitted.
[0113][Operation in Photographing Mode: FIG. 3]
[0114]The operation of the image sensing apparatus in the photographing mode used in the third embodiment will be described below.
[0115]The basic operation of the image sensing apparatus in the photographing mode used in the third embodiment is substantially the same as that of the first embodiment described using FIG. 3, except for the process in step S307 in FIG. 3.
[0116]In the following description of the third embodiment, only the process in step S307 in FIG. 3 will be explained, and a description of other steps will be omitted since it is redundant. Also, a characteristic feature of the third embodiment, which is different from the first embodiment, will be explained using FIG. 7.
[0117]The operation of the image sensing apparatus in the photographing mode used in the third embodiment will be described below using the flow chart in FIG. 3.
[0118]The operations from the beginning of the operation in the photographing mode in step S300 until the operation for capturing image data from the CCD 6 via the clamp/CDS circuit 7→ AGC 8→ A/D converter 9 in step S304 are the same as those described in the first embodiment, and a repetitive description thereof will be avoided.
[0119]In step S305, the lens driving amount is calculated and determined based on focus information as an output from the video signal processing circuit 10, and the focus lens in the lens 1 is driven using this lens driving amount via the AF driving circuit 2, thus attaining focus adjustment.
[0120]A point where focus adjustment is to be made is determined from a plurality of specific areas by determining a point determined to have the highest contrast or nearest distance.
[0121]In step S306, a gain value to be sent to the AGC 8, an aperture value to be sent to the iris driving circuit 4, a digital shutter value used to control the CCD 6, and R and B gains used in the video signal processing circuit 10 are calculated and determined on the basis of the exposure condition and white balance information as outputs from the video signal processing circuit 10 so as to control these circuits to obtain an appropriate brightness and color.
[0122]In step S307, a display image and histogram are calculated based on an image signal captured in step S304, and the calculation results are sent to the EVF driving circuit 11, which displays the image and histogram on the EVF 12. The histogram calculation process will be described later using the flow chart in FIG. 7.
[0123]Note that the subsequent operations from steps S308 to S318 are the same as those in the first embodiment, and a repetitive description thereof will be avoided.
[0124]In the following description, a method of displaying the histograms on the electronic viewfinder using G components of the entire range of the image sensing frame of image data, and a partial range selected from the entire image sensing range of image data will be exemplified. However, the process to be described below is not limited to G components, and may use R or B components or luminance signal.
[0125][Histogram Display on EVF: FIG. 7]
[0126]A characteristic feature of the third embodiment will be described below using the flow chart shown in FIG. 7.
[0127]The process shown in the flow chart in FIG. 7 is included in step S307 in FIG. 3.
[0128]The process starts in step S700.
[0129]It is checked in step S701 based on the operation member 18 if the histogram display mode is ON or OFF. If the histogram display mode is OFF, the flow jumps to step S704 to display an image alone.
[0130]If it is determined in step S701 based on the operation member 18 that the histogram display mode is ON, the flow advances to step S702 to calculate a histogram on the basis of G components of entire image data.
[0131]In step S703, a histogram is calculated using G components of image data corresponding to the focal point range which is determined in step S305 in FIG. 3 and in which focus adjustment is to be made. FIG. 8A shows an example of three-point ranging. When a left ranging point corresponds to a focal point, a histogram is calculated using G components of image data within an area 800.
[0132]In step S704, image data to be sent to the EVF driving circuit 11 is generated on the basis of the histogram of the entire image calculated in step S702, and that of image data within the focal point area calculated in step S703.
[0133]As image data to be sent to the EVF driving circuit 11, a histogram may be superimposed on an image, or a small image and histogram may be displayed side by side.
[0134]In step S705, a series of operations end.
[0135]As described above, since the image sensing apparatus of the third embodiment has a function of displaying the histograms of the selected focal point area range and the entire image data, whether or not a principal object can undergo appropriate exposure can be easily determined by displaying two different histograms, as shown in, e.g., FIG. 4B, and a principal object can undergo appropriate exposure upon photographing.
PUM


Description & Claims & Application Information
We can also present the details of the Description, Claims and Application information to help users get a comprehensive understanding of the technical details of the patent, such as background art, summary of invention, brief description of drawings, description of embodiments, and other original content. On the other hand, users can also determine the specific scope of protection of the technology through the list of claims; as well as understand the changes in the life cycle of the technology with the presentation of the patent timeline. Login to view more.