Monitoring and control of droplet sorting

a droplet sorting and monitoring technology, applied in the field of flow cytometer systems, can solve the problems of adversely affecting the performance of the electrostatic sorter, affecting the quality of the droplet sorting, and requiring an operator to monitor these parameters constantly, so as to achieve the effect of enhancing the image and reducing the nois

Inactive Publication Date: 2005-09-06
COULTER INTERNATIONAL CORPORATION
View PDF15 Cites 137 Cited by
  • Summary
  • Abstract
  • Description
  • Claims
  • Application Information

AI Technical Summary

Benefits of technology

[0088]After background subtraction, the images of the selected portions of the jet are processed using devices, computers, or techniques known in the art for image enhancement, among other functions known to those of skill in the art. See FIGS. 2D and 2E. An additional method of enhancing the image also includes techniques including extracting stream edge conditions by counting the pixels from one edge to the first dark pixel, then by counting from the opposite edge on the same line to the first dark pixel see, FIG. 2F.
[0089]After generating the multiple images from the imaging means and enhancing these multiple images, the images are processed to generate from the multiple images an averaged numerical reference standard representative of a stable sort for that sample type. Similar techniques are used to generate running average sample values for comparison to the reference standard.
[0090]In general, the processor of the flow cytometer takes a group of multiple successive images of an ideal or stable sort as described by the user of the method. Image processing and statistical analysis techniques known to those of skill in the art are employed to obtain a histogram for each image, or an average histogram based on multiple images for each group of multiple images. See FIG. 3. Preferably one-dimensional histograms of the images are generated by performing an integral operation along the Y-axis of the resultant image for each and every pixel along the X-axis of the resultant image. The desired multiple of images, e.g., 10, is used to provide ten histograms from which calculations are made. Alternatively, the multiple of histograms are averaged into a single averaged histogram from which a single value is derived. Each one-dimensional histogram or single averaged histogram is characterized by a downstream and upstream direction on the X axis, at least one neck region, and at least one undulation downstream of the neck region. The histograms generally contain multiple undulations having different sizes and correlating with each portion of the jet over time, including the necks, the last attached drop, the first and second free drops, satellites and the subsequent multiple wavelength periods. Each undulation of the histograms therefore includes a positive slope and a negative slope, a maximum value of peak height, peak width, distances between peaks, e.g., generally necks, and uniformity or inconsistency of peak sizes and shapes.
[0091]A number of software programs can be utilized to generate histograms from images and include the Scion Image program (Scion, Frederick, Md.) and MS Excel (Microsoft Corporation, California). Still other conventional statistics textbooks are available for instruction on creating a histogram. Noise that is not removed by background subtraction from the individual images may also be minimized by performing the histogram operation along the X-axis to establish upper and lower boundaries in the resultant image by scanning for some minimum pixel threshold before generating the histogram data along the X-axis as described below.
[0092]In one embodiment, therefore, a multiple of images from a stable sort are converted into individual histograms. From each histogram, a selected numerical value is calculated. The values from each histogram of the group of multiple histograms is then averaged to create the numerical reference standard. See FIG. 4A. An alternative method of generating the numerical reference standard is by converting the multiple images of the stable sort into a single average histogram and determining from the single average histogram a selected numerical average value that defines the numerical reference standard. The numerical averaged reference standard thus represents an ideal sort. Once the reference standard is established, the sample sort is run and groups of running multiples of images of the sample sort are collected, and individual or averaged sample histograms are generated as described above. At least one numerical sample average which corresponds to the reference standard is calculated which is comparable to the reference standard. Thus, in one embodiment, the multiple sample images are converted into individual sample histograms, and from each histogram a selected numerical value corresponding to the reference standard is determined. These numerical values from the multiple sample histograms of the multiple sample images are averaged to create at least one numerical sample average of the sample sort of each collection of multiple running images. Alternatively, the group of multiple sample images is converted into a single average sample and a selected numerical sample average value of the sample sort of each collection of multiple running images is generated from the average histogram.
[0093]The reference standard and the sample averages are generated from the histograms discussed above by the application of algorithms to the histograms.

Problems solved by technology

Typically, sorting of the droplets containing the sample particles is accomplished over an extended period of time during which environmental changes can adversely influence the performance of an electrostatic sorter.
It is both costly and tedious for an operator to be constantly monitoring these parameters and the sort performance.
However, the amount of contrast improvement is limited, and additional image manipulation can remove detail and alter the true image so that proper control is not ideal.

Method used


Image

  • Monitoring and control of droplet sorting
  • Monitoring and control of droplet sorting
  • Monitoring and control of droplet sorting

Examples


example 1

Performance of the Method: Multiple Imaging / Generation of Numerical Averages from Histograms

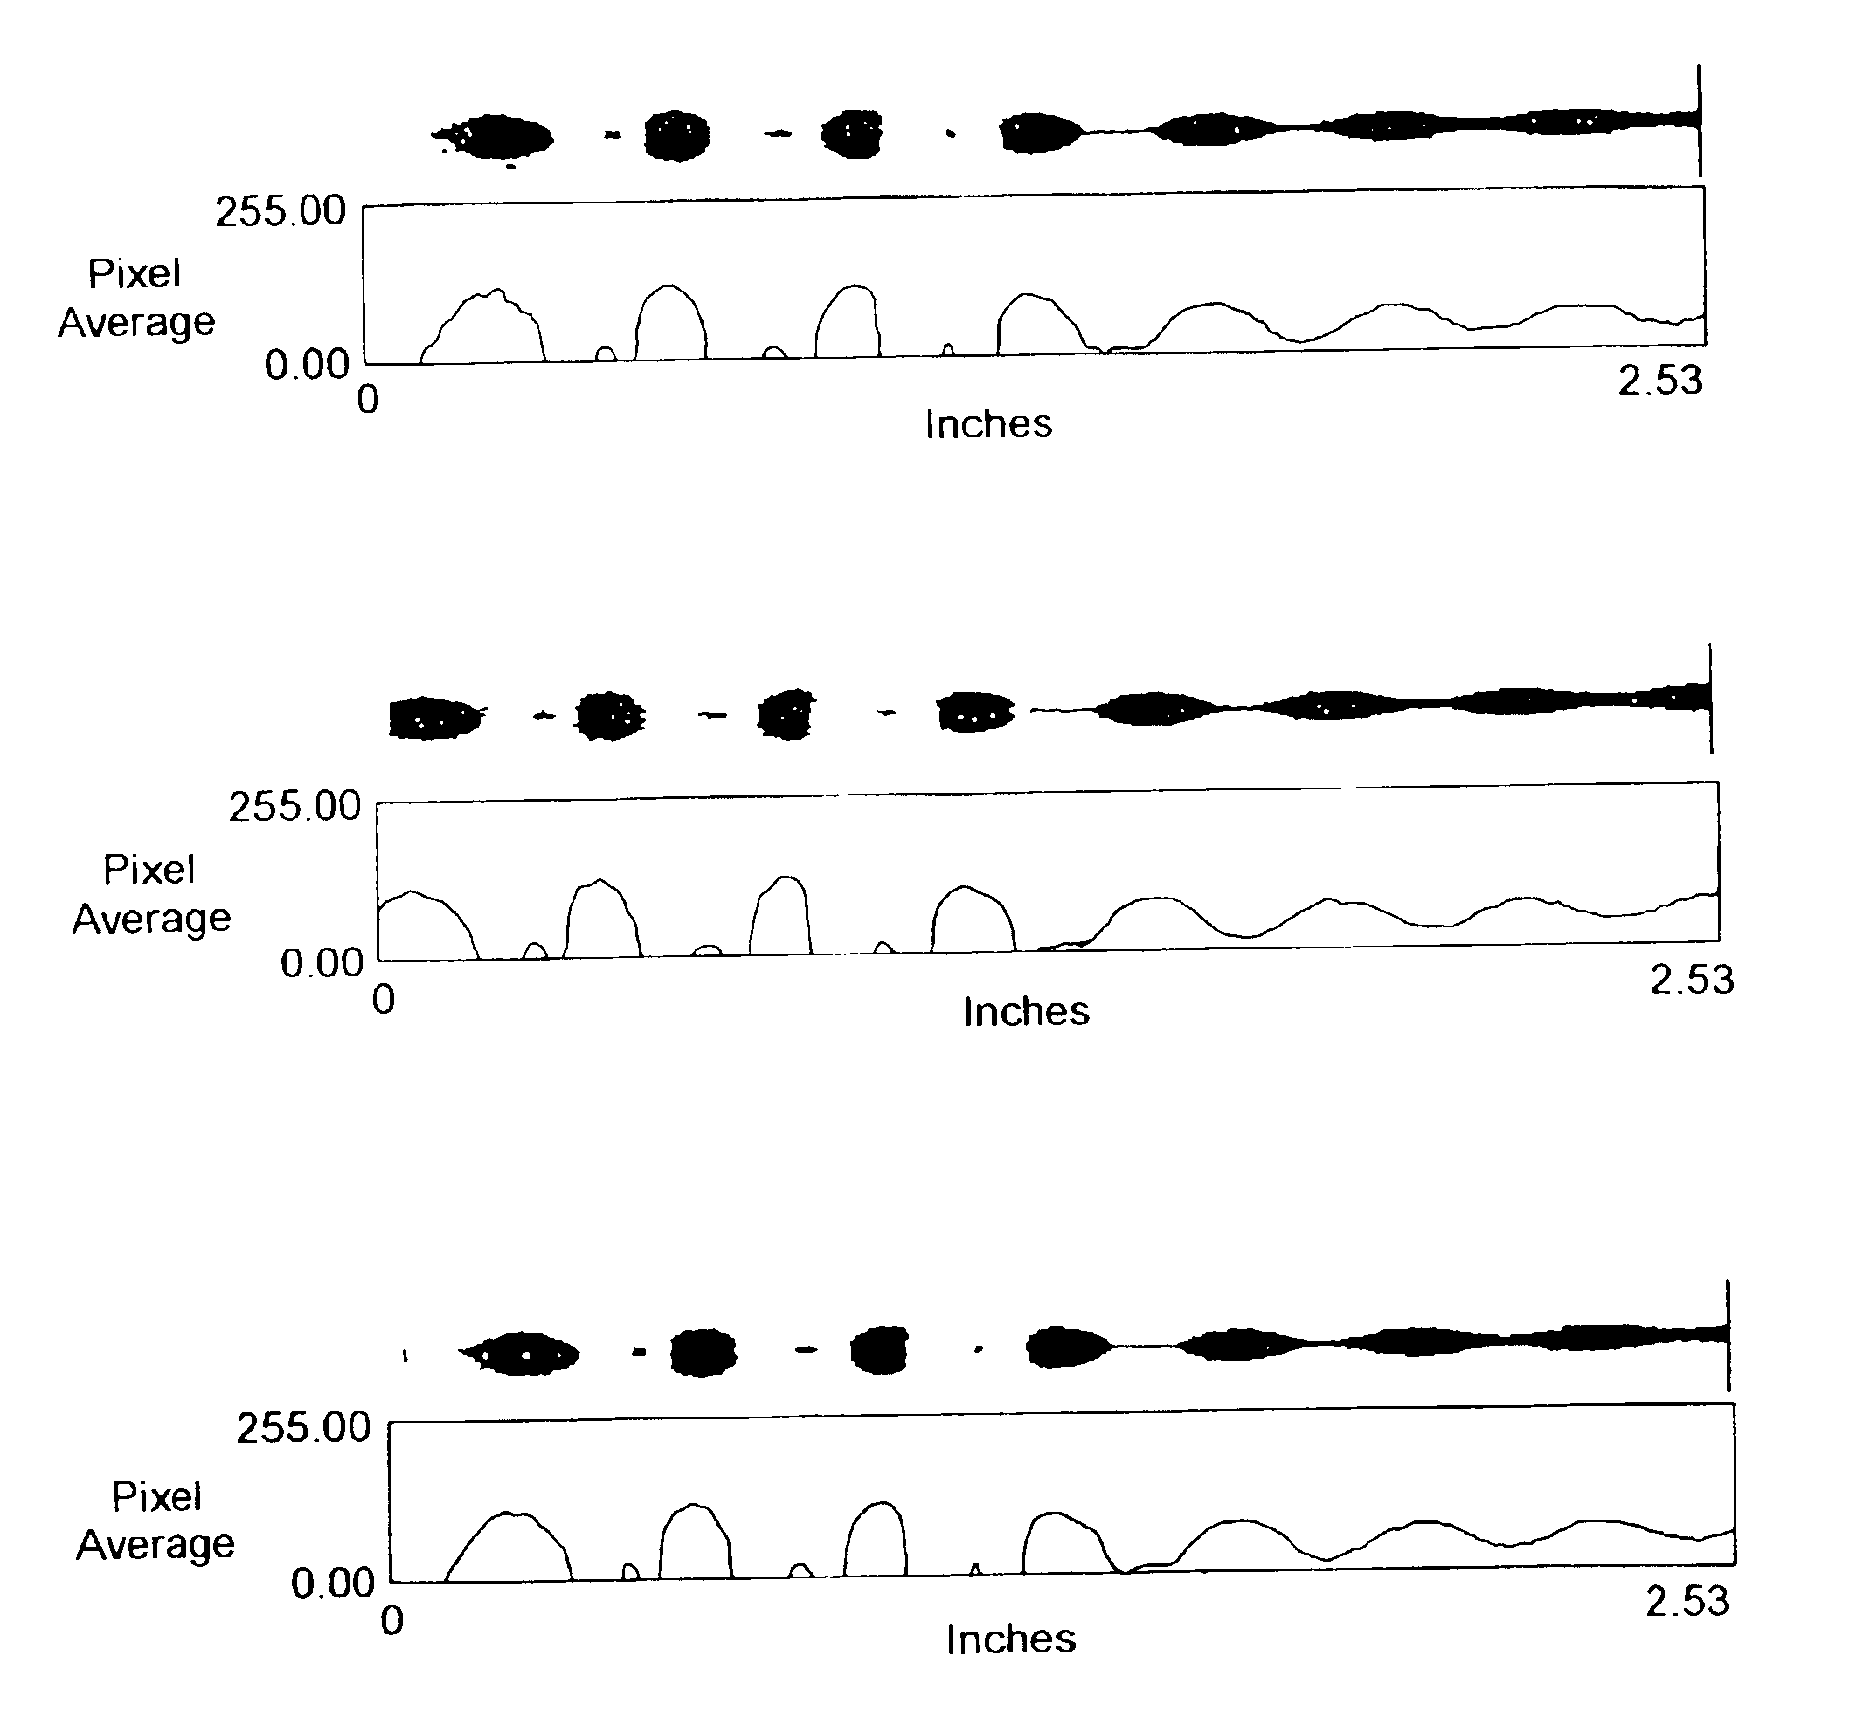
[0138]This example demonstrates how the method and system of this invention enables the cytometer operator to maintain the stability of the sort in the event of a change in condition, e.g., a temperature change. According to this invention, the operator obtains images of the stream, specifically a selected region of the stream, generates a histogram display thereof, analyzes the histogram data to generate the reference standard and sample average values, and makes corrections for the change in temperature to stabilize the sort.

[0139]An isotonic sheath fluid with no sample particles was introduced into a commercial flow sorter, e.g., the COULTER® ELITE™ flow cytometer or the COULTER® EPICS® ALTRA™ flow cytometer (Beckman Coulter, Inc, Miami, Fla.). As imaging means, these cytometers contain an integrated CCD video camera, a commercial video digitizing processor (Integral Technologies, Indianap...

example 2

Energy Coupling Variation

[0147]This example demonstrates the effectiveness of the present invention to obtain images of a stream, specifically a selected region of the stream, to analyze this region of the stream, and to make corrections in the sort where the change in sort conditions is caused by a change in energy coupling efficiency. Energy coupling efficiency can dampen the growth of the disturbance causing breakoff and correspondingly, affects the breakoff point. Energy coupling efficiency is the amount of energy transferred from the oscillator to the stream.

[0148]The method and system of this invention is performed as initially described in Example 1, except that after the reference histogram for a stable sort was established (FIG. 5A), the reference standards were calculated as 0.900 for the slope and 380 for the midpoint. A change in sort conditions resulted in a multiple (10) running consecutive sample histogram of FIG. 5B. The corresponding sample average was obtained by a...


PUM

PropertyMeasurementUnit
pressuresaaaaaaaaaa
frequencyaaaaaaaaaa
voltageaaaaaaaaaa

Abstract

Methods, systems and apparatus are provided for sorting particles in a stream of a sample in a flow cytometer by producing from a stable sort having desirable sort characteristics multiple images of a portion of the stream; generating from the multiple images an averaged numerical reference standard representative of the stable sort; continuously collecting during the sorting multiple running images of the portion of the stream; generating from the multiple running images at least one numerical sample average representative of the sample sort of each collection of the multiple running images; and comparing each numerical sample average to the numerical reference standard and determining whether a sample average exhibits a deviation from the reference standard that requires an adjustment of the sort. The sort may then be adjusted to eliminate or reduce the deviation and maintain the stable sort of the reference histogram. A novel imaging apparatus may be employed in a flow cytometer performing this method.

Description

BACKGROUND OF THE INVENTION[0001]This invention relates in general to the field of flow cytometer systems for studying characteristics of a stream, including particles entrained in droplets of a stream, and particularly for monitoring and controlling droplet sorting and specifically droplet generation. The sorting of biological cells entrained in streams and the droplets thereof provides relatively pure samples for both biomedical research and clinical medicine. Various techniques of sorting cells using flow cytometry have been employed over the last two decades. See, e.g., Lindmo et al., “Flow Sorters for Biological Cells” in Flow Cytometry and Sorting, 2nd ed. Wiley-Liss, Inc.: New York, 1990, pages 145-169; and U.S. Pat. Nos. 3,710,933; 4,361,400; 4,981,580; 5,483,469; and 5,602,039, among others.[0002]Techniques used for cell sorting include flow sorters, such as flow cytometers. Conventional flow cytometers, such as illustrated in FIG. 1 of U.S. Pat. No. 6,079,836, include appa...

Claims


Application Information

Patent Timeline
Patent Type & Authority Patents(United States)
IPC IPC(8): G01N15/14
CPCG01N15/1425G01N15/1459Y10T436/115831G01N2015/1406G01N2015/149G01N15/1463
Inventor LARY, TODD P.SNOW, CHRISTOPHER W.RILEY, JOHN S.BURR, ROBERT C.
Owner COULTER INTERNATIONAL CORPORATION
Why Eureka
Try Eureka