System and method on generating multi-dimensional trace files and visualizing them using multiple Gantt charts

Inactive Publication Date: 2006-10-31
IBM CORP
View PDF22 Cites 57 Cited by
  • Summary
  • Abstract
  • Description
  • Claims
  • Application Information

AI Technical Summary

Benefits of technology

[0015]Advantageously, the system and method for providing multiple views for a multi-dimensional trace dataset is the elimination of trace file explosion currently suffered by other tr

Problems solved by technology

It is difficult to see an event in a time-space diagram, since a

Method used


Image

  • System and method on generating multi-dimensional trace files and visualizing them using multiple Gantt charts
  • System and method on generating multi-dimensional trace files and visualizing them using multiple Gantt charts
  • System and method on generating multi-dimensional trace files and visualizing them using multiple Gantt charts

Examples


Embodiment Construction

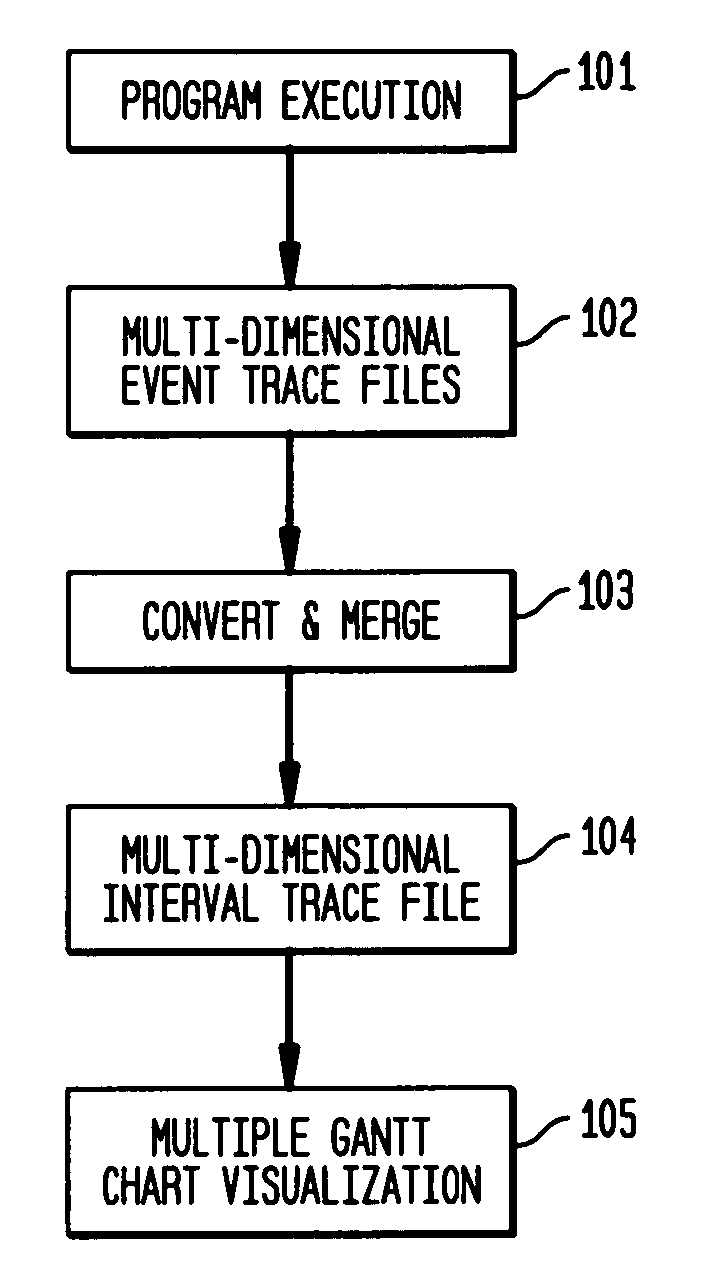
[0024]The invention relates to a system and method for collecting trace events and create multi-dimensional interval traces, and to visualize the multi-dimensional interval traces. Typically, these multi-dimensional traces are gathered from running systems and programs, such as parallel programs for technical computing and web server processes.

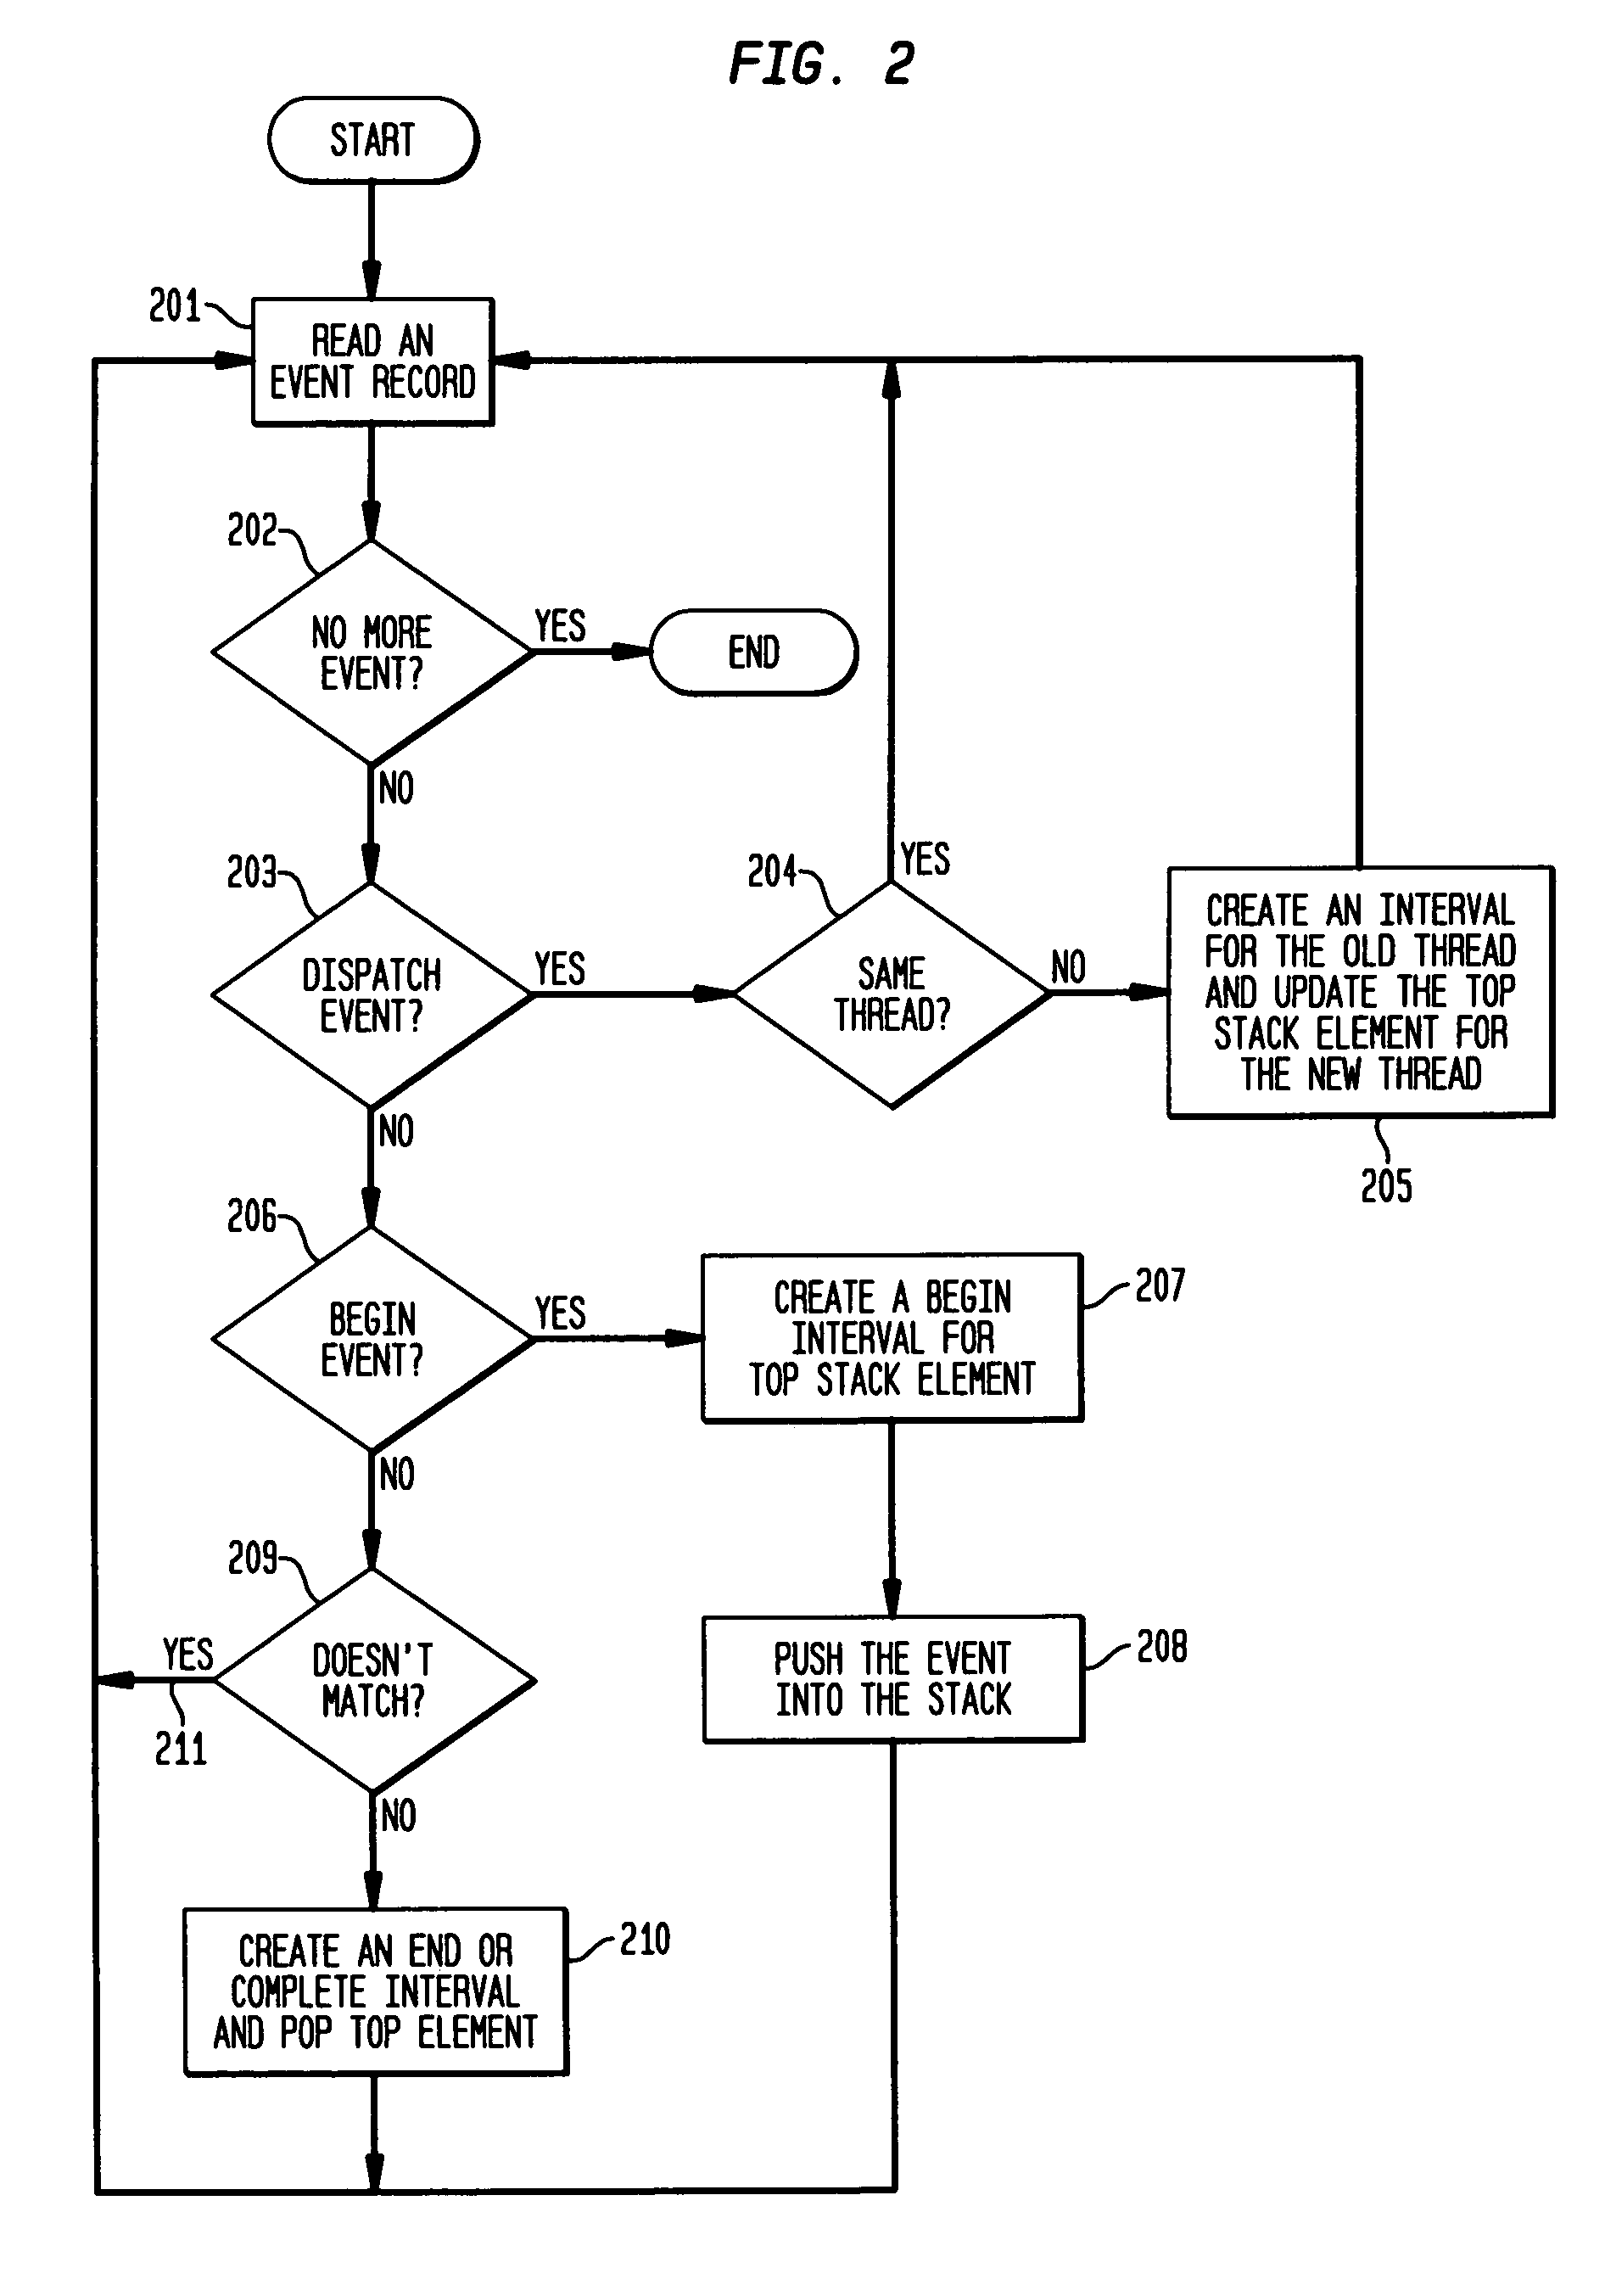
[0025]In an environment designed for program tracing and visualization, the execution of a program generates trace events of various types. Many existing tools generate trace events at the user level, such as the begin and end events of subroutine calls. The user-level begin and end events are then matched, by the visualization tool or a separate utility program, to calculate durations of various graphic objects to be displayed. The matching process is simple, since it matches basically the begin and end of the same record type.

[0026]A visualization tool may match the begin and end events of the same record type inside the visualization tool t...


PUM


Abstract

A system and method for visualizing data in two-dimensional time-space diagrams including generating multi-dimensional program trace files, converting and merging them into interval trace files, and generating multiple time-space diagrams (multiple Gantt charts) to visualize the resulting multi-dimensional interval trace files. The needed events and trace information required to form multi-dimensional event traces are described in event trace files typically gathered from running programs, such as parallel programs for technical computing and Web server processes. The method includes converting event traces into interval traces. In one selectable design, the two-dimensional time-space diagrams includes three discriminator types (thread, processor, and activity) and six discriminator-legend combinations, capable of producing seven possible views. The six discriminator-legend combinations are thread-activity, thread-processor, processor-thread, processor-activity, activity-thread, and activity-processor. Each discriminator-legend combination corresponds to one time-space diagram, except that the thread-activity combination has two possible views: Thread-Activity View and Connected Thread-Activity View.

Description

BACKGROUND OF THE INVENTION[0001]1. Field of the Invention[0002]The present invention relates generally to trace visualization schemes using multiple time-space diagrams (Gantt charts), and more particularly to a novel system and method for generating and visualizing multi-dimensional trace files using various views from different aspects.[0003]2. Description of the Prior Art[0004]The reason for poor performance of a program such as a Web server or a Message Passing Interface (MPI) program can be varied and complex, and users need to be able to understand and correct performance problems. Performance tools can help by monitoring a program's execution and producing performance data that can be analyzed to locate and understand areas of poor performance.[0005]One common way of monitoring a program's behavior is to generate trace events while executing the program. Trace data collected during program execution may then be used for debugging, visualization, and understanding the program...

Claims


Application Information

Patent Timeline
IPC IPC(8): G06F9/44H04L1/22
CPCG06F11/3636G06F11/3664
Inventor CHANG, RONG N.FRANKE, HUBERTUSWU, CHING-FARN E.
Owner IBM CORP
Why Eureka
Try Eureka