
System and method for determining and presenting differences in plant productivity in variable locations and environments

a variable location and environment technology, applied in the field of plant productivity testing, can solve the problems of many variables not being recorded, researchers hesitant to test in a variety of conditions, and many variables not being easily and accurately collected, etc., to achieve enhanced data, convenient use, and enhanced data

Inactive Publication Date: 2007-03-06
DIDO
View PDF27 Cites 9 Cited by
  • Summary
  • Abstract
  • Description
  • Claims
  • Application Information

AI Technical Summary

Benefits of technology

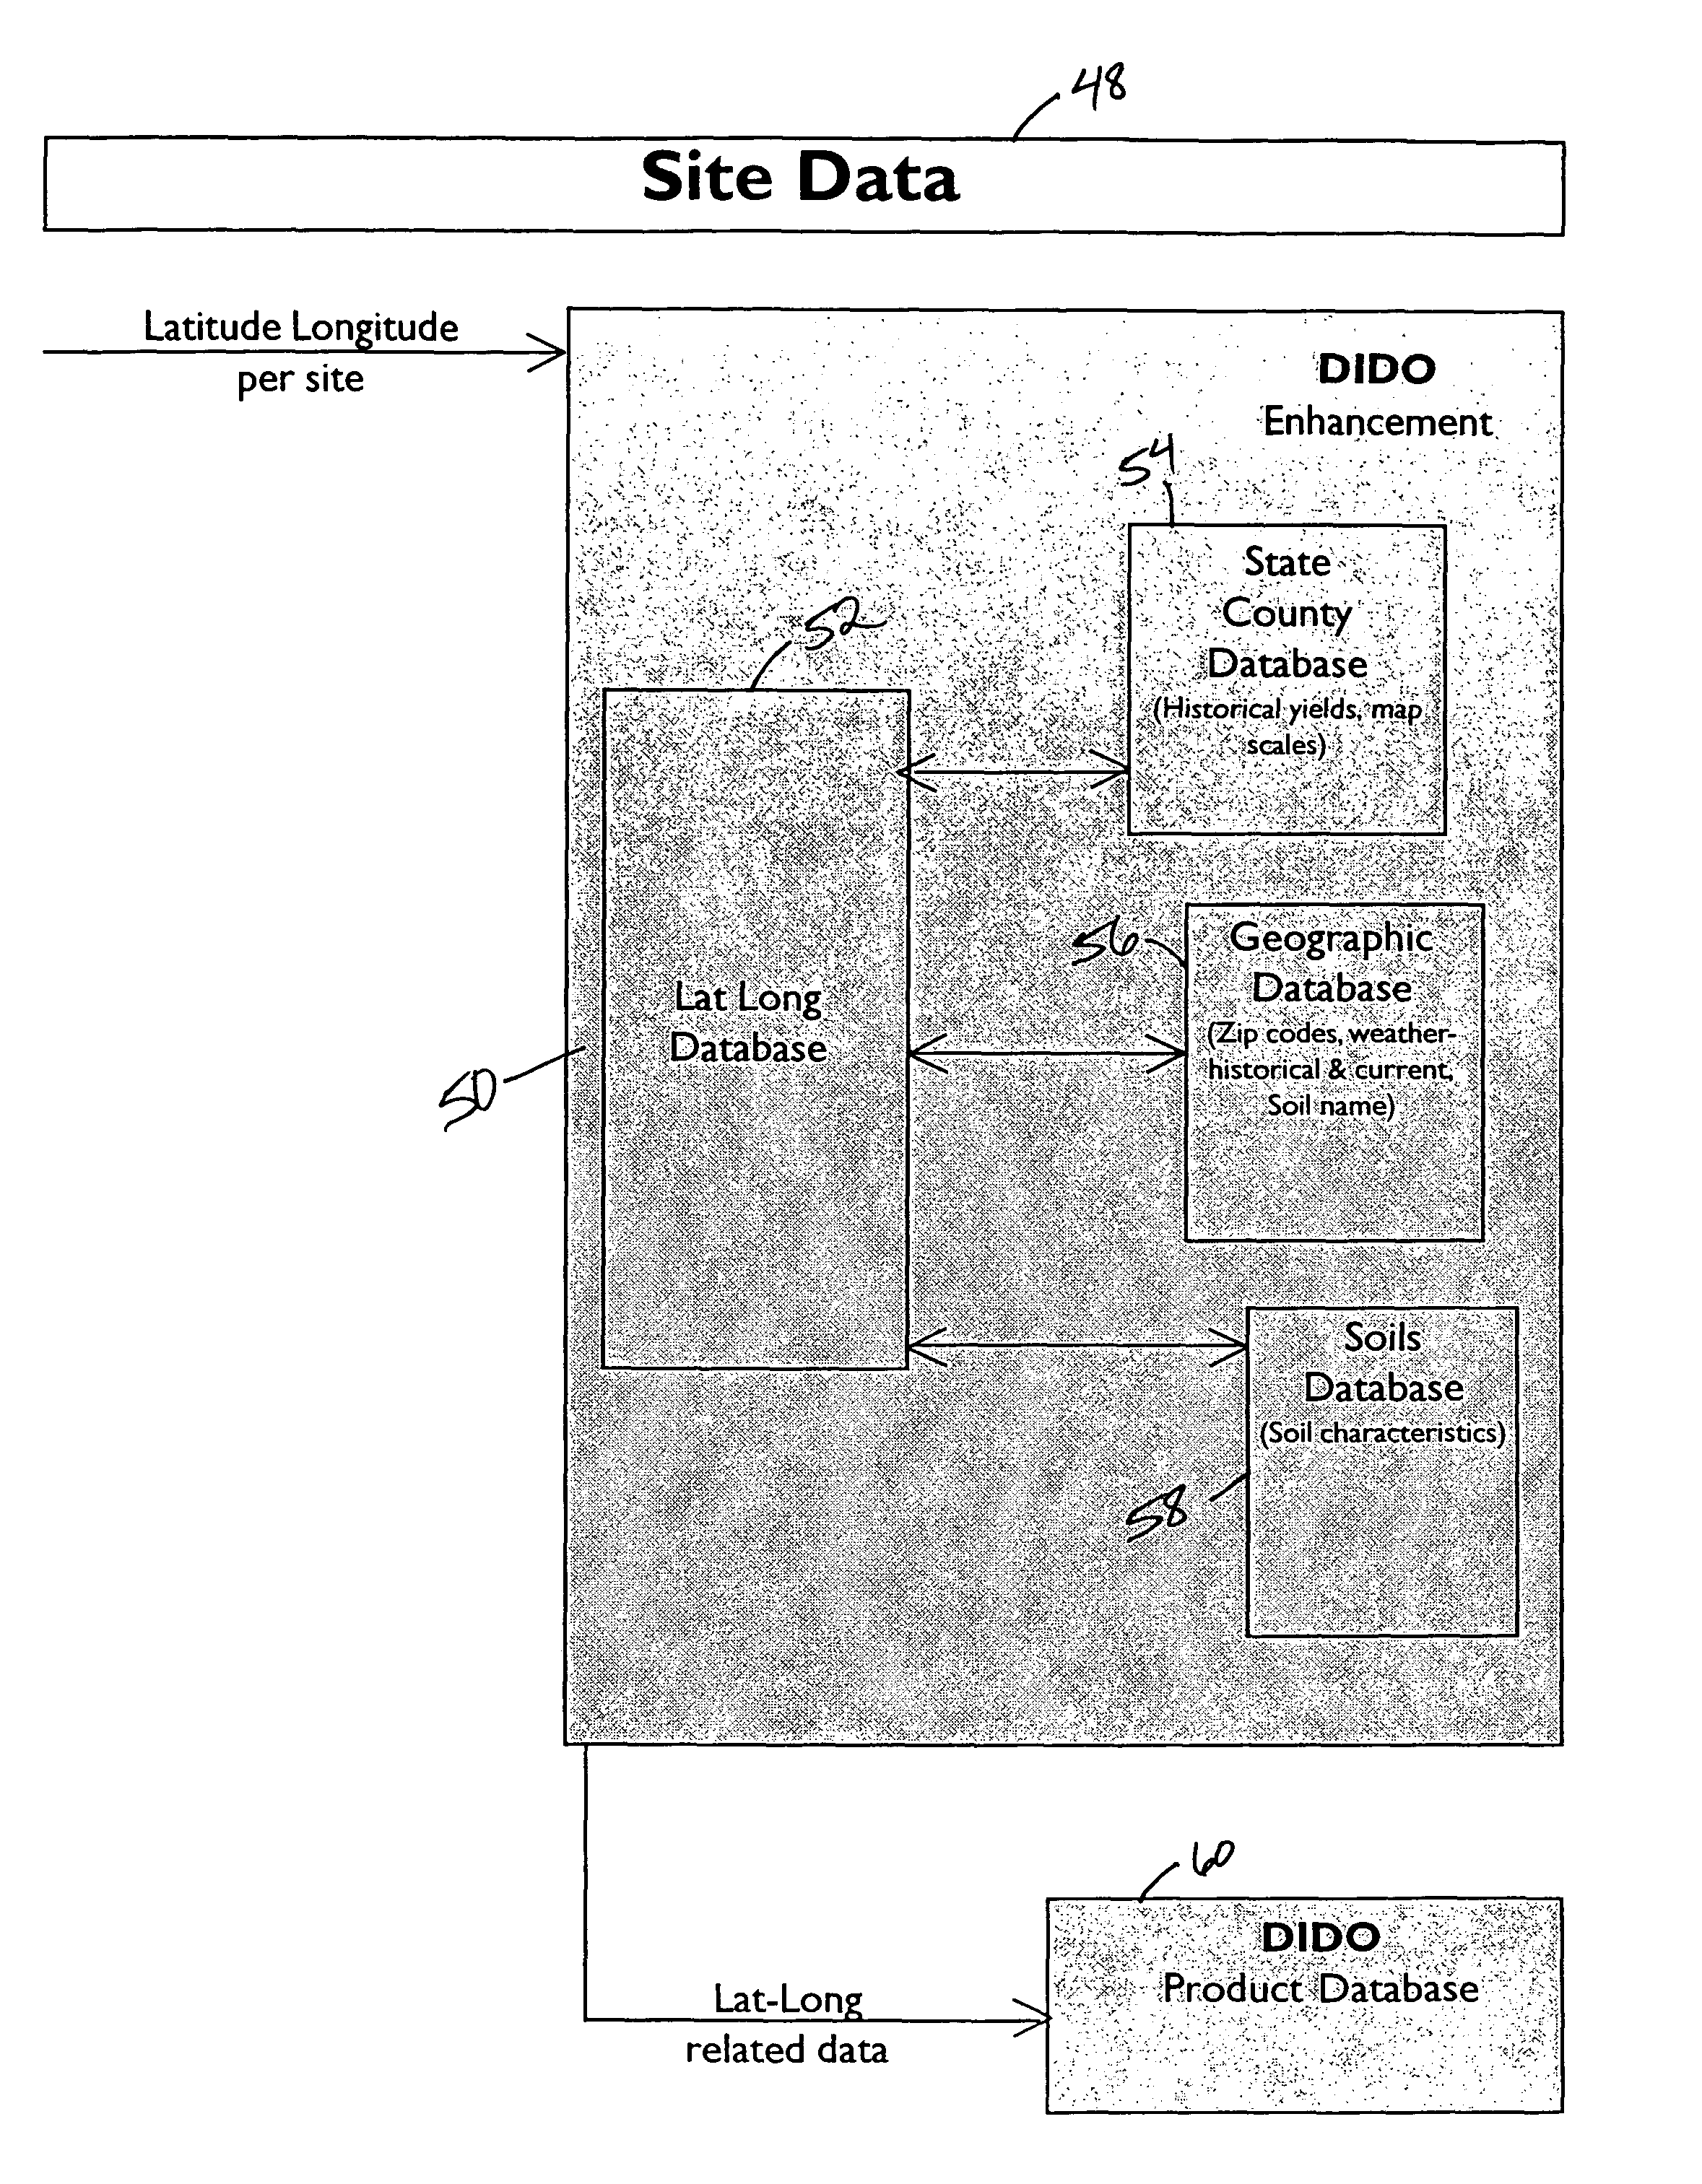
[0011]The present invention was developed to address several shortcomings of traditional data systems and to control access to data in a way that will attract data gathering. The present invention originated from a need to better organize and more fully comprehend all of the data available to foundation seed companies and private plant breeder programs, and analyze the data faster. Furthermore, the present invention enhances traditional data by adding very site specific characteristics, historical yield information such as geographic elevation, soil type characteristics and weather information. The present invention couples geographic information and product information with the accuracy of a GPS system. It combines the accuracy of GPS with the accuracy of research testing equipment and systems.
[0034]Accordingly, it is an object of the present invention to provide a data system that is larger, easier to use and highly enhanced over any other data source available.

Problems solved by technology

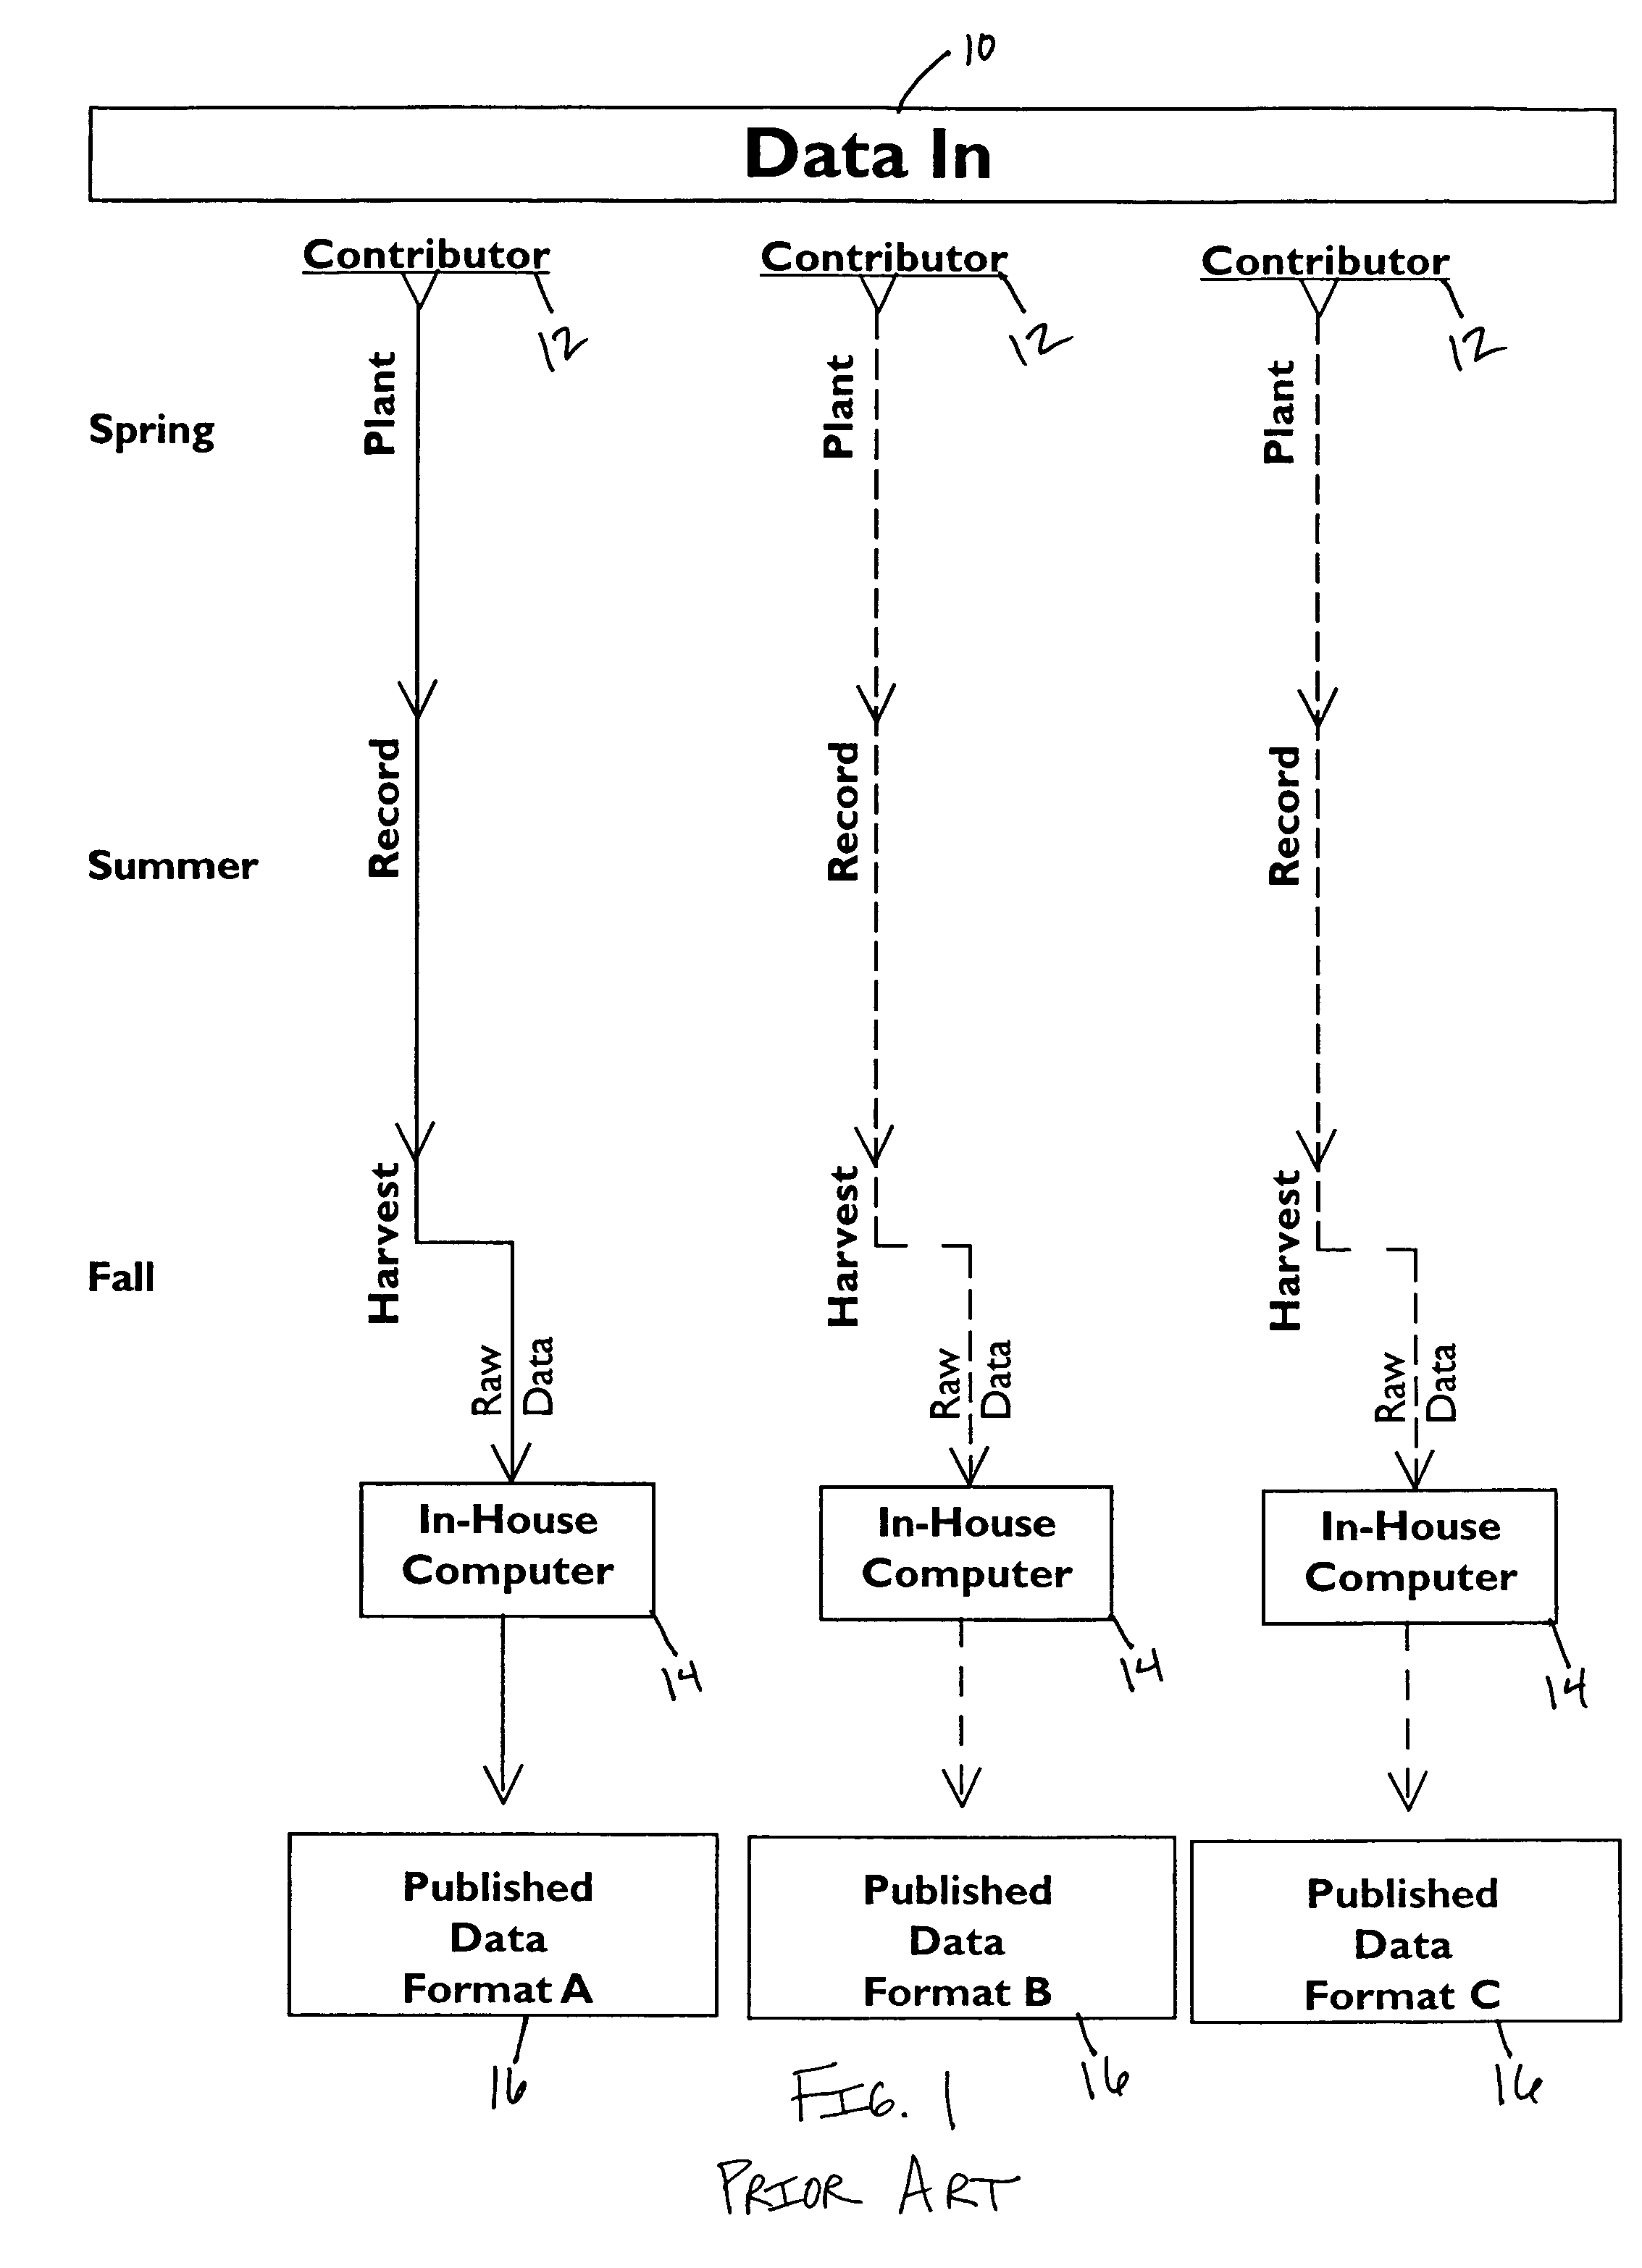
However, all of the data is separate and different, and they all publish it in their own way.
There is currently no method to connect the data.
With no environment measure, researchers are hesitant to test in a variety of conditions.
Plant population and design of the plots has been controlled, to a degree, but many variables have not been recorded or cannot be easily and accurately collected.
Another problem is that much of the data is proprietary and not available for analysis.
Proprietary testing systems have also made it difficult to compare differences in plant productivity.
There is no accurate method to analyze data between different data sources.
More data is being generated about more seed products than ever before, yet no method or process exists to combine and analyze the data.
Large books and binders of expensive data from seed companies are piled on dusty shelves.
With the explosion in the number of seed products, it will only become more difficult to make product choices.
This is at a time when mistakes will be more harmful as growers demand performance from higher priced products.

Method used


Image

  • System and method for determining and presenting differences in plant productivity in variable locations and environments
  • System and method for determining and presenting differences in plant productivity in variable locations and environments
  • System and method for determining and presenting differences in plant productivity in variable locations and environments

Examples


Embodiment Construction

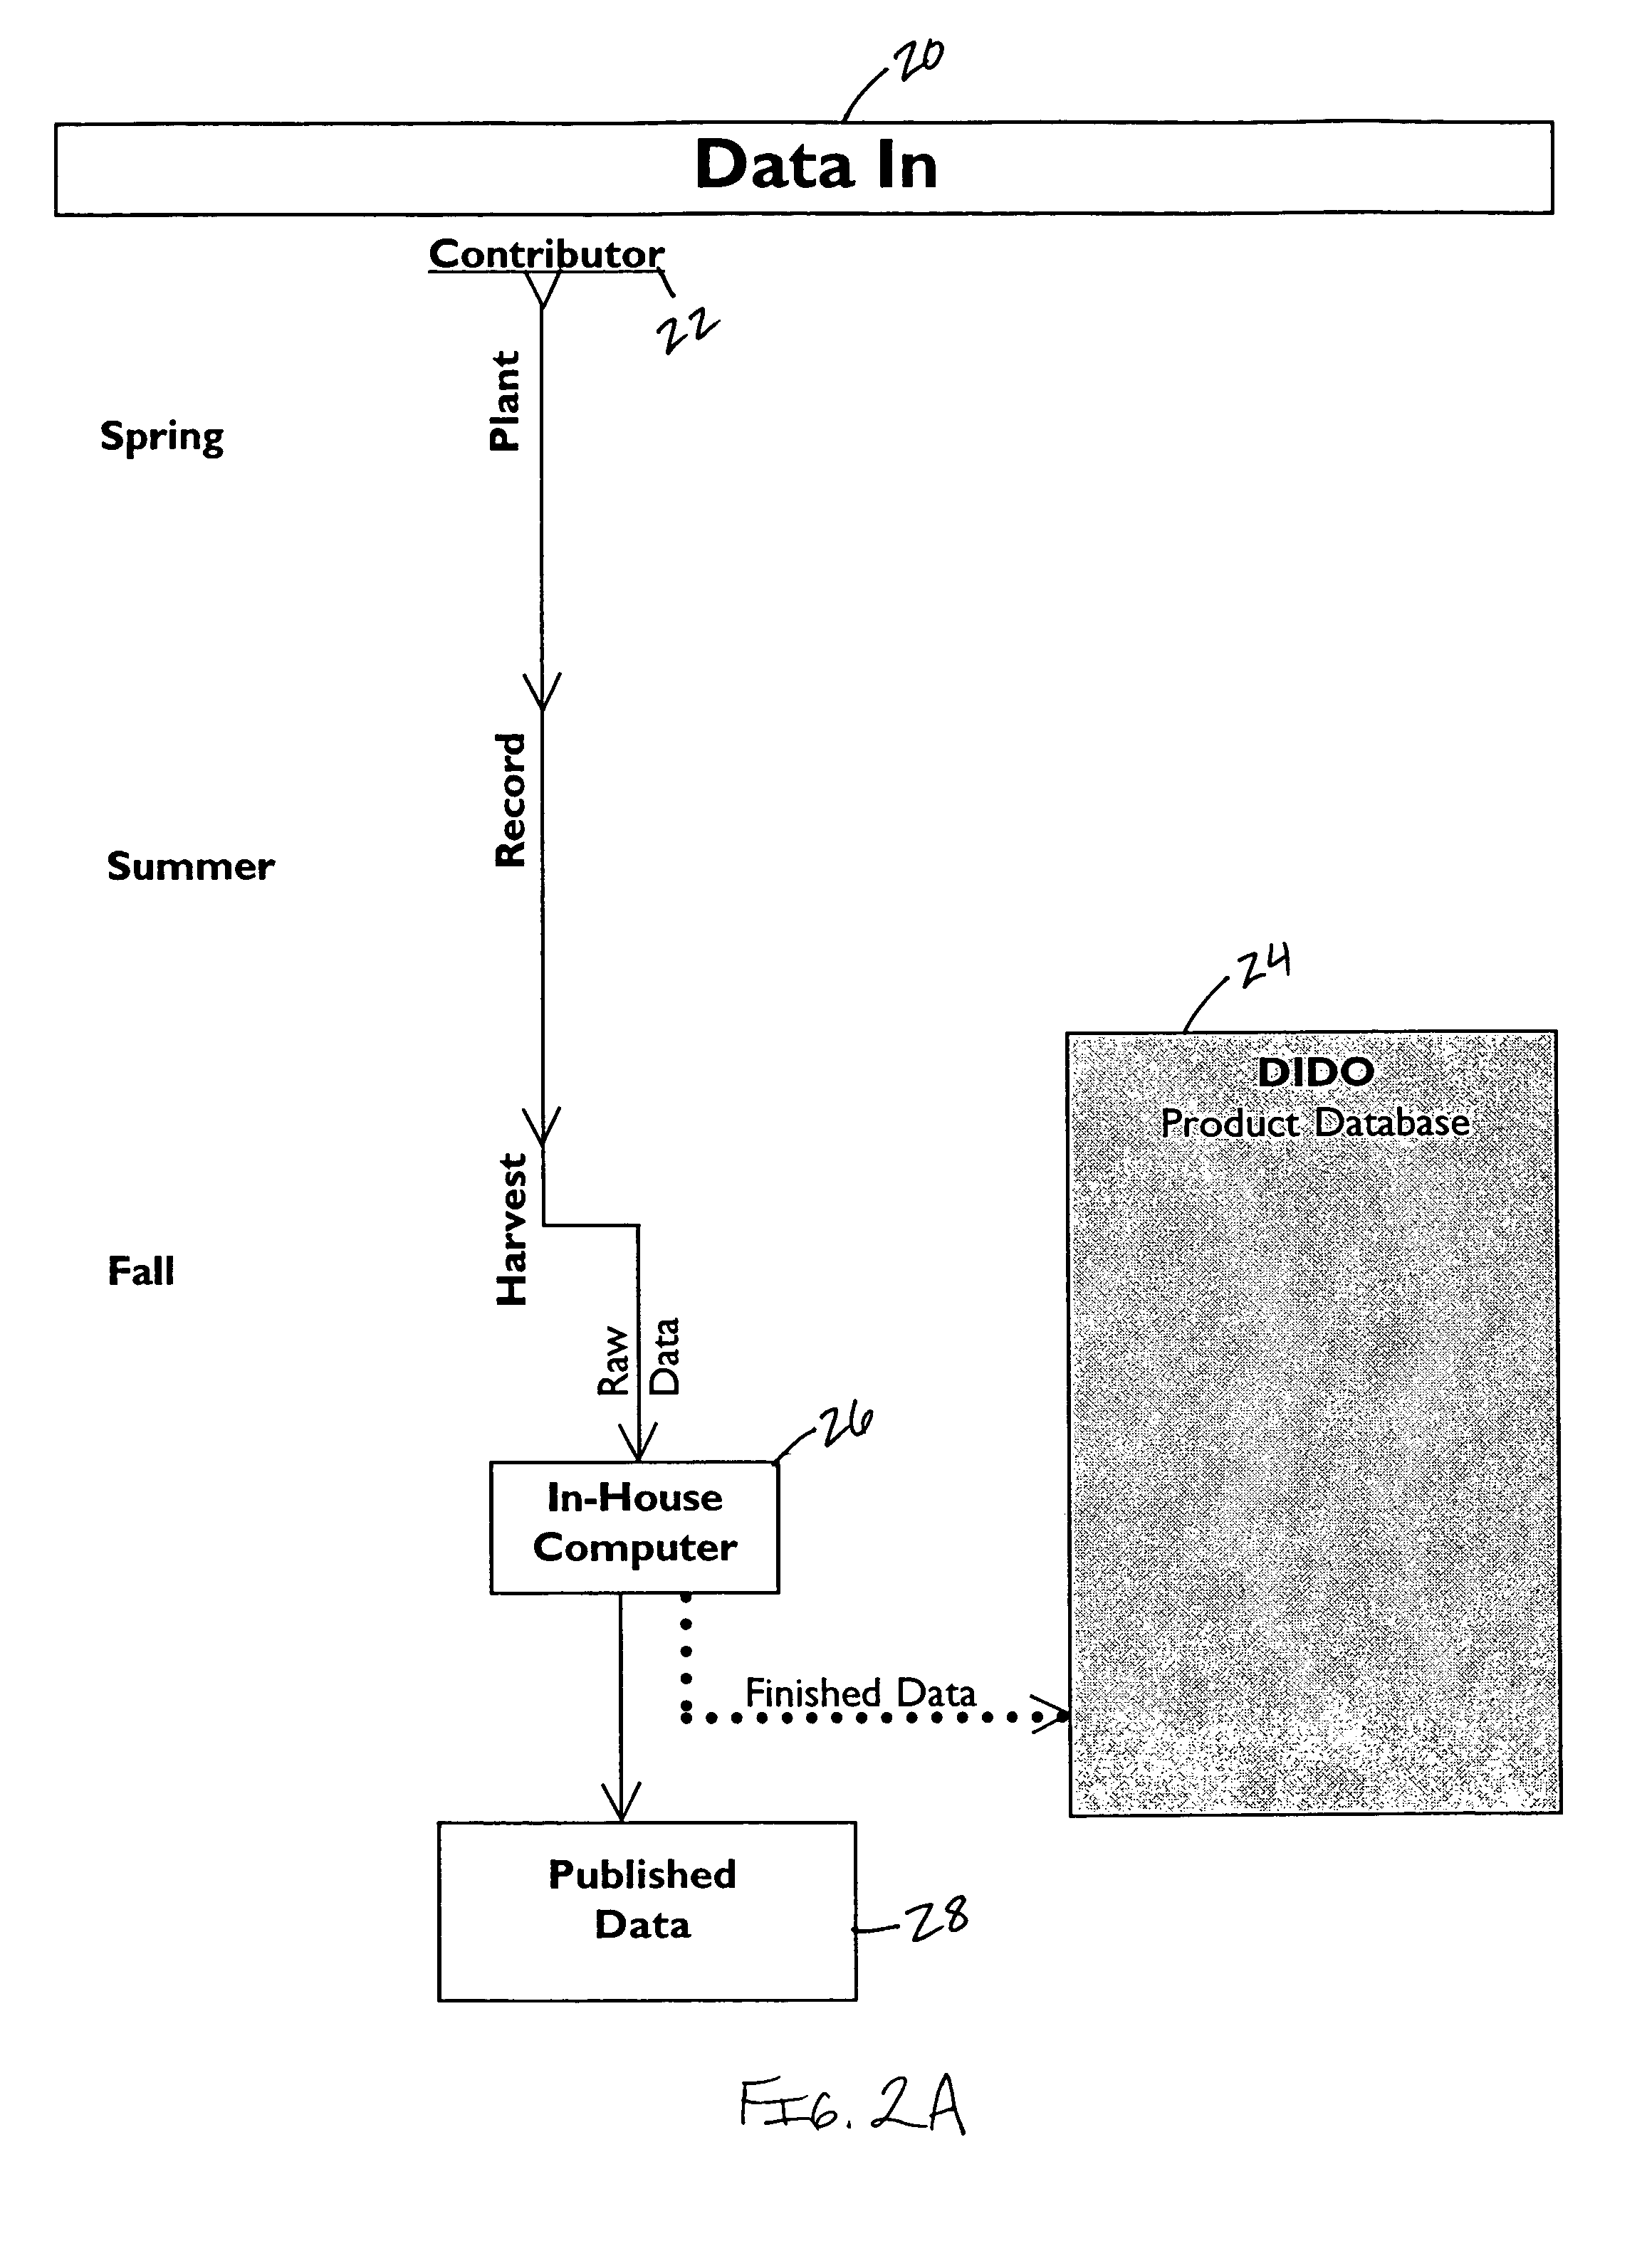
[0058]Referring now to the drawings, FIG. 1 illustrates a plurality of prior art data systems in which a plurality of data contributors input data into their systems' in-house computer and each publish the data in unique formats. Each data system is run independently from each other and they all output a different version of published data. So what you have is a lot of data in different formats that nobody is looking at. A data contributor may contribute data to their in-house computer during various stages related to the plant growing conditions. For example, a data contributor may contribute data and input that data into their in-house computer during the planting, growing and harvesting season.

[0059]The present invention comprises a computer program loaded on a computer server or available on CDs, DVDs, or over the Internet, with a plurality of databases for storing plant productivity data, environmental data and geographic data and an authentication device. A plurality of data c...


PUM


Abstract

A system and method of combining plant productivity testing data with environmental data and geographic data of testing sites in a computer program comprising at least one database for receiving, storing, analyzing and outputting the data.

Description

CROSS REFERENCE TO RELATED APPLICATIONS[0001]This application claims priority to U.S. Provisional Application No. 60 / 407,406 filed Aug. 30, 2002, which is incorporated herein in its entirety by reference.BACKGROUND OF THE INVENTION[0002]The present invention relates generally to plant productivity testing, and more particularly to a system and method of combining plant productivity testing data with environmental data and geographic data of testing sites in a computer program comprising at least one database for receiving, storing, analyzing and outputting the data.[0003]Foundation seed companies and private plant breeding companies are in the business of developing seed products from seed producing plants. This is mainly accomplished through foundation seed company testing programs and private plant breeding programs. However, all of the data is separate and different, and they all publish it in their own way. There is currently no method to connect the data.[0004]Historically, the...

Claims


Application Information

Patent Timeline
IPC IPC(8): G06Q50/00
CPCG06Q10/06
Inventor BIDDICK, BRADLEY D.
Owner DIDO
Learn More