
System and method for calculating real-time voltage stability risk index in power system using time series data

a technology of time series data and voltage stability risk index, which is applied in the field of system and a method for calculating a voltage stability risk index in the power system, can solve the problems of not being helpful in a condition requiring urgent control, not being able to provide the information about the sensitivity of the bus voltage, and being very simple and effective in controlling the voltage for a normal condition

Inactive Publication Date: 2007-06-26
KOREA ELECTROTECH RES INST
View PDF8 Cites 11 Cited by
  • Summary
  • Abstract
  • Description
  • Claims
  • Application Information

AI Technical Summary

Benefits of technology

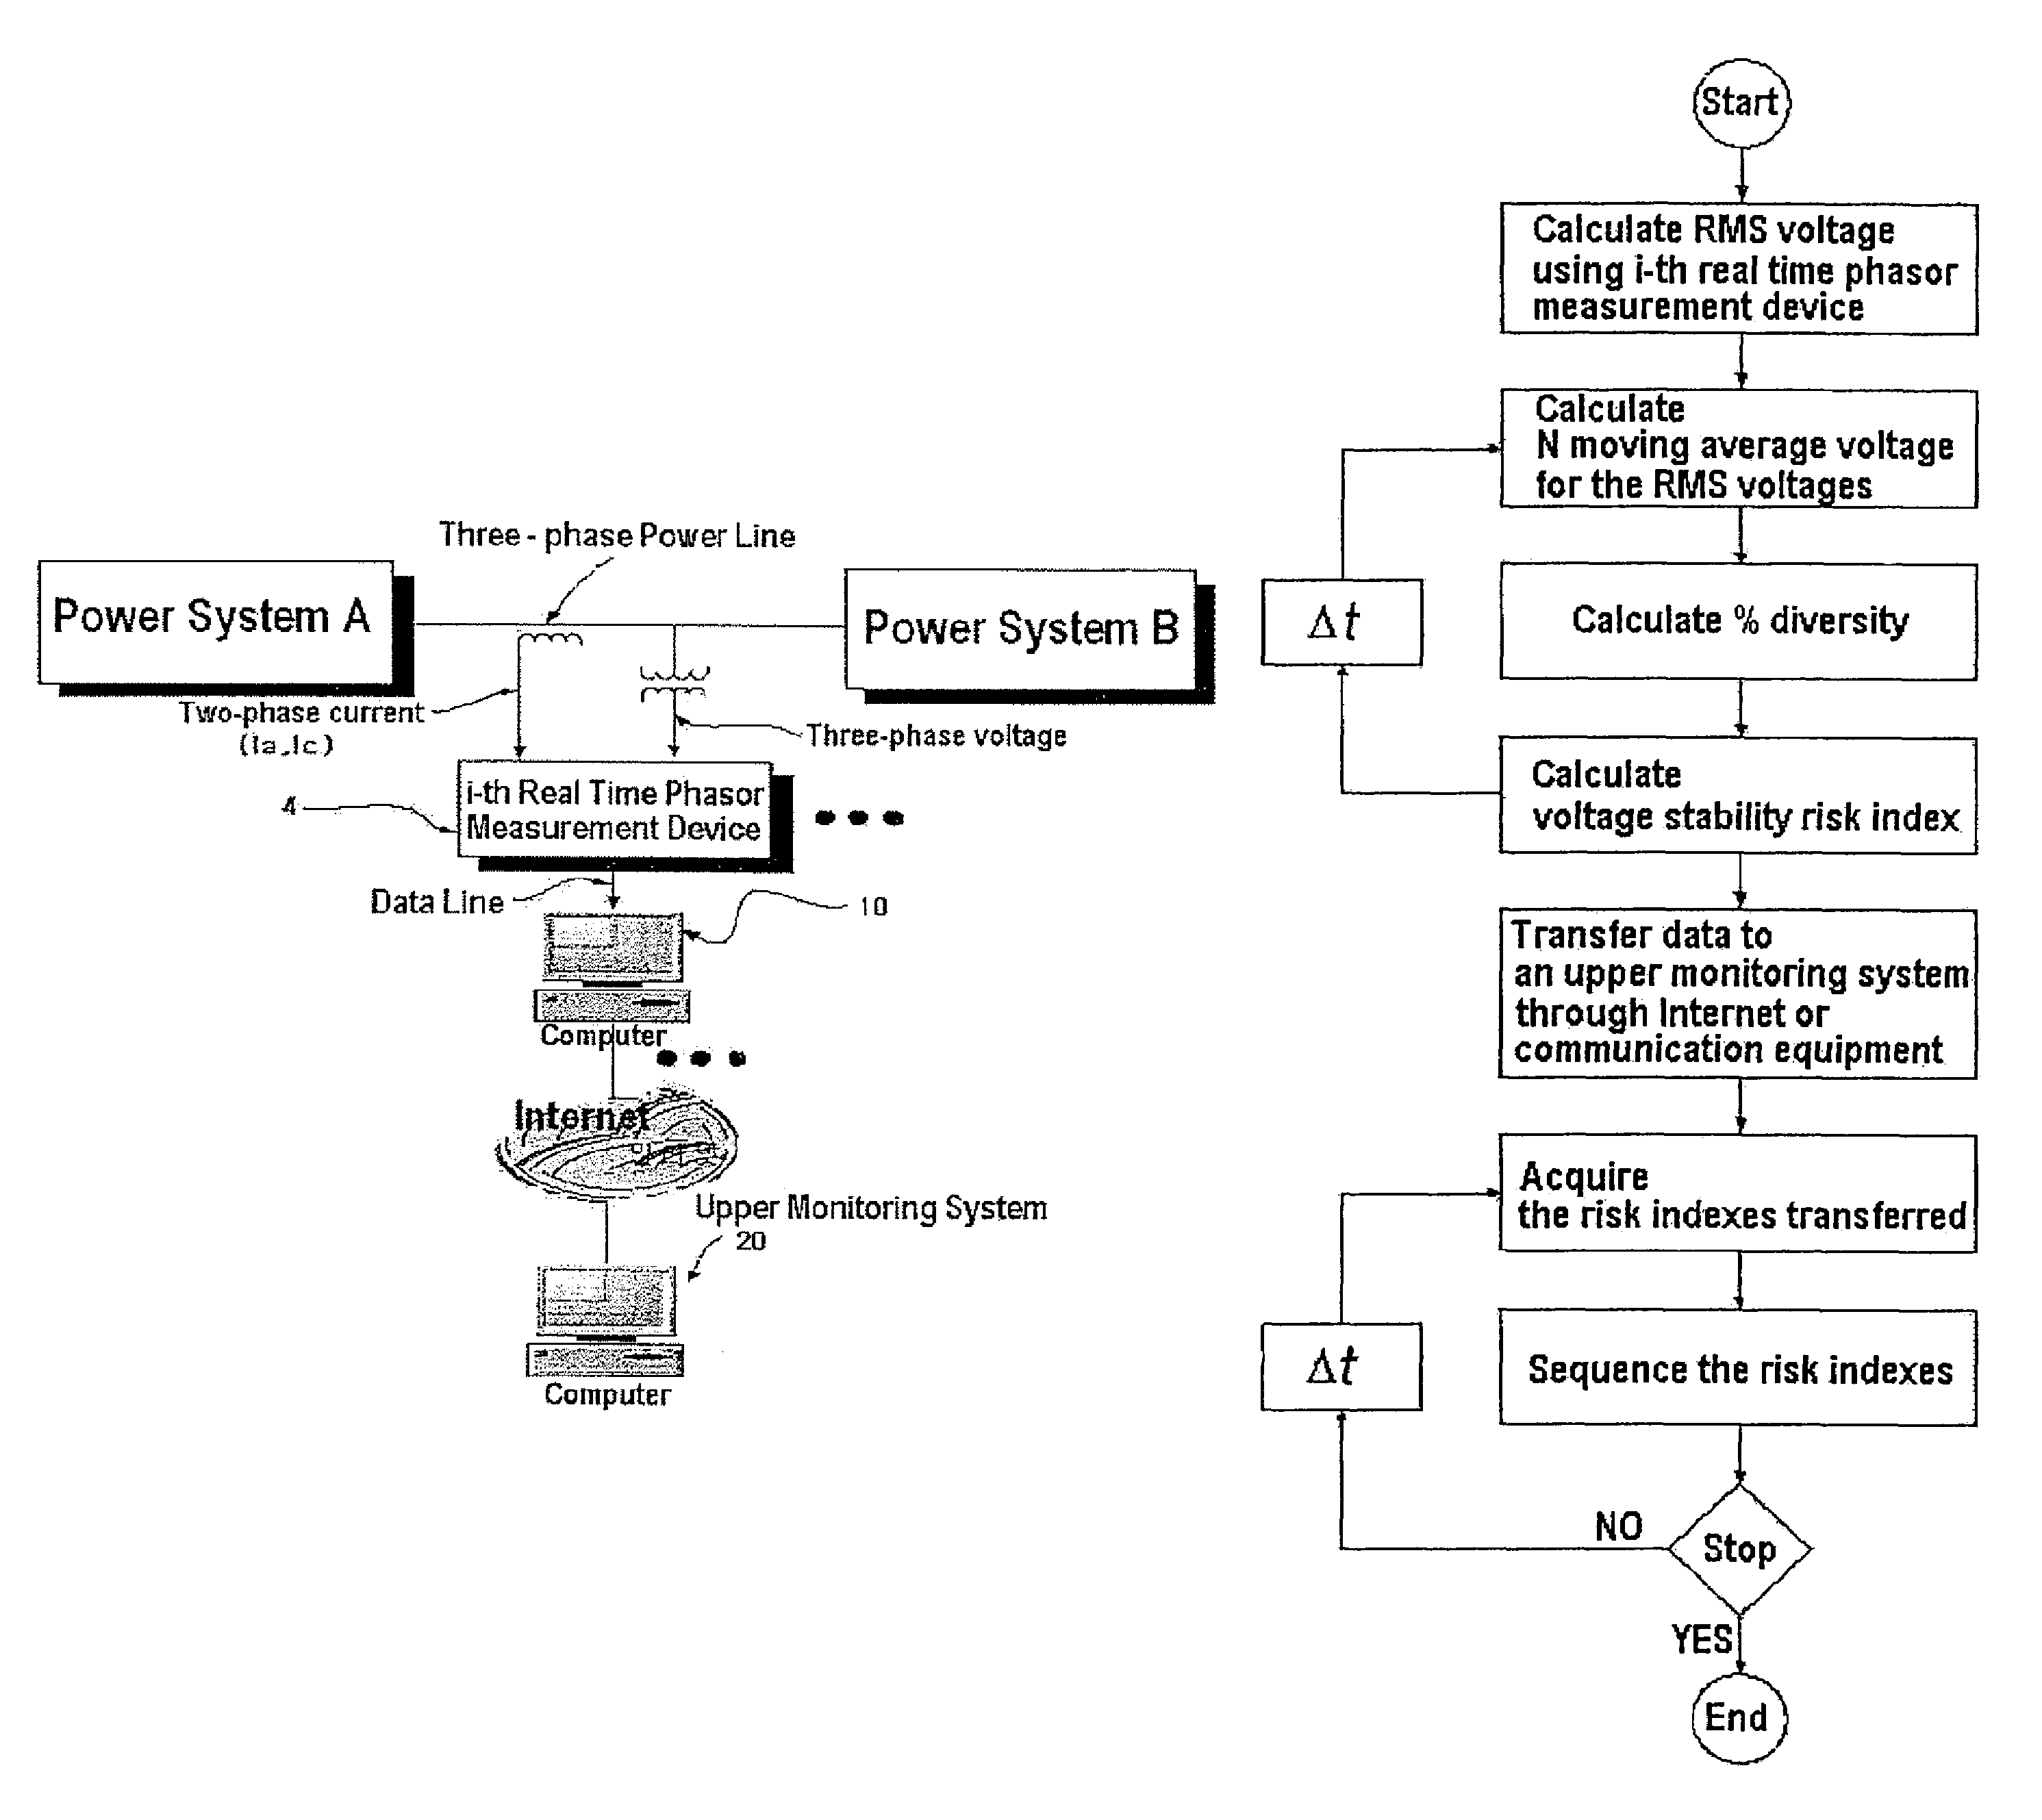
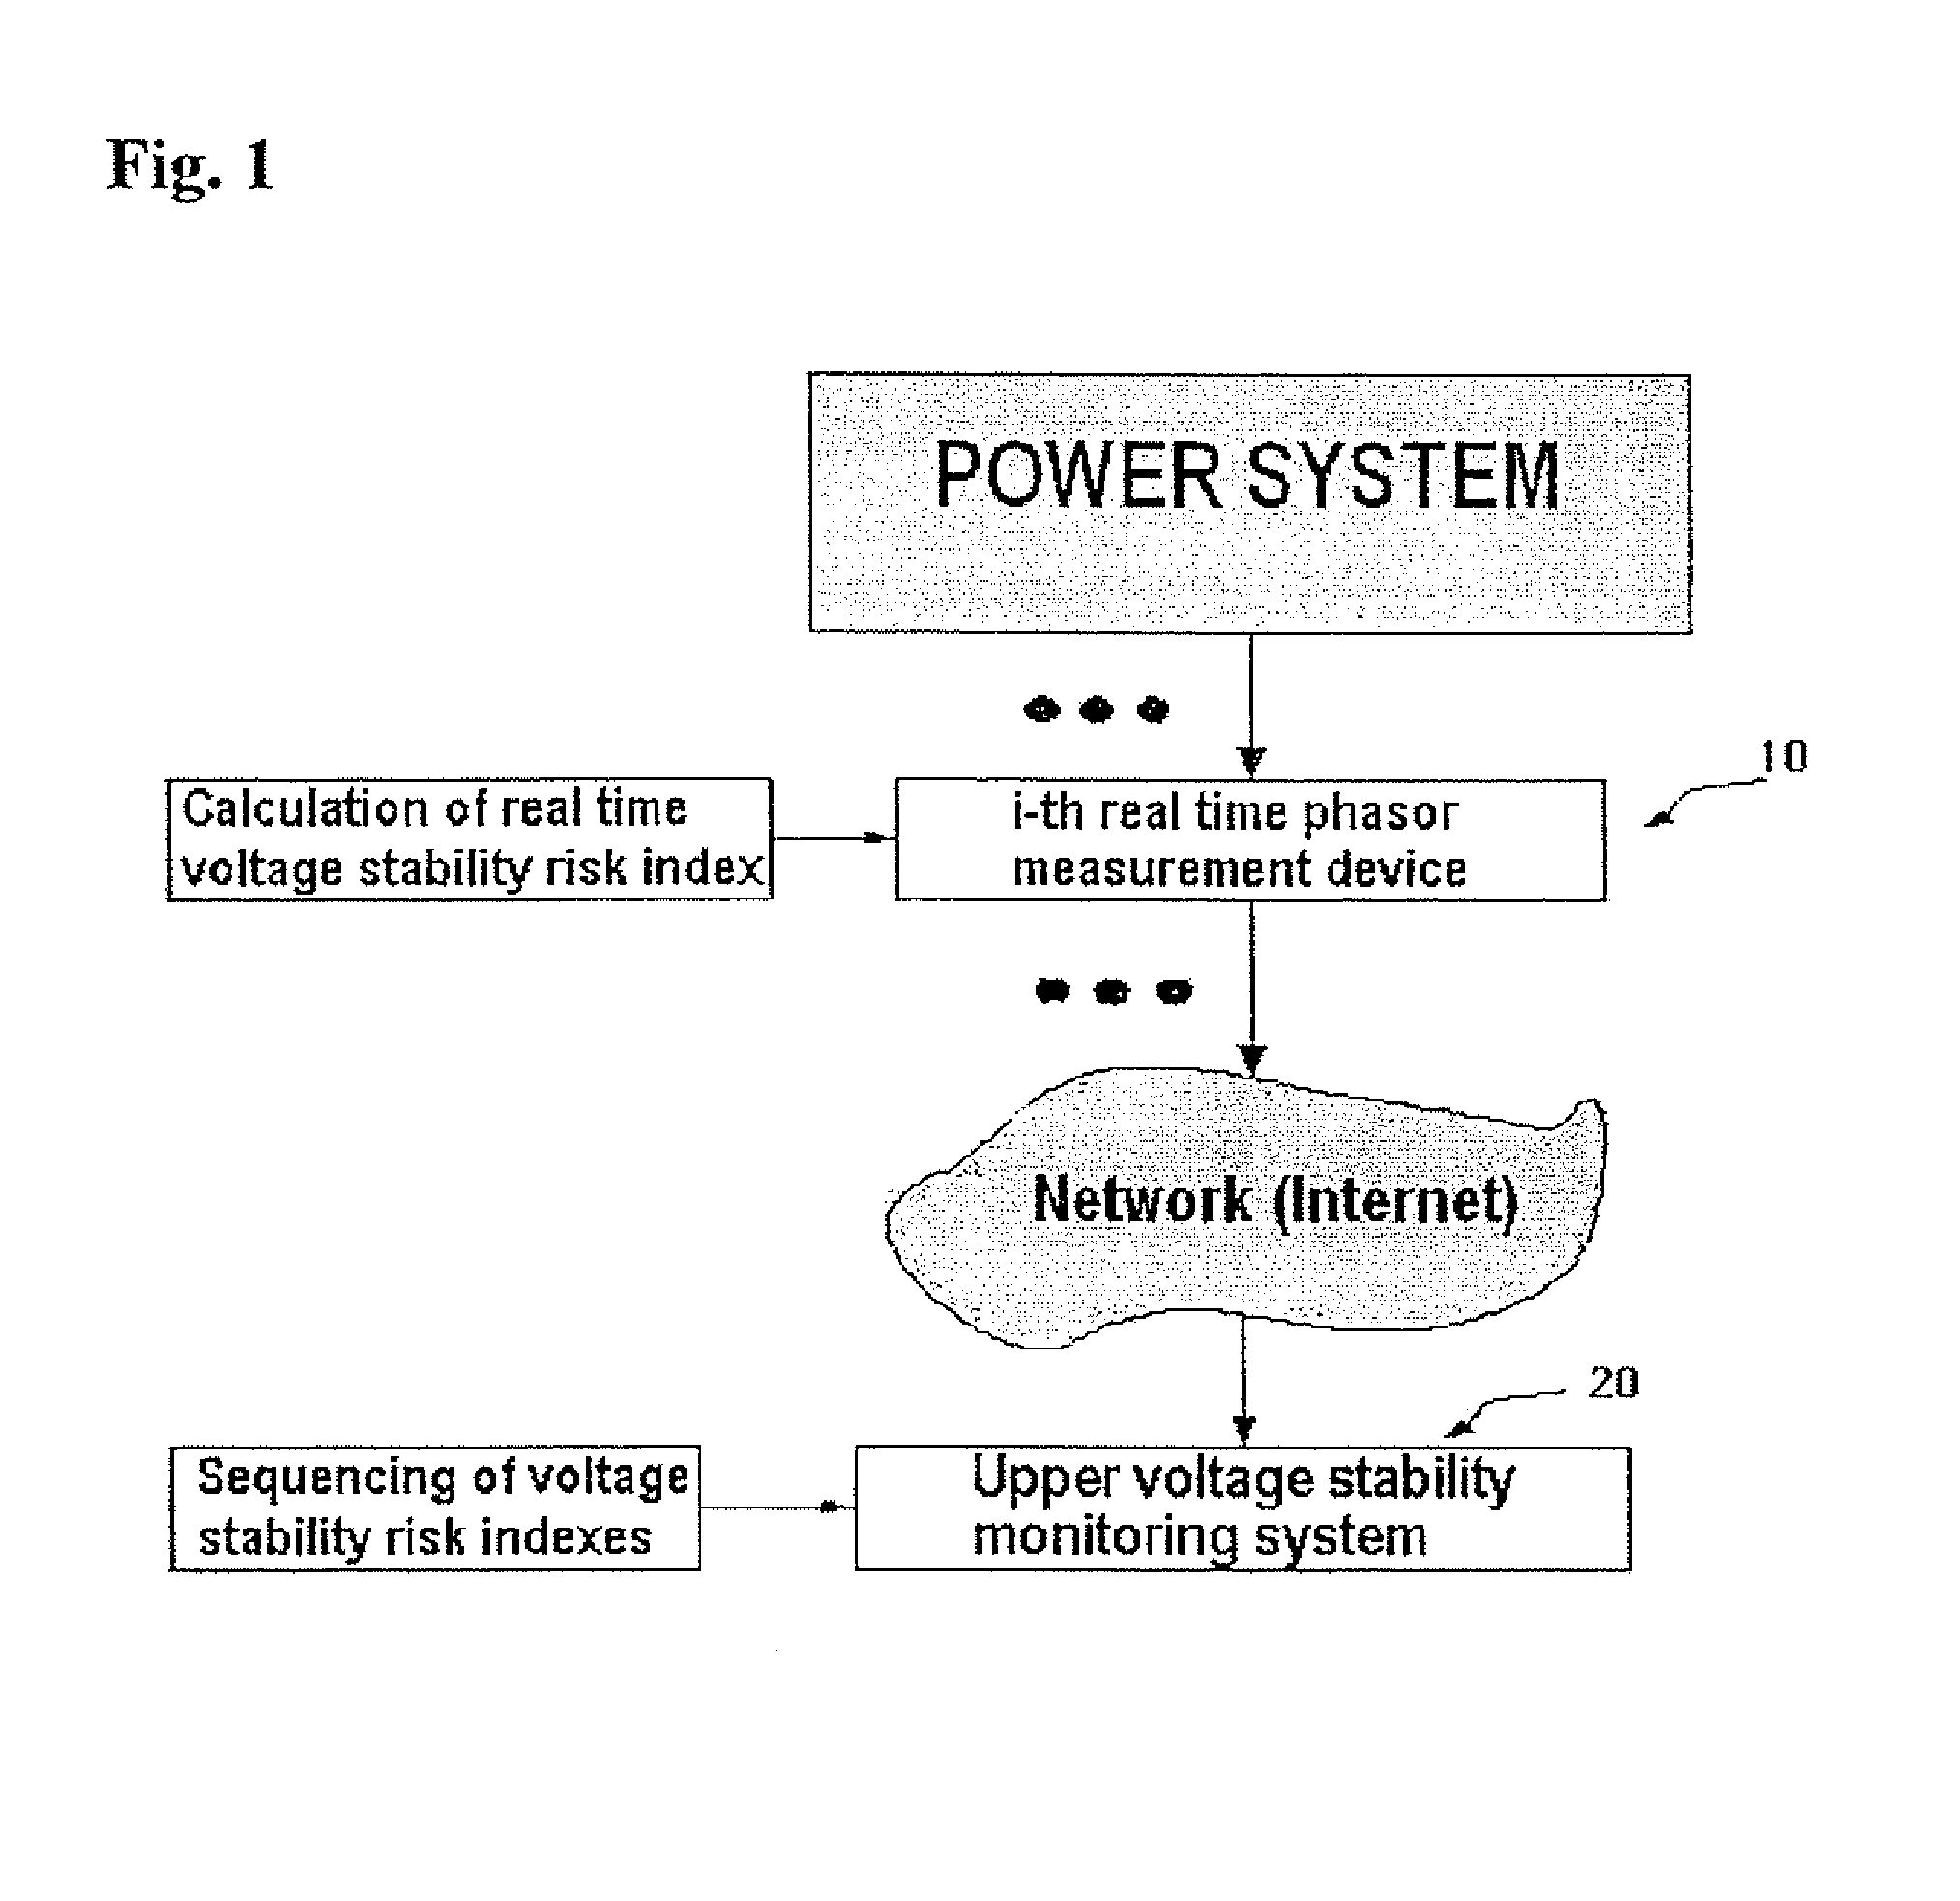
The present invention provides a system and method for calculating a real-time voltage stability risk index in a power system using time series data. This helps to overcome limitations and disadvantages of existing methods. The system includes a real-time phasor measurement device for measuring voltage from the power system and an upper voltage stability monitoring system for collecting and sequencing the voltage stability risk index. The method involves calculating RMS voltage, an N moving average voltage, a % diversity between the bus voltage measured and the N moving average voltage, and a voltage stability risk index by dividing the area constructed by the % diversity by the number of sections. The voltage stability risk index is transferred from the real-time phasor measurement device to the upper voltage stability monitoring system through Internet or a communication equipment. The technical effects of the invention include improved voltage stability monitoring and control in power systems.

Problems solved by technology

Such a method is very simple and effective in controlling voltage for a normal condition, but not helpful for a condition requiring urgent control, for example, when a fault or contingency in the system has occurred due to a disturbance.
Moreover, this method cannot provide the information about the sensitivity of a bus voltage.
However, it is impossible to measure the electric power amount and load amount for the whole buses in a power system comprising hundreds or thousands of buses.
Negative V−Q sensitivity means unstable in terms of the voltage stability.
However, voltage control methods using such conventional voltage stability analyses cannot completely monitor the voltage in an electric power system and fully reflect voltage characteristics of the whole power system because they uses partial data measured only for main buses.
In addition, voltage control methods using such conventional voltage stability analyses cannot achieve a real time voltage monitoring in a power system and cannot represent the soundness of bus voltage at a transient condition.

Method used


Image

  • System and method for calculating real-time voltage stability risk index in power system using time series data
  • System and method for calculating real-time voltage stability risk index in power system using time series data
  • System and method for calculating real-time voltage stability risk index in power system using time series data

Examples


Embodiment Construction

[0023]Reference will now be made in detail to the preferred embodiments of the present invention, examples of which are illustrated in the accompanying drawings.

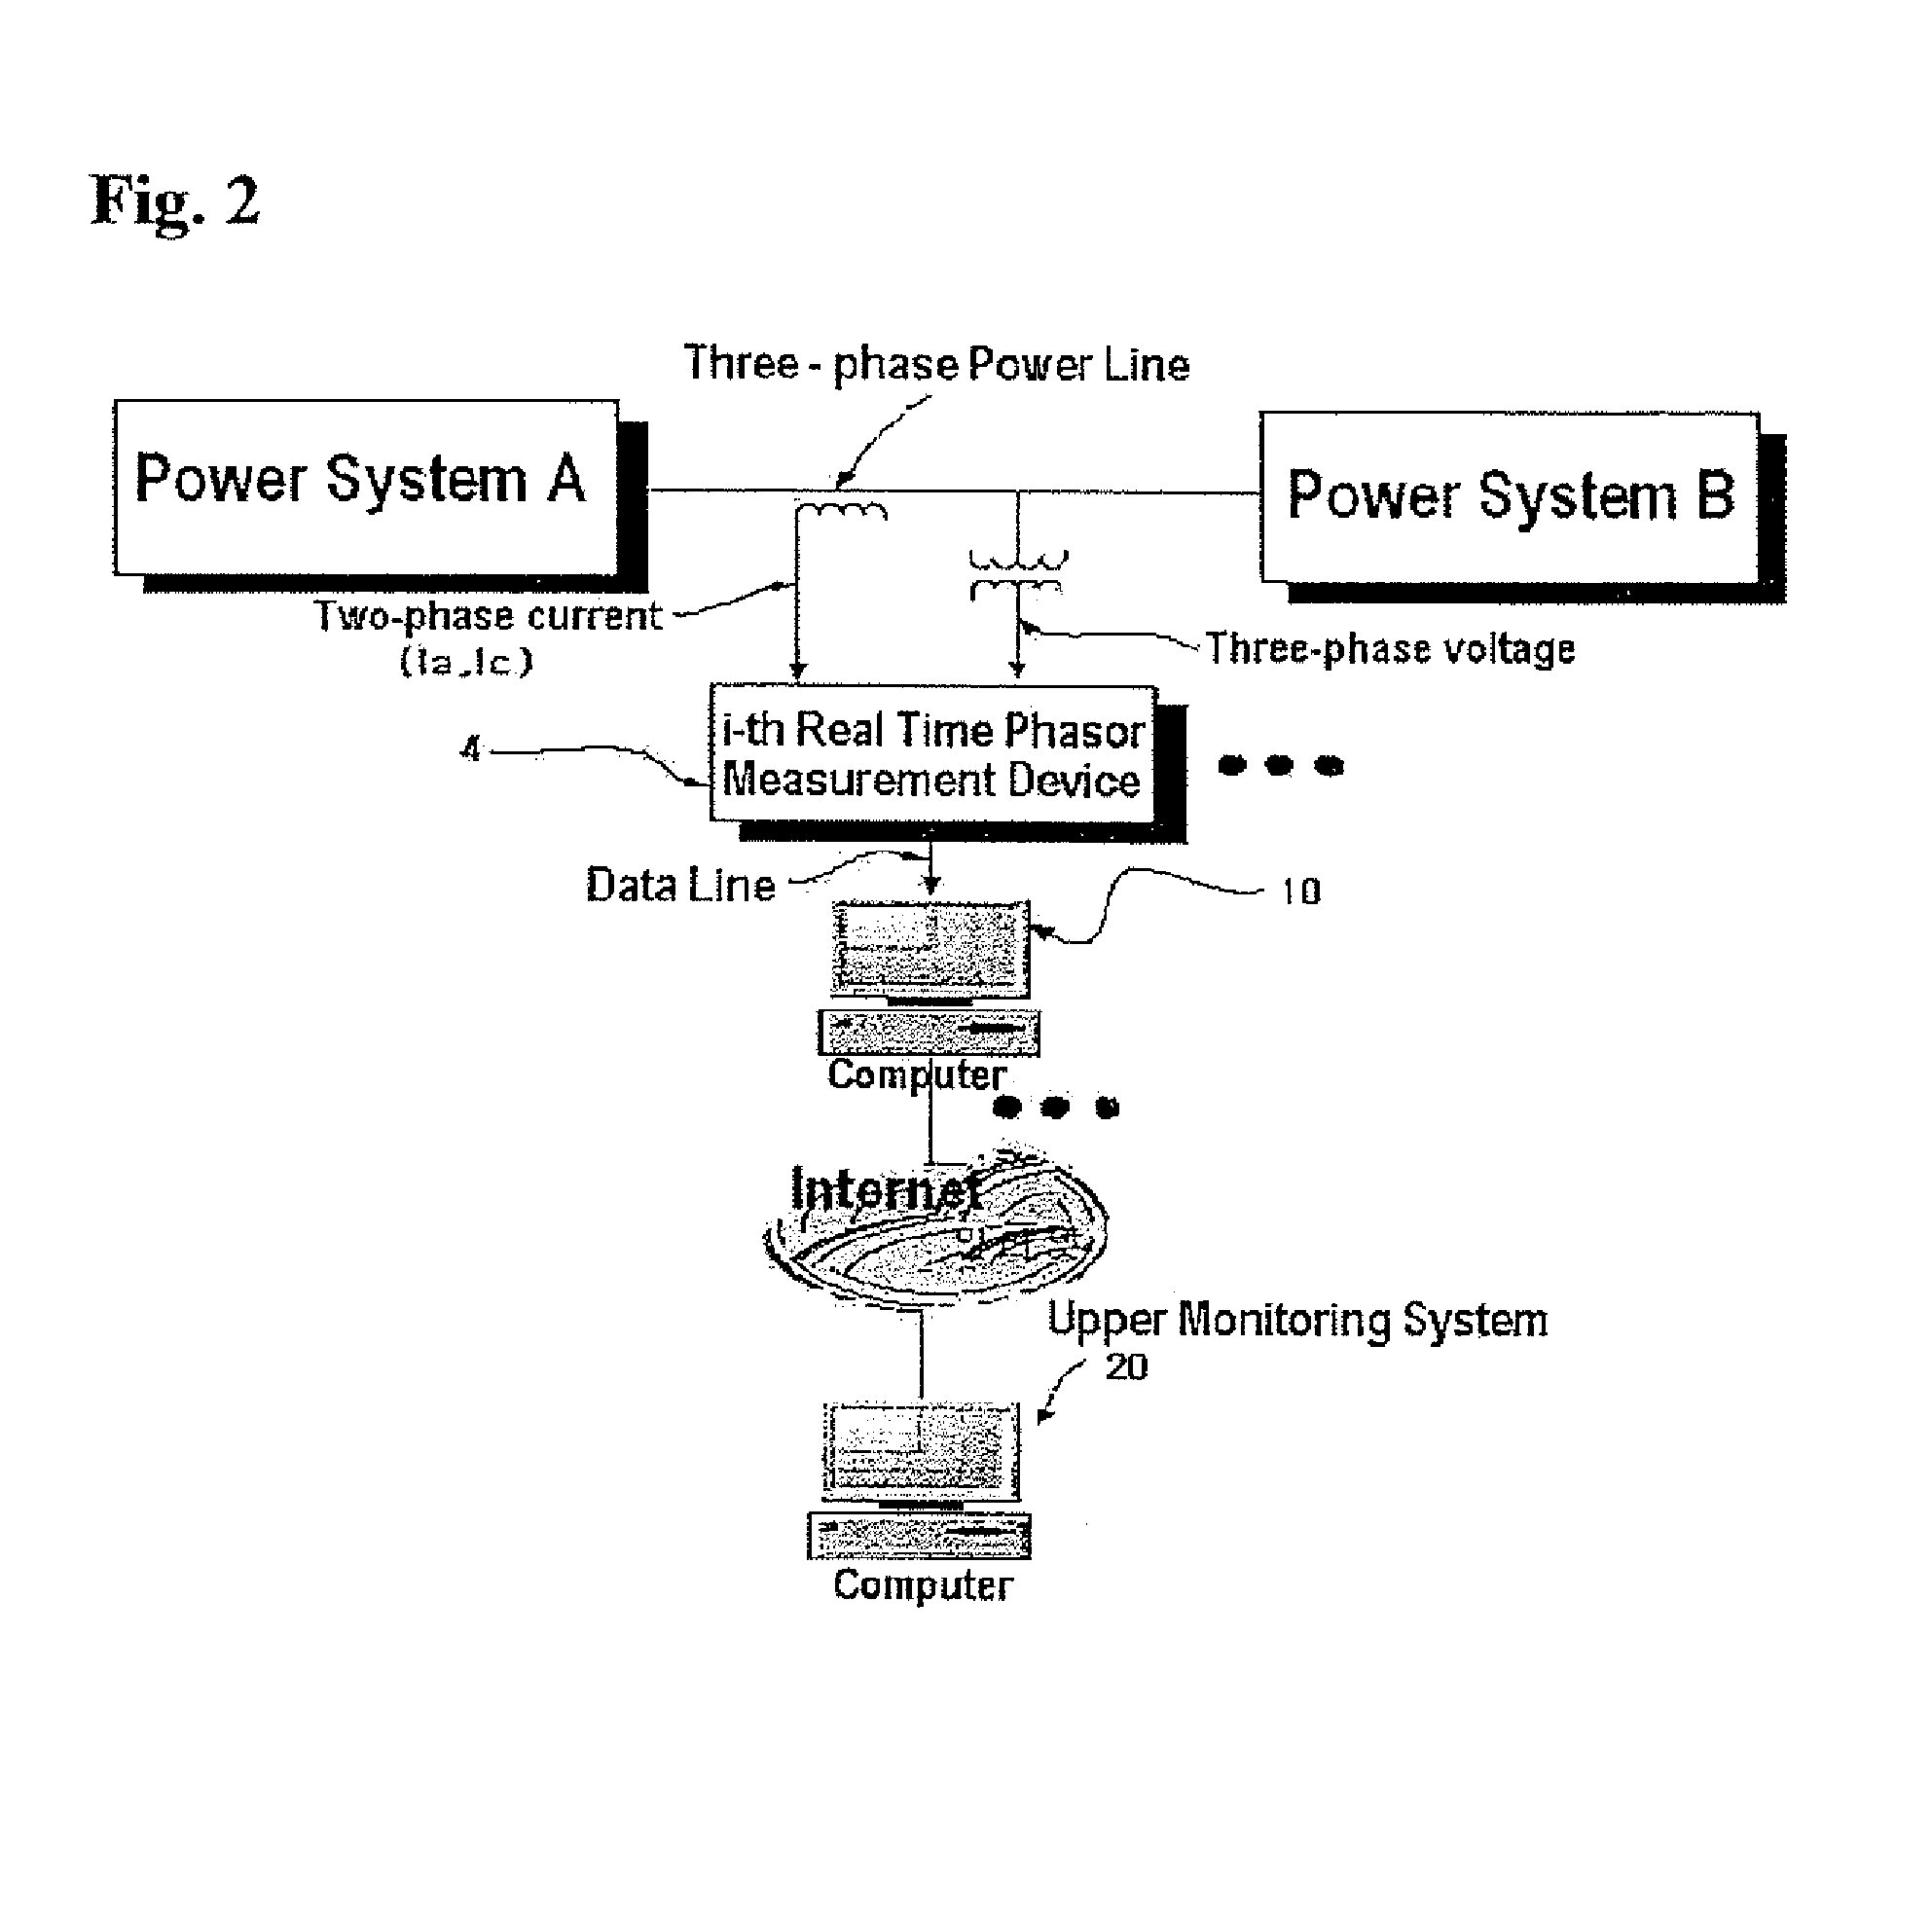
[0024]FIG. 1 is a schematic diagram illustrating a method of calculating a voltage stability risk index according to the present invention. FIG. 2 is a schematic diagram illustrating a system of calculating a voltage stability risk index according to the present invention. By employing a real time phasor measurement device 10 as shown in FIGS. 1 and 2, the problem related to data required in voltage stability analysis using a conventional power flow calculation can be solved. The real time phasor measurement device 10 measures voltage from a power system, calculates a root mean square (RMS) value of the voltage and then voltage stability risk index, and transfer the data calculated into Internet or a communication equipment. By analyzing time series bus voltages measured by using the phasor measurement device 10 installed on...


PUM


Abstract

A system and method are provided to calculate a real time voltage stability risk index in a power system. The method includes calculating an RMS voltage by using bus voltage measured and calculating an N moving average voltage for the RMS voltages. A percentage diversity between the bus voltage measured and the N moving average voltages is calculated. A voltage stability in that risk index is calculated by dividing the area constructed by the percent diversity by the number of sections. The voltage stability risk index is transferred from a real time phasor measurement device to an upper voltage stability monitoring system. The transferred voltage stability risk indexes are acquired and sequenced and the sequence voltage stability risk indexes are output.

Description

BACKGROUND OF THE INVENTION[0001]1. Field of the Invention[0002]The present invention relates to a system and a method for calculating a voltage stability risk index in power system and, more particularly, to a system and a method for promptly monitoring transient voltage stability in real time using voltages measured.[0003]2. Background of the Related Art[0004]In operating a power system, an electric power company controls voltage through two methods. First, the voltage, which is measured and transferred from each main bus, is shown on a display board and the electric power company passively controls the voltage so that the displayed voltage is maintained at a value ranging from 95% to 105% of a rated voltage. Such a method is very simple and effective in controlling voltage for a normal condition, but not helpful for a condition requiring urgent control, for example, when a fault or contingency in the system has occurred due to a disturbance. Moreover, this method cannot provide t...

Claims


Application Information

Patent Timeline
Patent Type & Authority Patents(United States)
IPC IPC(8): G01R19/00G01R25/00G06F19/00G06G7/00H02J3/00
CPCH02J3/00H02J2003/007Y04S40/22Y02E60/76H02J2203/20Y02E60/00Y04S40/20G06Q50/00
Inventor KIM, DONG JOONMOON, YOUNG HWANKIM, HO YONGYOON, JAE YOUNG
Owner KOREA ELECTROTECH RES INST
Learn More