
Data analysis system and method

a data analysis and data technology, applied in the field of monitoring system systems and methods for data analysis, can solve problems such as difficult recognition of cmss, unknown and possibly abnormality, and inability to use cmss in ill-defined domains or domains, and achieve the effect of shortening the learning phas

Active Publication Date: 2007-10-30
BRITISH TELECOMM PLC
View PDF12 Cites 15 Cited by
  • Summary
  • Abstract
  • Description
  • Claims
  • Application Information

AI Technical Summary

Benefits of technology

The present invention provides an improved system for analyzing data from a monitoring system for dynamic systems. The system allows for the automatic creation of a sensor-based normality model that can learn abnormal conditions without needing any knowledge from an operator. The system uses high-dimensional sensor data and normality models to detect abnormal conditions automatically and alert an operator through an alarm. The system also allows sensors to organize into sensor groups that act as meta-sensors and can fuse data from other sensors. The system uses a normality model to predict data and an intelligent data analysis module to analyze the data and adapt the normality models based on user feedback. Overall, the system improves the detection and analysis of abnormal conditions in real-time and can adapt to new situations without needing any pre-defined knowledge.

Problems solved by technology

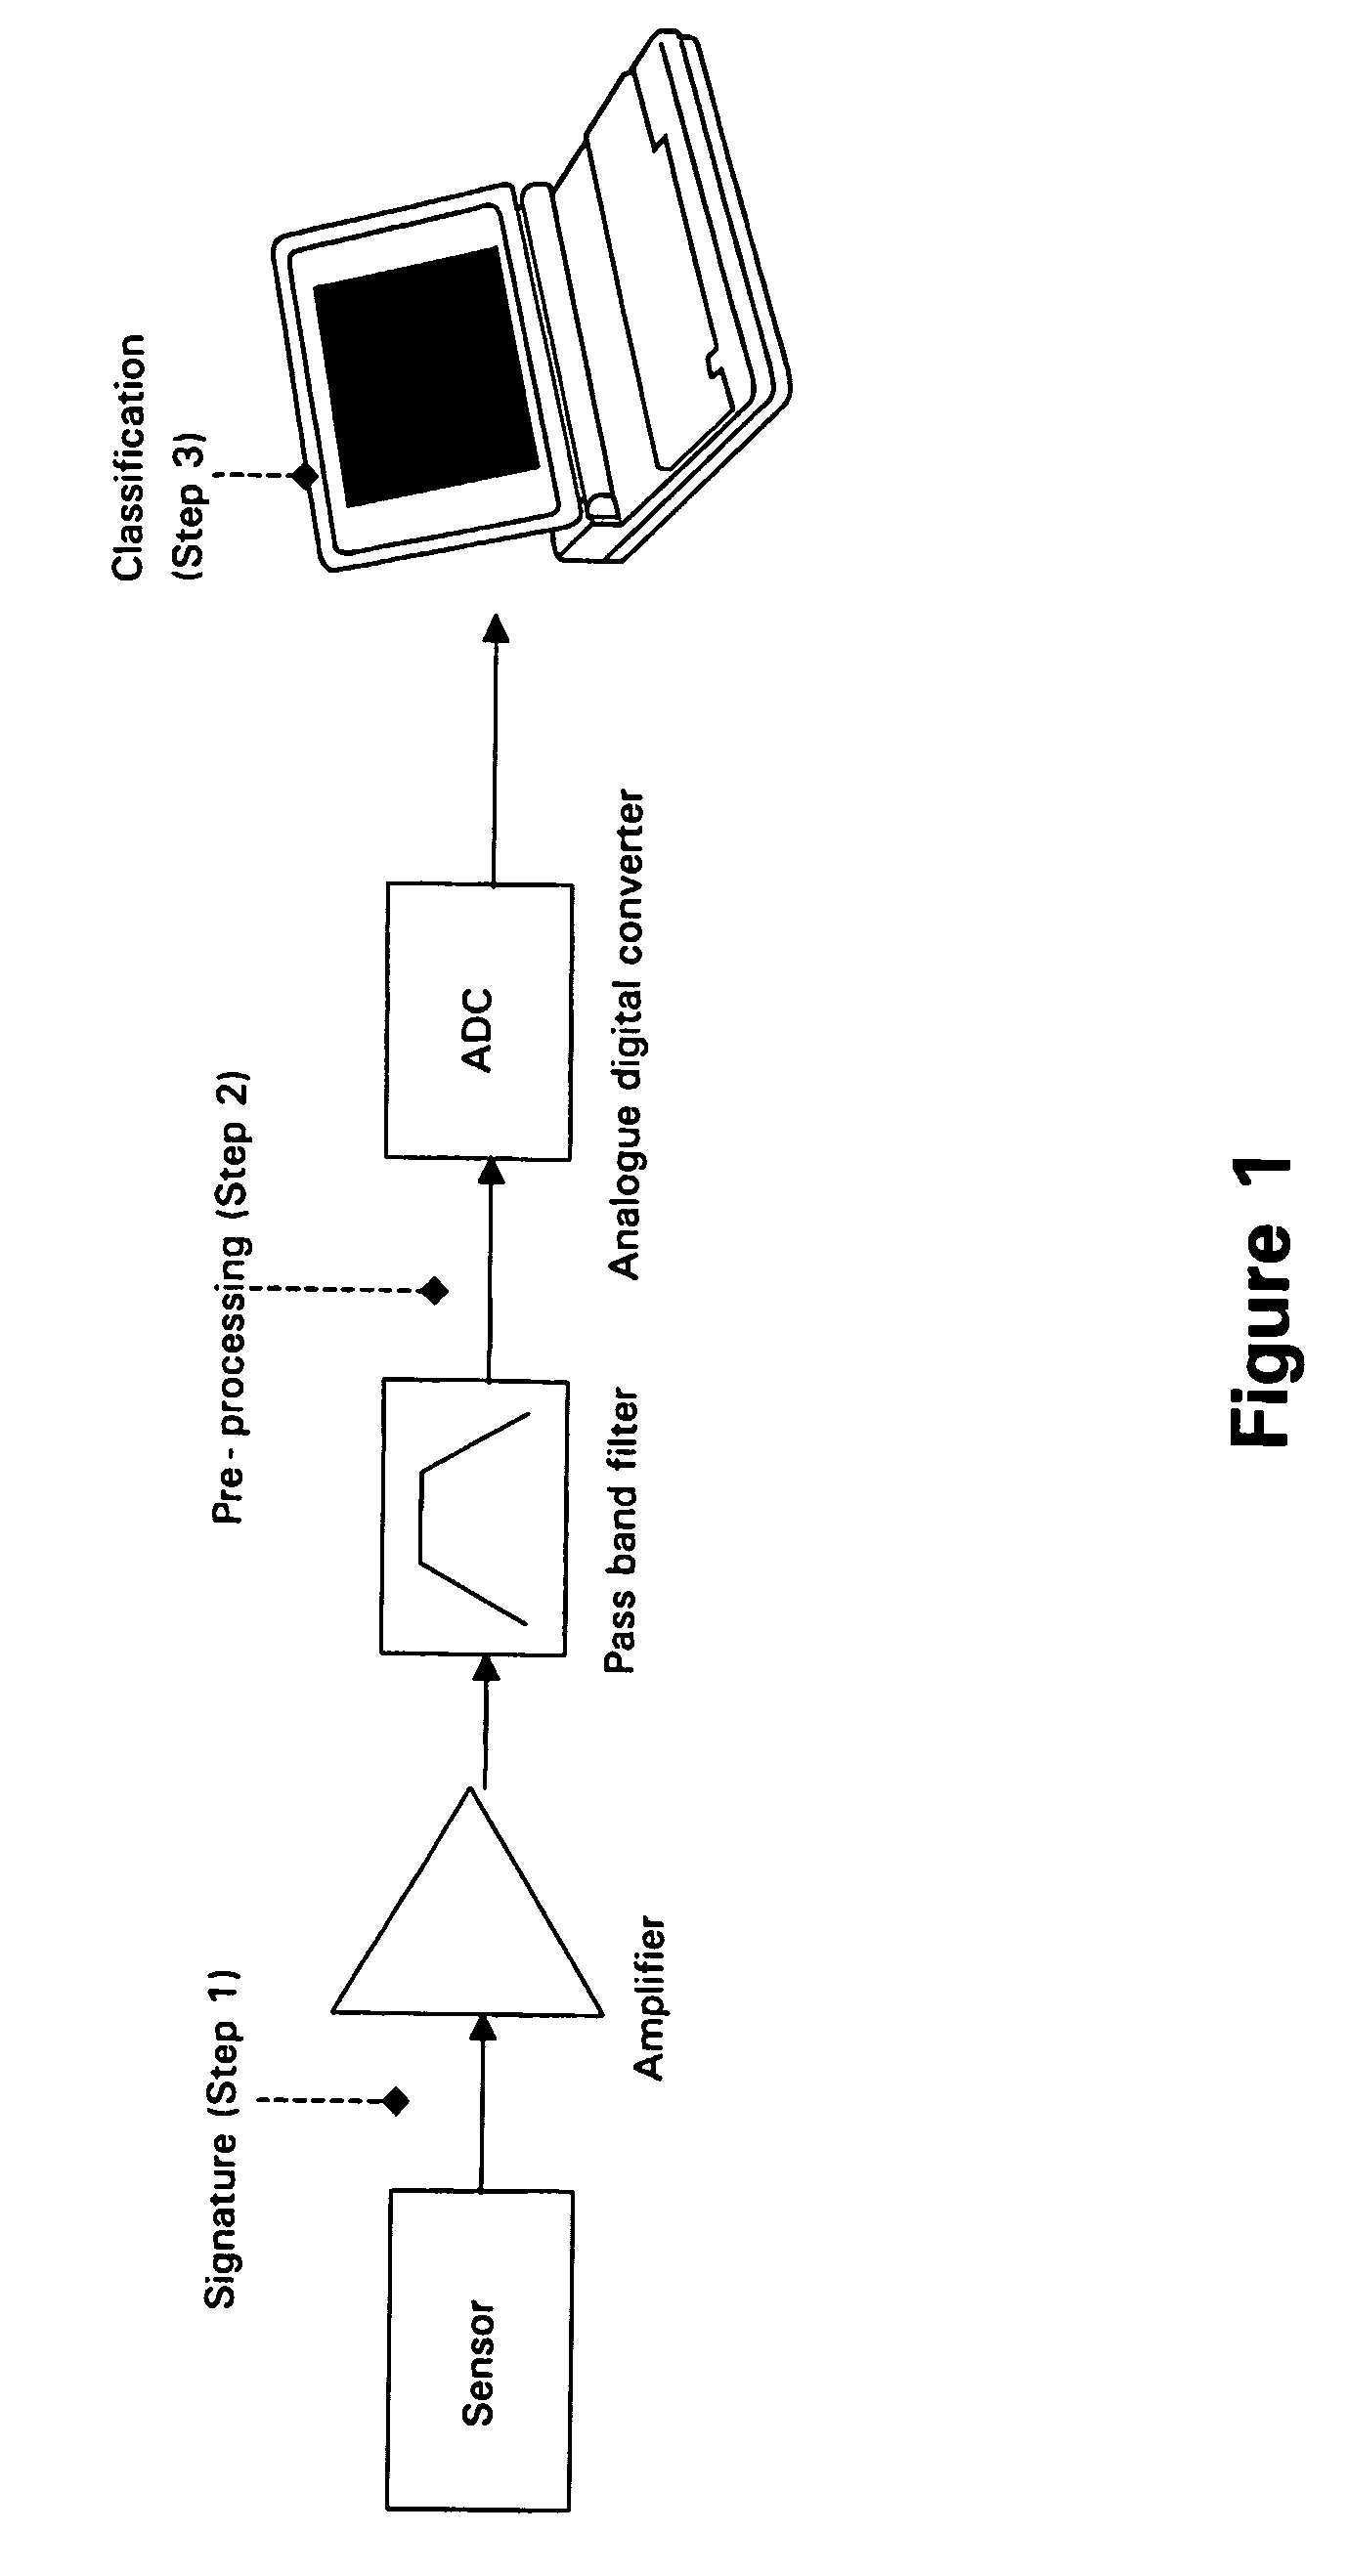
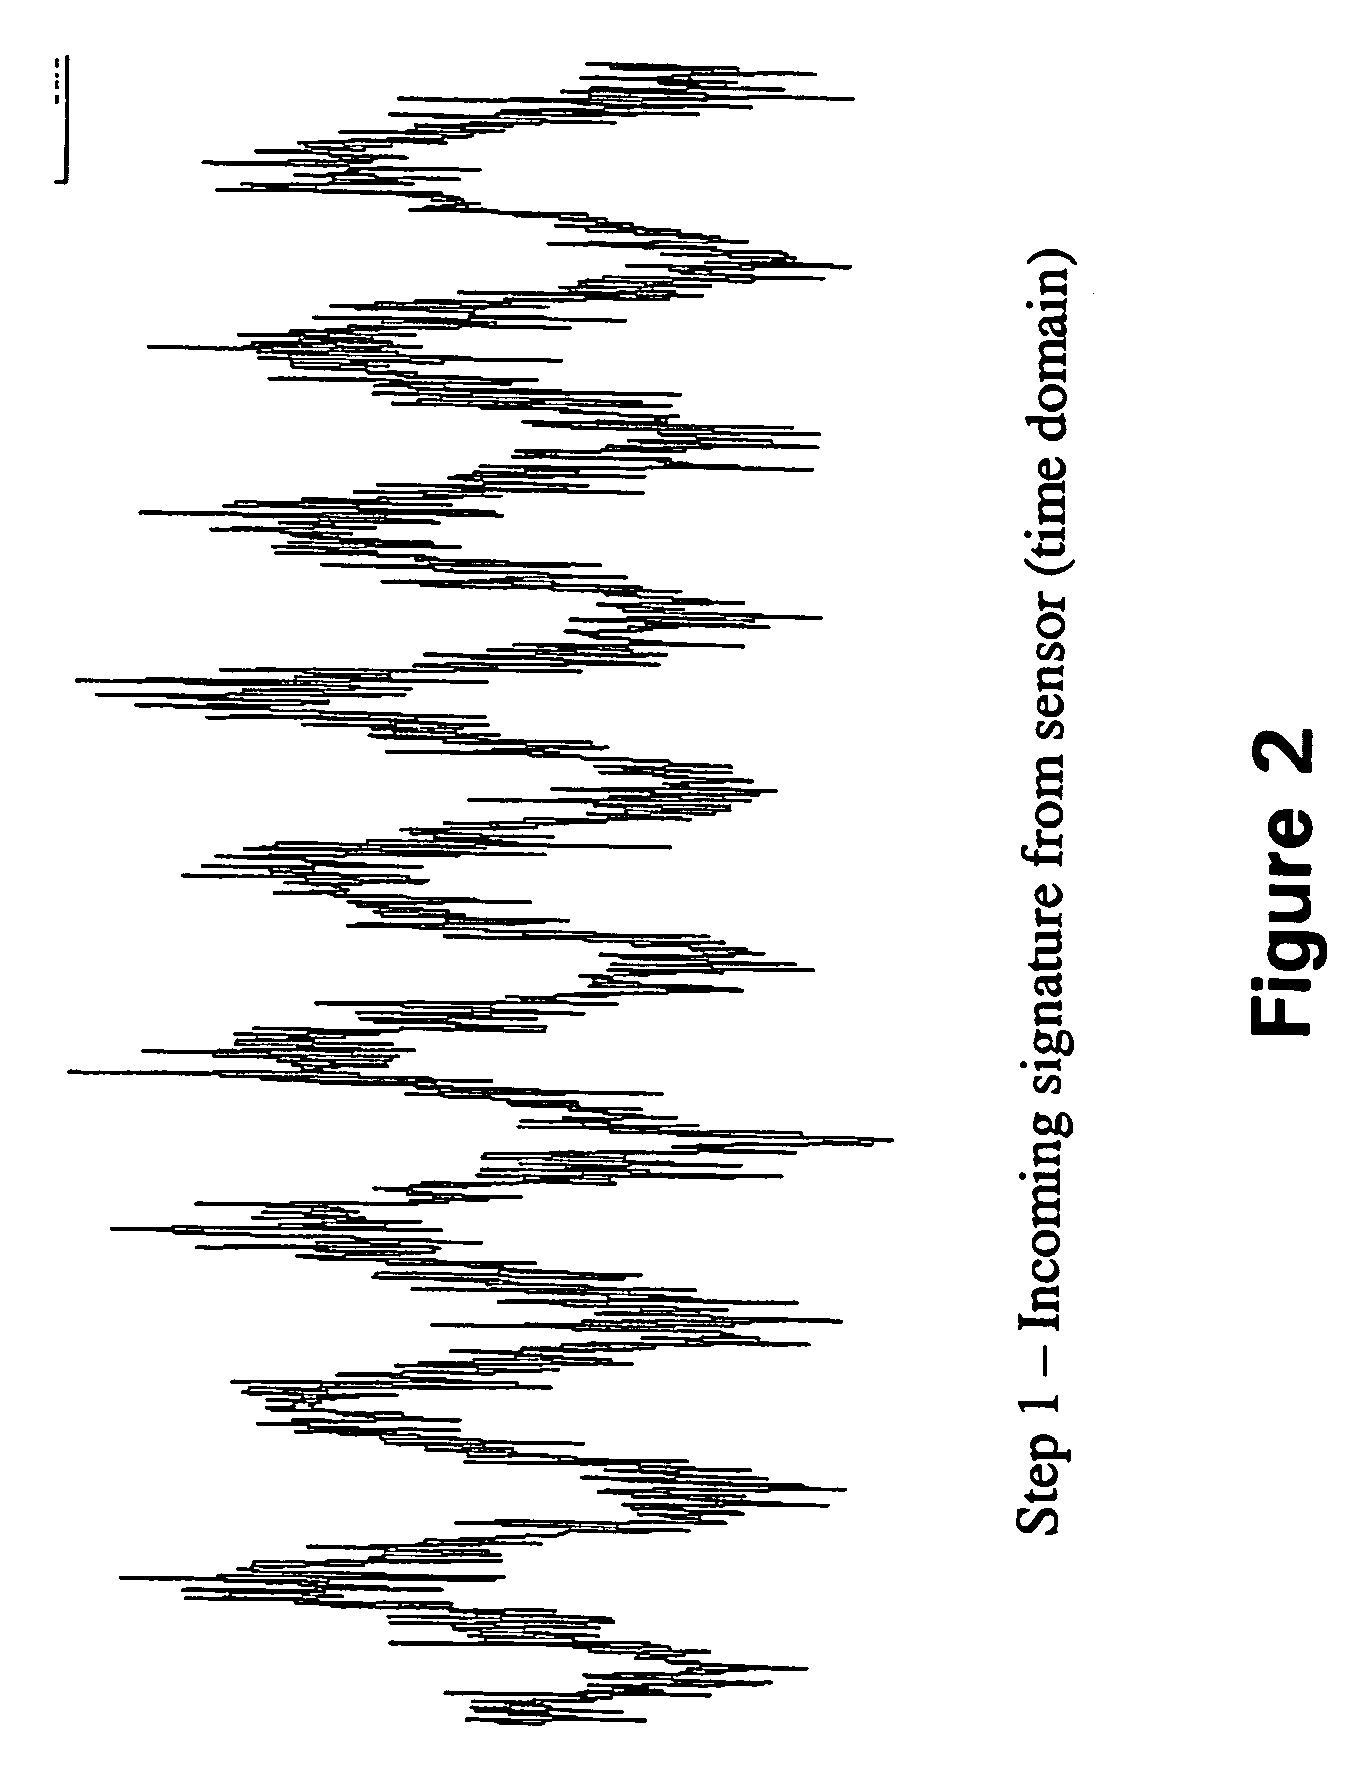
Most of the incoming signatures are usually tainted with noise, which makes their recognition difficult.
If the system does not recognise the incoming signature to be within the tolerance level of any reference signature, then it will be considered as unknown and possibly abnormal.
That means CMSs are not suitable for use in ill-defined domains or domains where abnormal conditions have not been observed before, are not likely to be observed and cannot be created or predicted easily.
An example would be the failure of an expensive piece of machinery.
Failure may be devastating such that it is not possible to drive the monitored machine into failure mode in order to record failure conditions.
There may be only vague and uncertain knowledge about thresholds of monitored signals and this knowledge may not be sufficient to describe failure sufficiently.
For both examples it is easy to see that a single sensor is generally not sufficient.
For the examples discussed above and for similar complex scenarios we face the problem of setting up a CMS properly because it is often difficult or impossible to define normal and abnormal conditions in a high-dimensional sensor data space.
However, in scenarios such as those considered above, only examples of normal situations may be available and thus normal learning procedure cannot be used.
One of the main problems in deploying a sensor based CMS is to establish normal and abnormal conditions for a multitude of sensors monitored by the CMS.
If abnormal conditions or failure states are not known or are ill-defined, a CMS requiring such information cannot be used.

Method used


Image

  • Data analysis system and method
  • Data analysis system and method
  • Data analysis system and method

Examples


Embodiment Construction

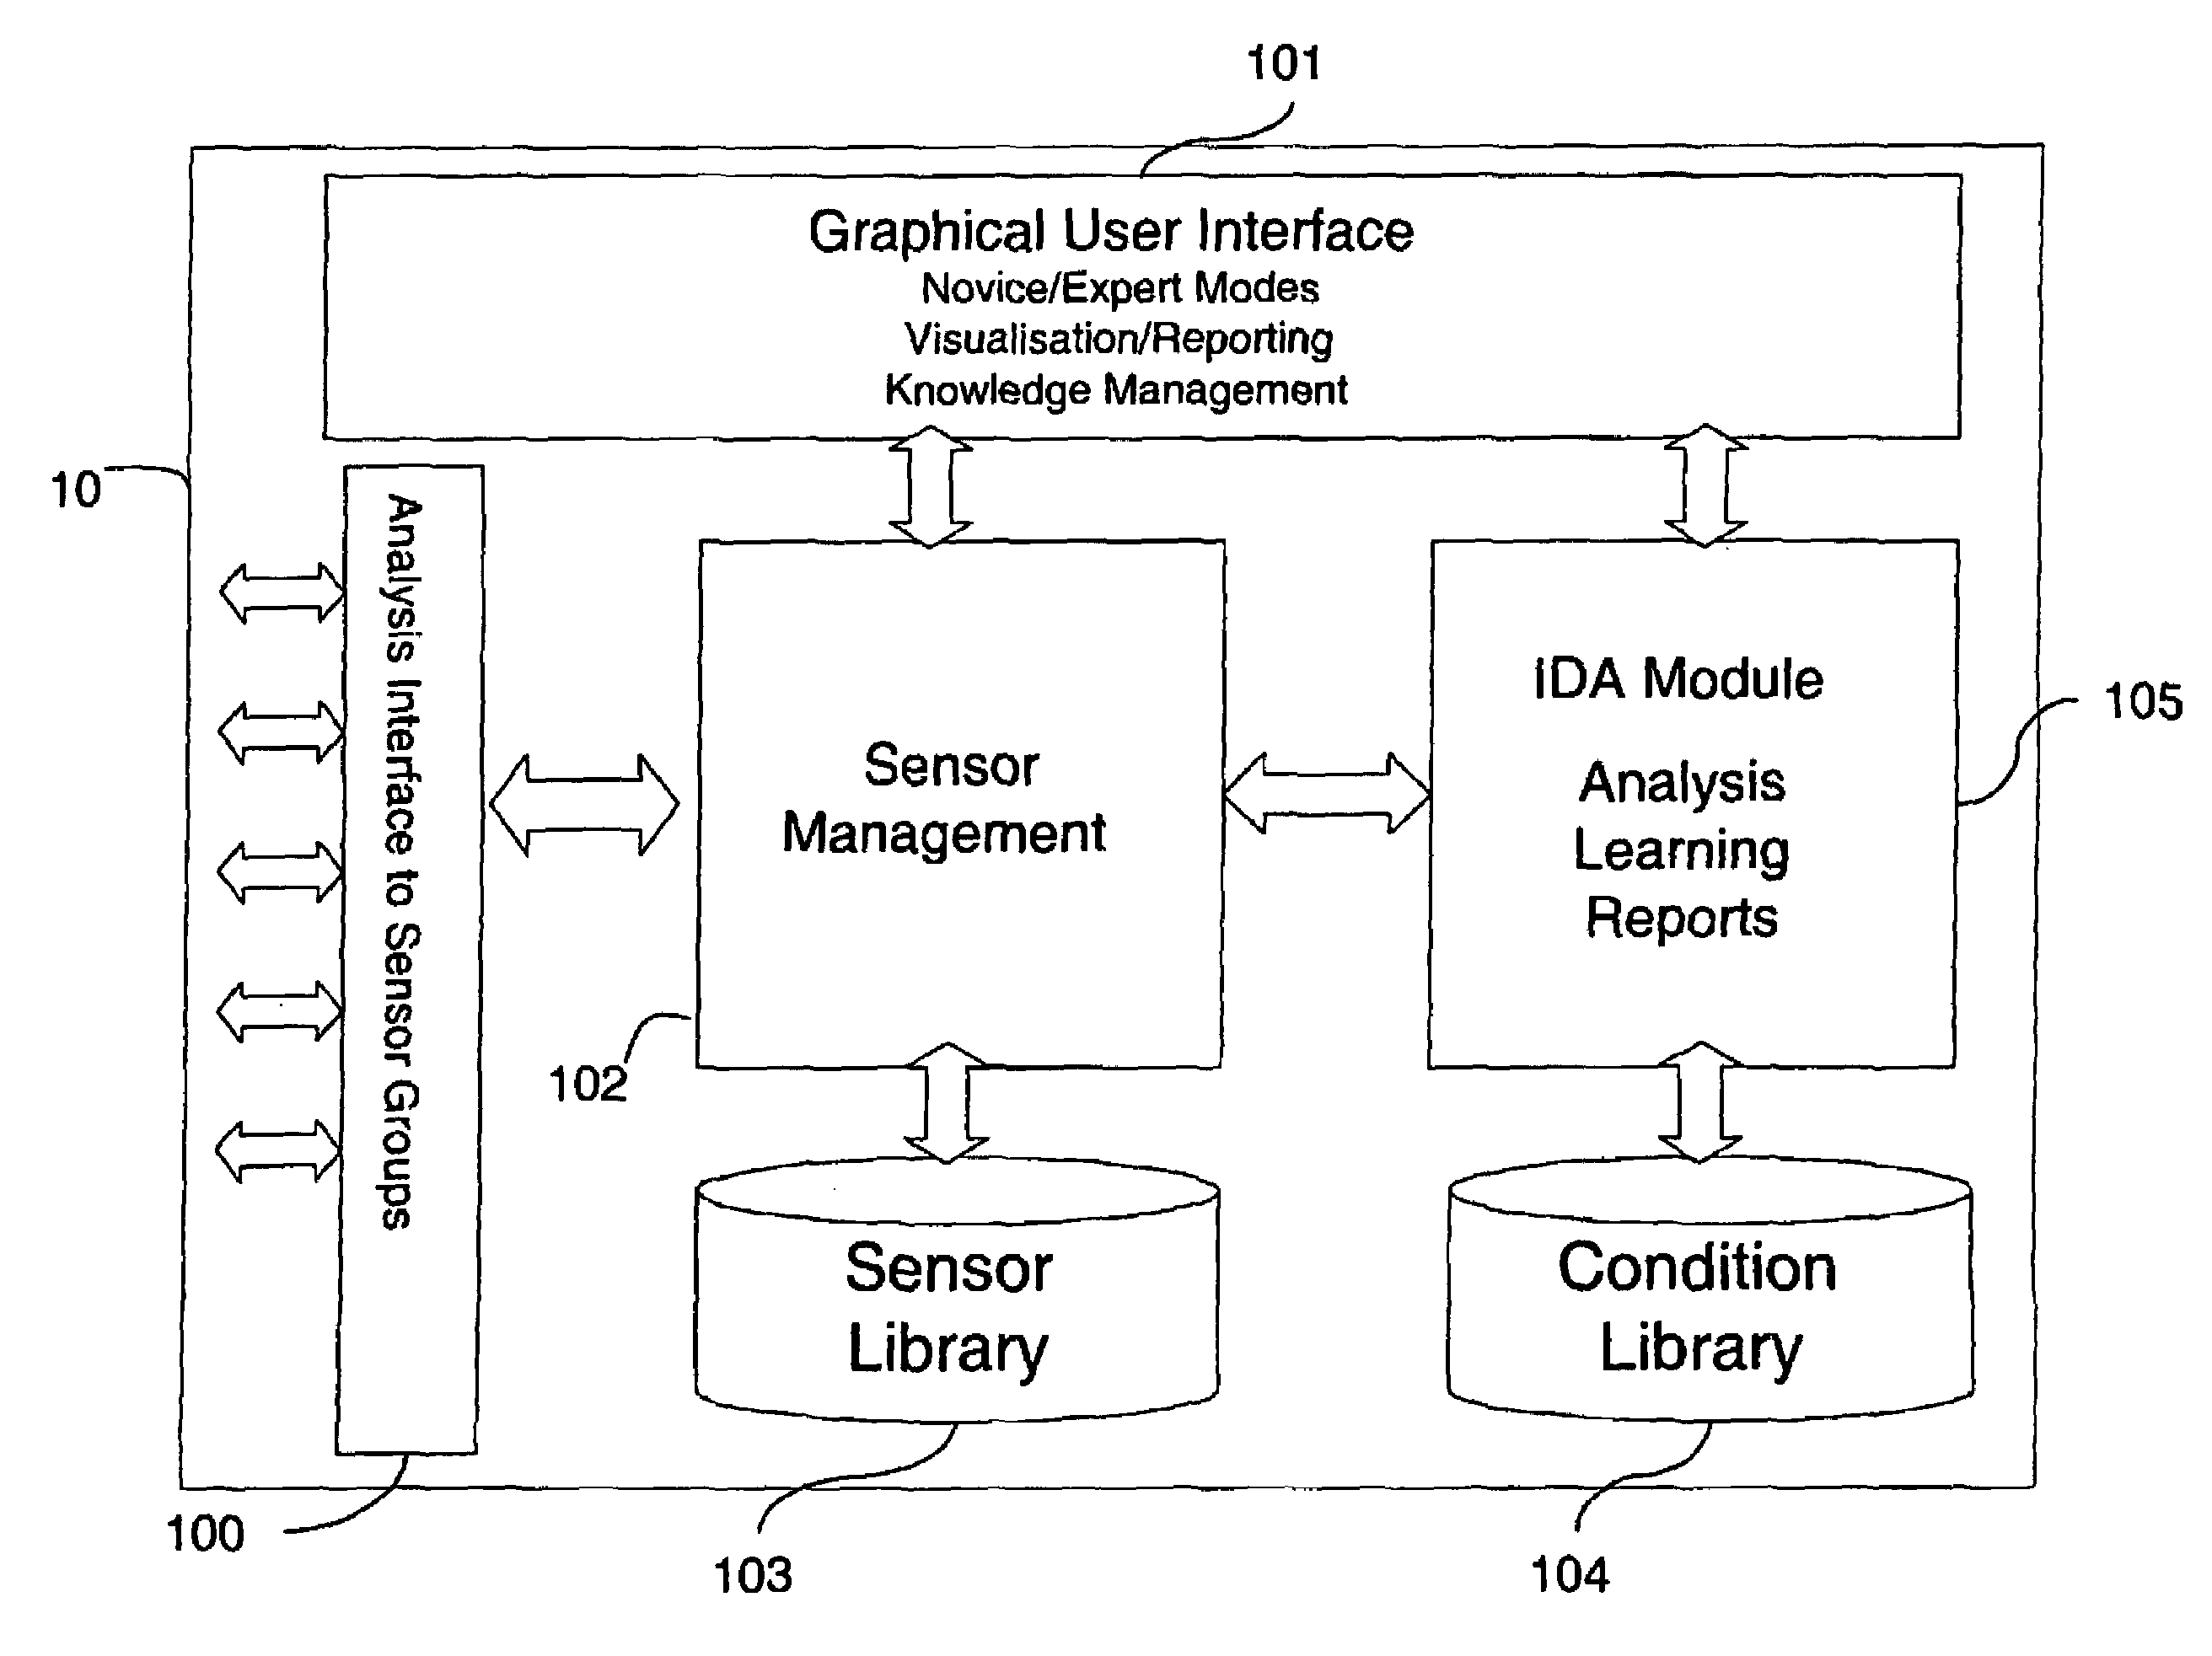
[0081]With reference to FIGS. 8 to 10, an Intelligent Data Analysis (IDA) unit 10 for a sensor network is shown. This unit is responsible for collecting, managing and analysing data from a hierarchically structured network of sensors. The IDA unit 10 allows users to add sensors to or remove them from the network, organise them into groups, configure them and analyse the data they produce. The IDA unit 10 allows for automatic data analysis by learning normal / abnormal patterns in sensor data. On detection of abnormal patterns an alarm is raised automatically. The user can configure the learning and analysis features of the unit by specifying rules for individual sensors. The unit also provides analysis of historic sensor data and generates reports on demand.

Functions of the IDA unit 10 may include:

[0082]Providing an output to a GUI that allows users to configure and analyse sensor data;[0083]Managing a sensor network by organising sensors into sensor groups;[0084]Accessing and intelli...


PUM


Abstract

Data from a monitoring system is analyzed for monitoring characteristics of a dynamic system. Characteristic data in respect of a dynamic system is monitored and provided with at least one known normal state. Characteristic data is received from a monitoring system and confirmation information from an operator when the dynamic system is in a known normal state. A normality model is derived including comprising data indicative of known normal states in response to received characteristic data and confirmation information. Future characteristic data is predicted from the normality model a difference function is provided indicating an acceptable difference between predicted and received characteristic data. Predicted characteristic data is compared with received characteristic data in conjunction with the difference function and an abnormality signal is produced if the difference exceeds the difference function.

Description

BACKGROUND[0001]This application is the US national phase of international application PCT / GB2004 / 001070 filed 12 Mar. 2004 which designated the U.S. and claims benefit of GB 0307406.9, dated 31 Mar. 2003, the entire content of which is hereby incorporated by reference.[0002]1. Technical Field[0003]The present invention relates to systems and methods for the analysis of data from a monitoring system for monitoring a dynamic system.[0004]2. Related Art[0005]Diagnosing abnormal behaviour of a system (e.g. a technical system, environmental conditions, vital signs, etc) is similar to a physician's diagnosis based on observing symptoms of a patient. Medical doctors are capable of interpreting symptoms and making a diagnosis based on data obtained from observing a patient. Even if the observed symptoms are not sufficient to determine the cause of an illness, medical doctors can often determine that a symptom or measurement is not normal because they know from experience what is normal in ...

Claims


Application Information

Patent Timeline
Patent Type & Authority Patents(United States)
IPC IPC(8): G05B13/02G06F15/00G06F15/18A61B5/00G05B23/02
CPCG05B17/02G05B23/0254Y10S706/90
Inventor NAUCK, DETLEF DAZVINE, BEHNAMSPOTT, MARTIN
Owner BRITISH TELECOMM PLC
Learn More