Method of detection of SP-A2 gene variants
a gene variant and gene technology, applied in the field of predicting the susceptibility of individuals to pulmonary tuberculosis, can solve the problems of untreated disease, association has not been consistently demonstrated, and disease, if untreated, can be fatal
- Summary
- Abstract
- Description
- Claims
- Application Information
AI Technical Summary
Benefits of technology
Problems solved by technology
Method used
Image
Examples
example 1
Identification of Allelic Variants of SP-A2 Gene
[0065]This example describes the identification of allelic variant of human surfactant protein A 2 gene by PCR and sequencing using certain oligonucleotide primers. According to the invention DNA was extracted from human peripheral blood leukocytes using a modification of salting out procedure. The concentration of the DNA was determined by measuring the optical density of the sample, at a wavelength of 260 nm. The DNA was then amplified by PCR by using the oligonucleotide primers.
[0066]
SEQ ID 1 - 5′ CTG CGT GCG AAG TGA AGG ACG TTT GTG TTG 3′(Forward)SEQ ID 2 - 5′ GAC CCC CAT CAC CCC TGT GTA ACT GAC TTC 3′(Reverse)SEQ ID 3 - 5′ TGC CTG GAG CCC CTG GTG TCC CTG GAG AGC 3′(Forward)SEQ ID 4 - 5′ TGC CTC GTC CGC ATT CAC CCT TCA GAC TGC 3′(Reverse)
[0067]The sample were denatured at 95° C. for 5 minutes followed by 28 cycles of denaturation (95° C., 1 minutes), annealing (70° C., 1 minute), extension (72° C., 1 minute) and a final extension o...
example 2
Nucleotide Sequence of the Allelic Variant of SP-A2 Gene.
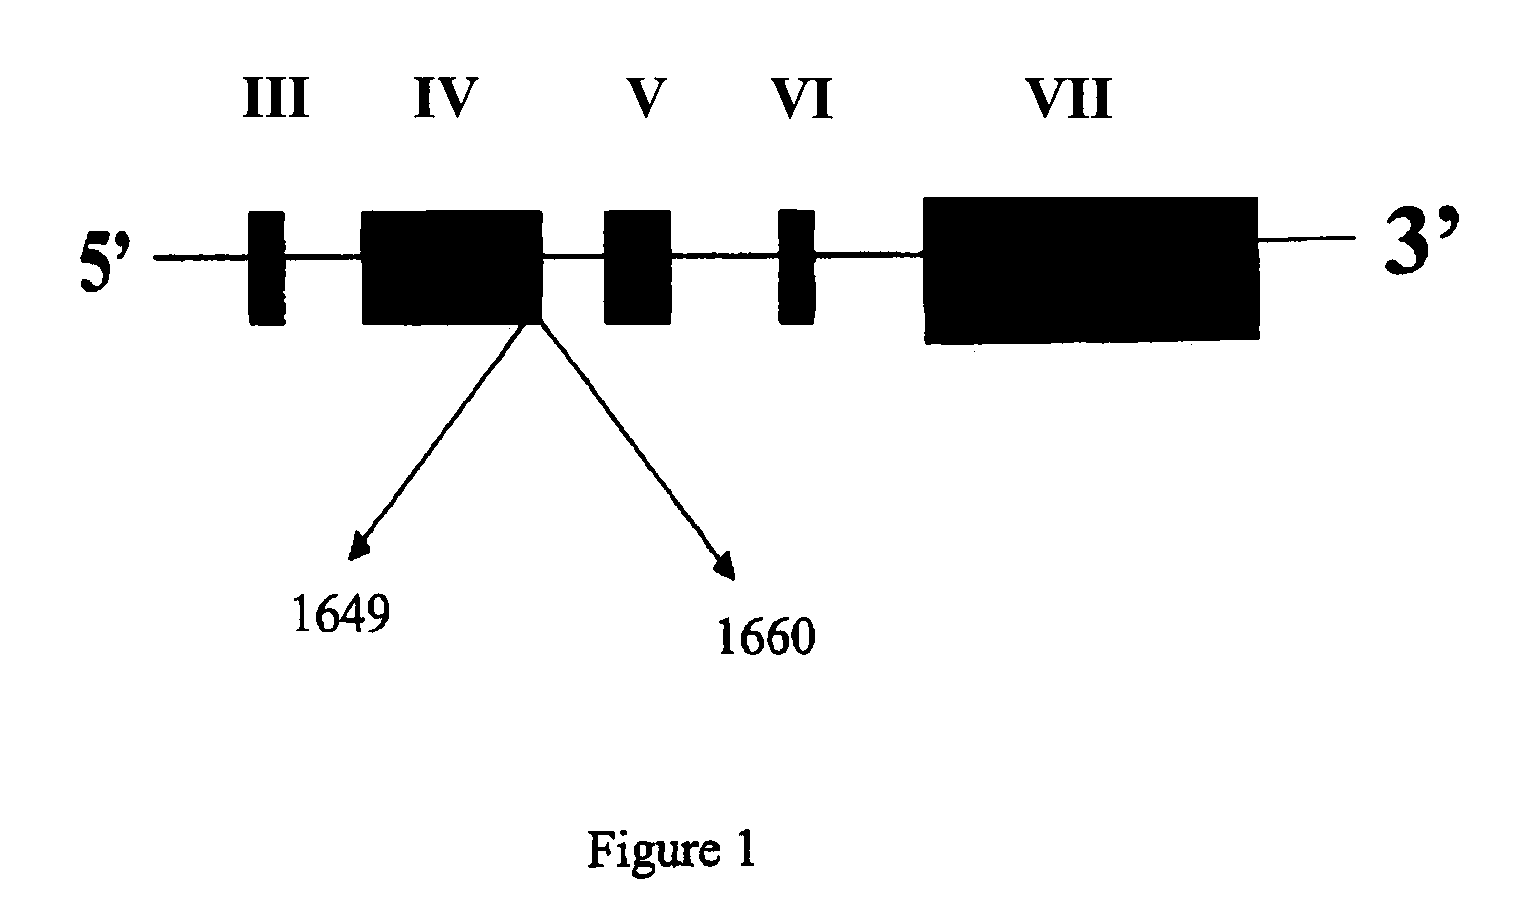
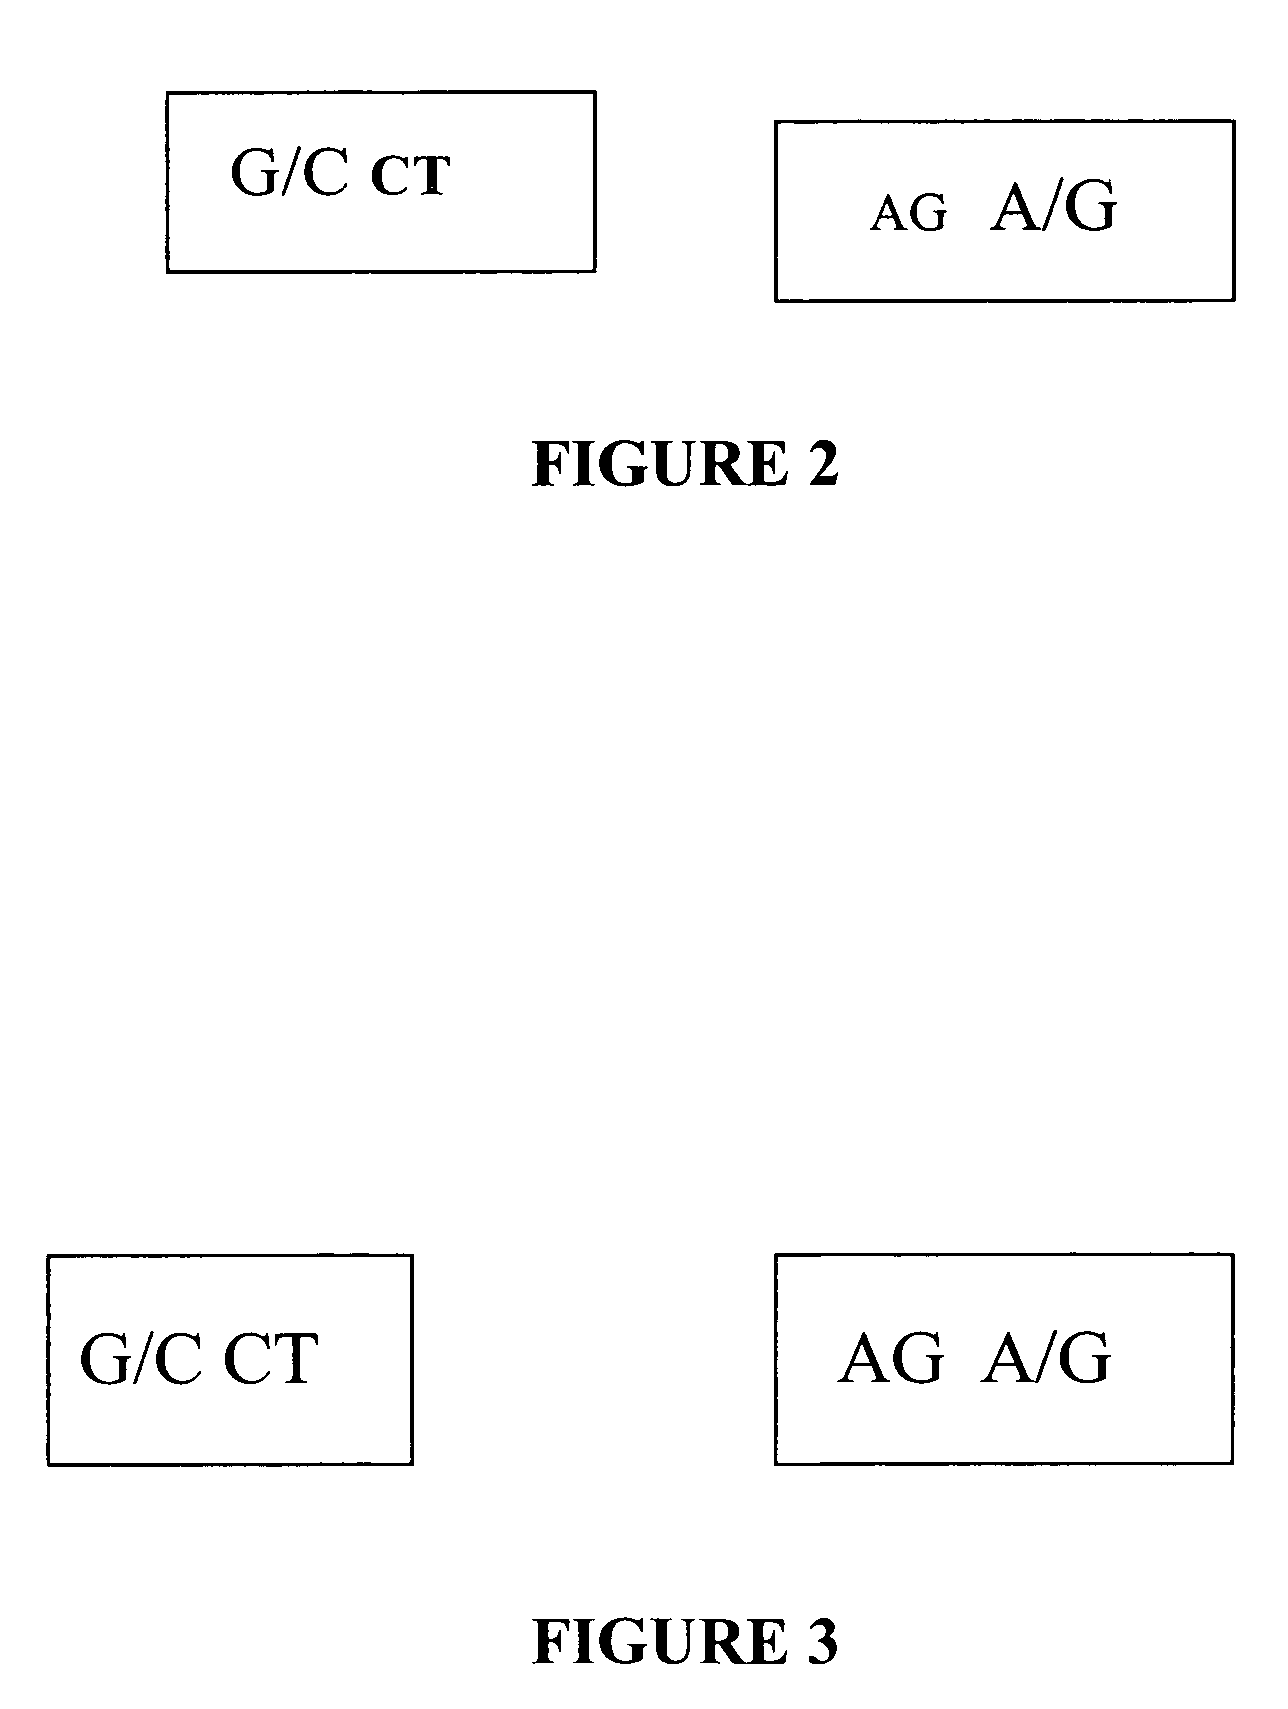
[0068]The nucleotide seq. of the allelic variant of SP-A 2 gene derived using the method as described in example 1. In the above sequence the 2 SNP's as given in table 1 are at nucleotide position 1649 and 1660.
example 3
[0069]Patients with the A allele at the 1660 position are at nearly zero risk for pulmonary tuberculosis disease. A method as described in example 1 is applied to a series of DNA samples extracted from pulmonary tuberculosis positive individuals and normal controls. There is observed a statistically significant difference (At position 1649 p=0.1320 and at position 1660 p=0.0000) in the frequency distributions of the SNP haplotypes generated using SNP in normal and pulmonary tuberculosis patient SP-A2 chromosome. The results obtained are summarized in Table III below:
[0070]
TABLE IIISNP (G vs A) at 1660SNP (G vs C) at 1649 positionpositionODDS'RATIO1.576 8.9412(pulmonary0.8696 3.3136 tuberculosispatient vsNormal)Chi-square2.26124.175p-value0.1320 0.0000
[0071]A strong association of G (at 1649 position) and G (at 1660 position) haplotypes with pulmonary tuberculosis disease chromosome indicated that SP-A2 alleles with the G (at 1649 position) and G (at 1660 position) haplotypes are pr...
PUM
| Property | Measurement | Unit |
|---|---|---|
| frequency distribution | aaaaa | aaaaa |
| frequency | aaaaa | aaaaa |
| Frequency | aaaaa | aaaaa |
Abstract
Description
Claims
Application Information
 - R&D
- Intellectual Property
- Life Sciences
- Materials
- Tech Scout
- Unparalleled Data Quality
- Higher Quality Content
- 60% Fewer Hallucinations
Browse by: Latest US Patents, China's latest patents, Technical Efficacy Thesaurus, Application Domain, Technology Topic, Popular Technical Reports.
© 2025 PatSnap. All rights reserved.Legal|Privacy policy|Modern Slavery Act Transparency Statement|Sitemap|About US| Contact US: help@patsnap.com


