Position detection technique

a technology of position detection and detection method, applied in the field of position detection technique, can solve the problems of erroneous detection, marked decline in detection rate, and diminishing of mark signal amplitude and noise signal amplitude, so as to reduce the erroneous detection of mark position

Inactive Publication Date: 2008-08-26
CANON KK
View PDF9 Cites 16 Cited by
  • Summary
  • Abstract
  • Description
  • Claims
  • Application Information

AI Technical Summary

Benefits of technology

[0017]The present invention, which takes into consideration the conventional technique described above, has as its object to reduce erroneous detection of a mark position.
[0022]In accordance with the present invention, erroneous detection of a mark position can be reduced.

Problems solved by technology

In a case where mark position detection is carried out using a pattern recognition technique of the kind cited as (i) to (iii) above, a rate of detection declines markedly owing to a decline in the image quality of the observed image.
However, owing to process fluctuations and illumination conditions, there are instances where (1) the average luminance of each partial image differs from one observed image to another, and (2) the difference between the amplitude of the mark signal and the amplitude of a noise signal diminishes.
Further, in a case wherein the difference between the amplitude of the mark signal and the amplitude of the noise signal diminishes as mentioned at (2) above, there are instances where the difference between edge information of the mark and edge information of a noise portion vanishes, thereby resulting in erroneous detection.
This means that in a case wherein the average luminance of each partial image differs from one observed image to another in (1) above, erroneous detection may occur.
Consequently, there are cases wherein erroneous detection occurs.
(B) With the cross-correlation method (ii) or Fourier phase correlation method (iii), erroneous detection may occur if the average luminance of the mark image is lower than that of other portions.
(C) Further, a problem common to the vector correlation method, cross-correlation method and Fourier phase correlation method is that if the amount of noise in the observed image is great, the difference between the evaluation values of the mark and other portions diminishes, and may result in erroneous detection.

Method used


Image

  • Position detection technique
  • Position detection technique
  • Position detection technique

Examples


first embodiment

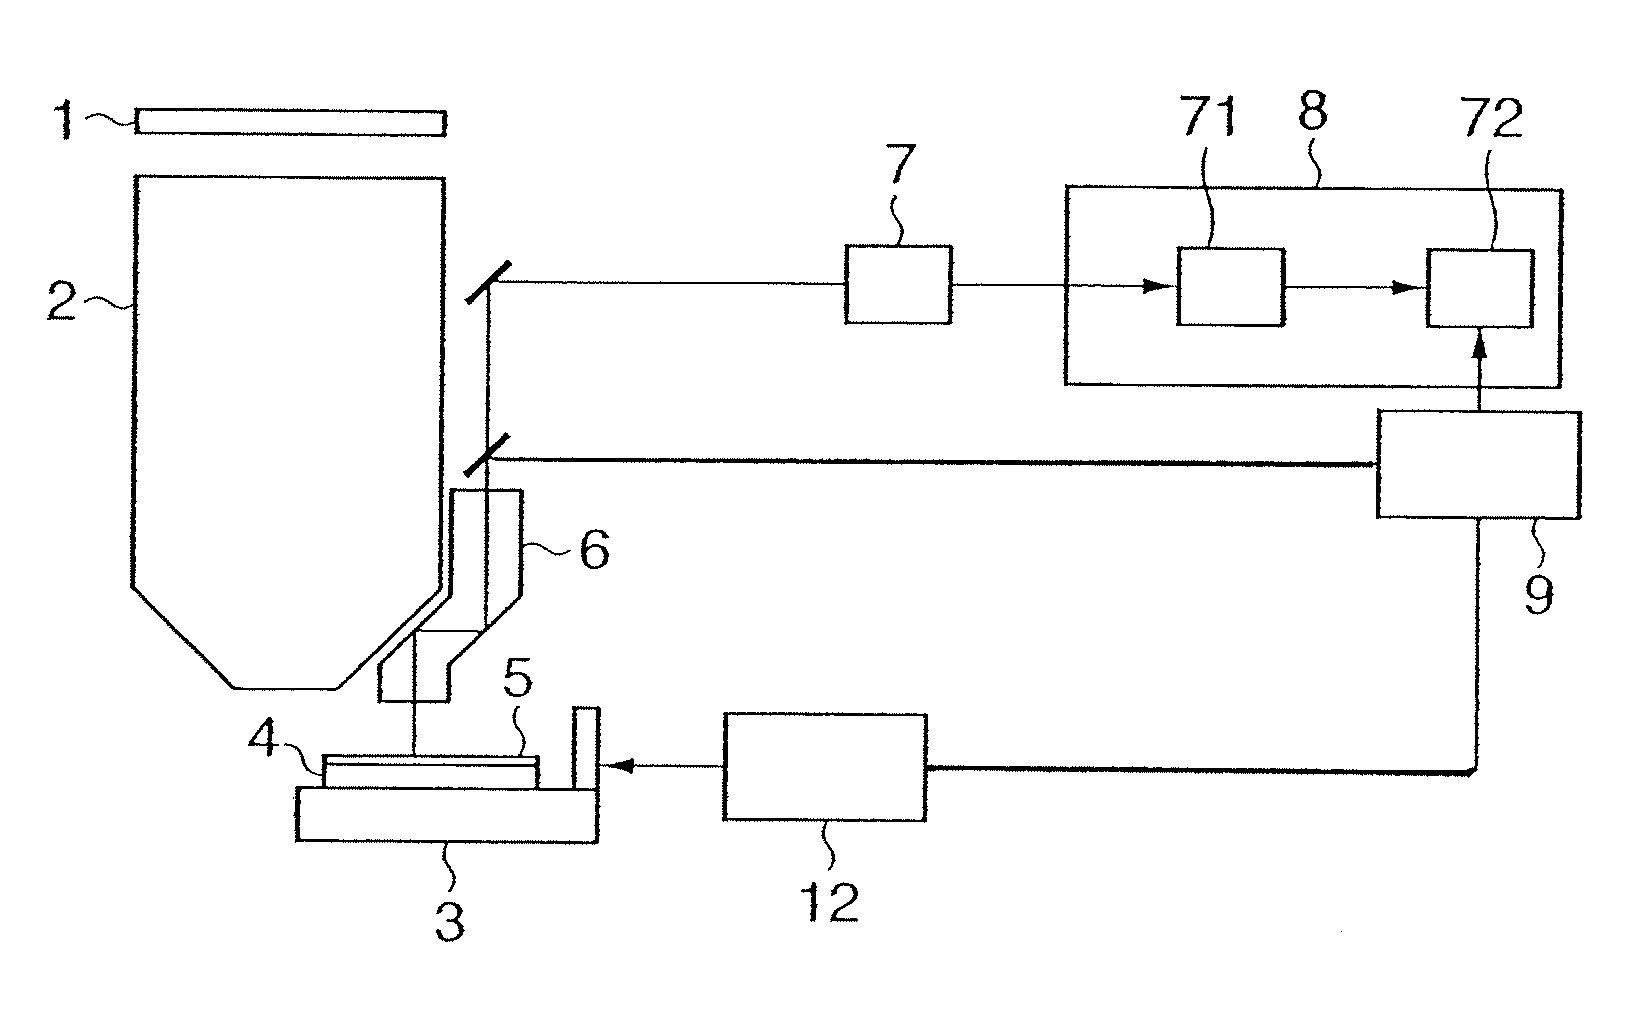
[0068]FIG. 3 schematically illustrates the structure of a semiconductor exposure apparatus. A first embodiment of the present invention is applied to pre-alignment detection by an off-axis scope 6 in FIG. 3.

[0069]A pattern to undergo exposure is present on a reticle 1 and is illuminated using I-rays or an excimer laser in an illumination system (not shown). A wafer 5 is exposed to the pattern by a projection lens 2.

[0070]Pre-alignment is carried out upon placing the wafer in a wafer suction chuck 4 on an XY stage 3 by a wafer transport apparatus, not shown. Since the wafer 5 is placed in the chuck with the precision possessed by the transport apparatus, a transition to precise measurement of the wafer position cannot be performed, as is, in view of precision. Accordingly, a detection mark for pre-alignment (coarse alignment) on the wafer is observed by the off-axis scope 6 constructed externally of the projection lens 2 and an opto-electronic conversion is applied by a CCD camera 7,...

second embodiment

[0106]In this embodiment, calculation by a method different from that of FIG. 6 described in the first embodiment is applied to the calculation of degree of correlation between probability distributions.

[0107]The processing for calculation of the degree of correlation between probability distributions differs from that of the first embodiment. Only the method of calculation of degree of correlation between probability distributions will be illustrated below.

[0108]FIG. 7 shows a processing of S4111 of FIG. 4. The method for calculating the degree of correlation between the probability distributions is explained in accordance with this process.

[0109]First, the probability distribution of the mark and the probability distribution of the partial image of FIG. 4 are read in (S7100).

[0110]Next, the power spectrum of the probability distribution of the mark and the power spectrum of the probability distribution of the partial image are read in (S7101).

[0111]The position-of-interest informa...

third embodiment

[0115]In this embodiment, calculation by a method different from that of FIG. 6 described in the first and second embodiments is applied to the calculation of the degree of correlation between probability distributions. The processing for calculation of the degree of correlation between probability distributions differs from that of the first and second embodiments. Only the method of calculation of the degree of correlation between probability distributions will be illustrated below.

[0116]FIG. 8 shows a processing of S4111 of FIG. 4. The method for calculating the degree of correlation between the probability distributions is explained in accordance with this process.

[0117]First, the probability distribution of the mark and the probability distribution of the partial image in FIG. 4 are read in (S8100).

[0118]Next, the position-of-interest information that was read in at S4110 is read in. This position of interest is a position on the probability distributions (S8101).

[0119]The appa...


PUM

PropertyMeasurementUnit
real-space energy distributionaaaaaaaaaa
energy spectrum distributionaaaaaaaaaa
real-space energy distributionsaaaaaaaaaa

Abstract

An apparatus for detecting a position of a region, corresponding to a mark, in image data, as a mark position, the mark including periodically arranged patterns. A first unit obtains a real-space energy distribution which corresponds to an energy spectrum distribution of each partial area of the image data. A probability distribution obtaining unit obtains a probability distribution based on the real-space energy distribution, the probability distribution indicating repetitive positions of the periodically arranged patterns and the intensity of periodicity at this position. A second unit obtains a degree of correlation between each probability distribution obtained by the probability distribution obtaining unit and a pre-registered probability distribution of the mark, and a third unit obtains the mark position based upon the degrees of correlation obtained by the second unit.

Description

CLAIM OF PRIORITY[0001]This application claims priority from Japanese Patent Application No. 2003-345890 filed on Oct. 3, 2003, which is hereby incorporated by reference herein.FIELD OF THE INVENTION[0002]This invention relates to a technique for detecting the position of a mark. More particularly, the invention relates to a technique for detecting a mark position using a digital image, e.g., a technique for detecting a mark position using image processing and pattern recognition technology in a semiconductor manufacturing apparatus employed in a production line.BACKGROUND OF THE INVENTION[0003]In a semiconductor manufacturing apparatus, alignment of a wafer and a reticle is carried out before a reticle pattern is projected onto the wafer to expose the wafer. In order to perform such alignment, usually, a digital image (referred to as an “observed image” below) centered on a mark on the wafer is loaded into the semiconductor manufacturing apparatus using an image input unit, such as...

Claims


Application Information

Patent Timeline
Patent Type & Authority Patents(United States)
IPC IPC(8): G06K9/62G06K9/36G06K9/68G03F7/20G03F9/00G06T1/00G06T7/00G06V10/25H01L21/027
CPCG06K9/3233G06T7/0042G06K9/522G06T7/73G06V10/25G06V10/431
Inventor MIYASHITA, TOMOYUKI
Owner CANON KK
Why Eureka
Try Eureka