
Chart view for reusable data markup language

a data markup and data technology, applied in the field of data processing systems, can solve the problems of data not being both, data manipulation often increasing expense and difficulty, and individual markup languages are not compatible with each other, and achieve the effects of low cost, rapid writing, and widespread access on demand

Inactive Publication Date: 2009-03-31
E NUMERATE SOLUTIONS INC
View PDF80 Cites 45 Cited by
  • Summary
  • Abstract
  • Description
  • Claims
  • Application Information

AI Technical Summary

Benefits of technology

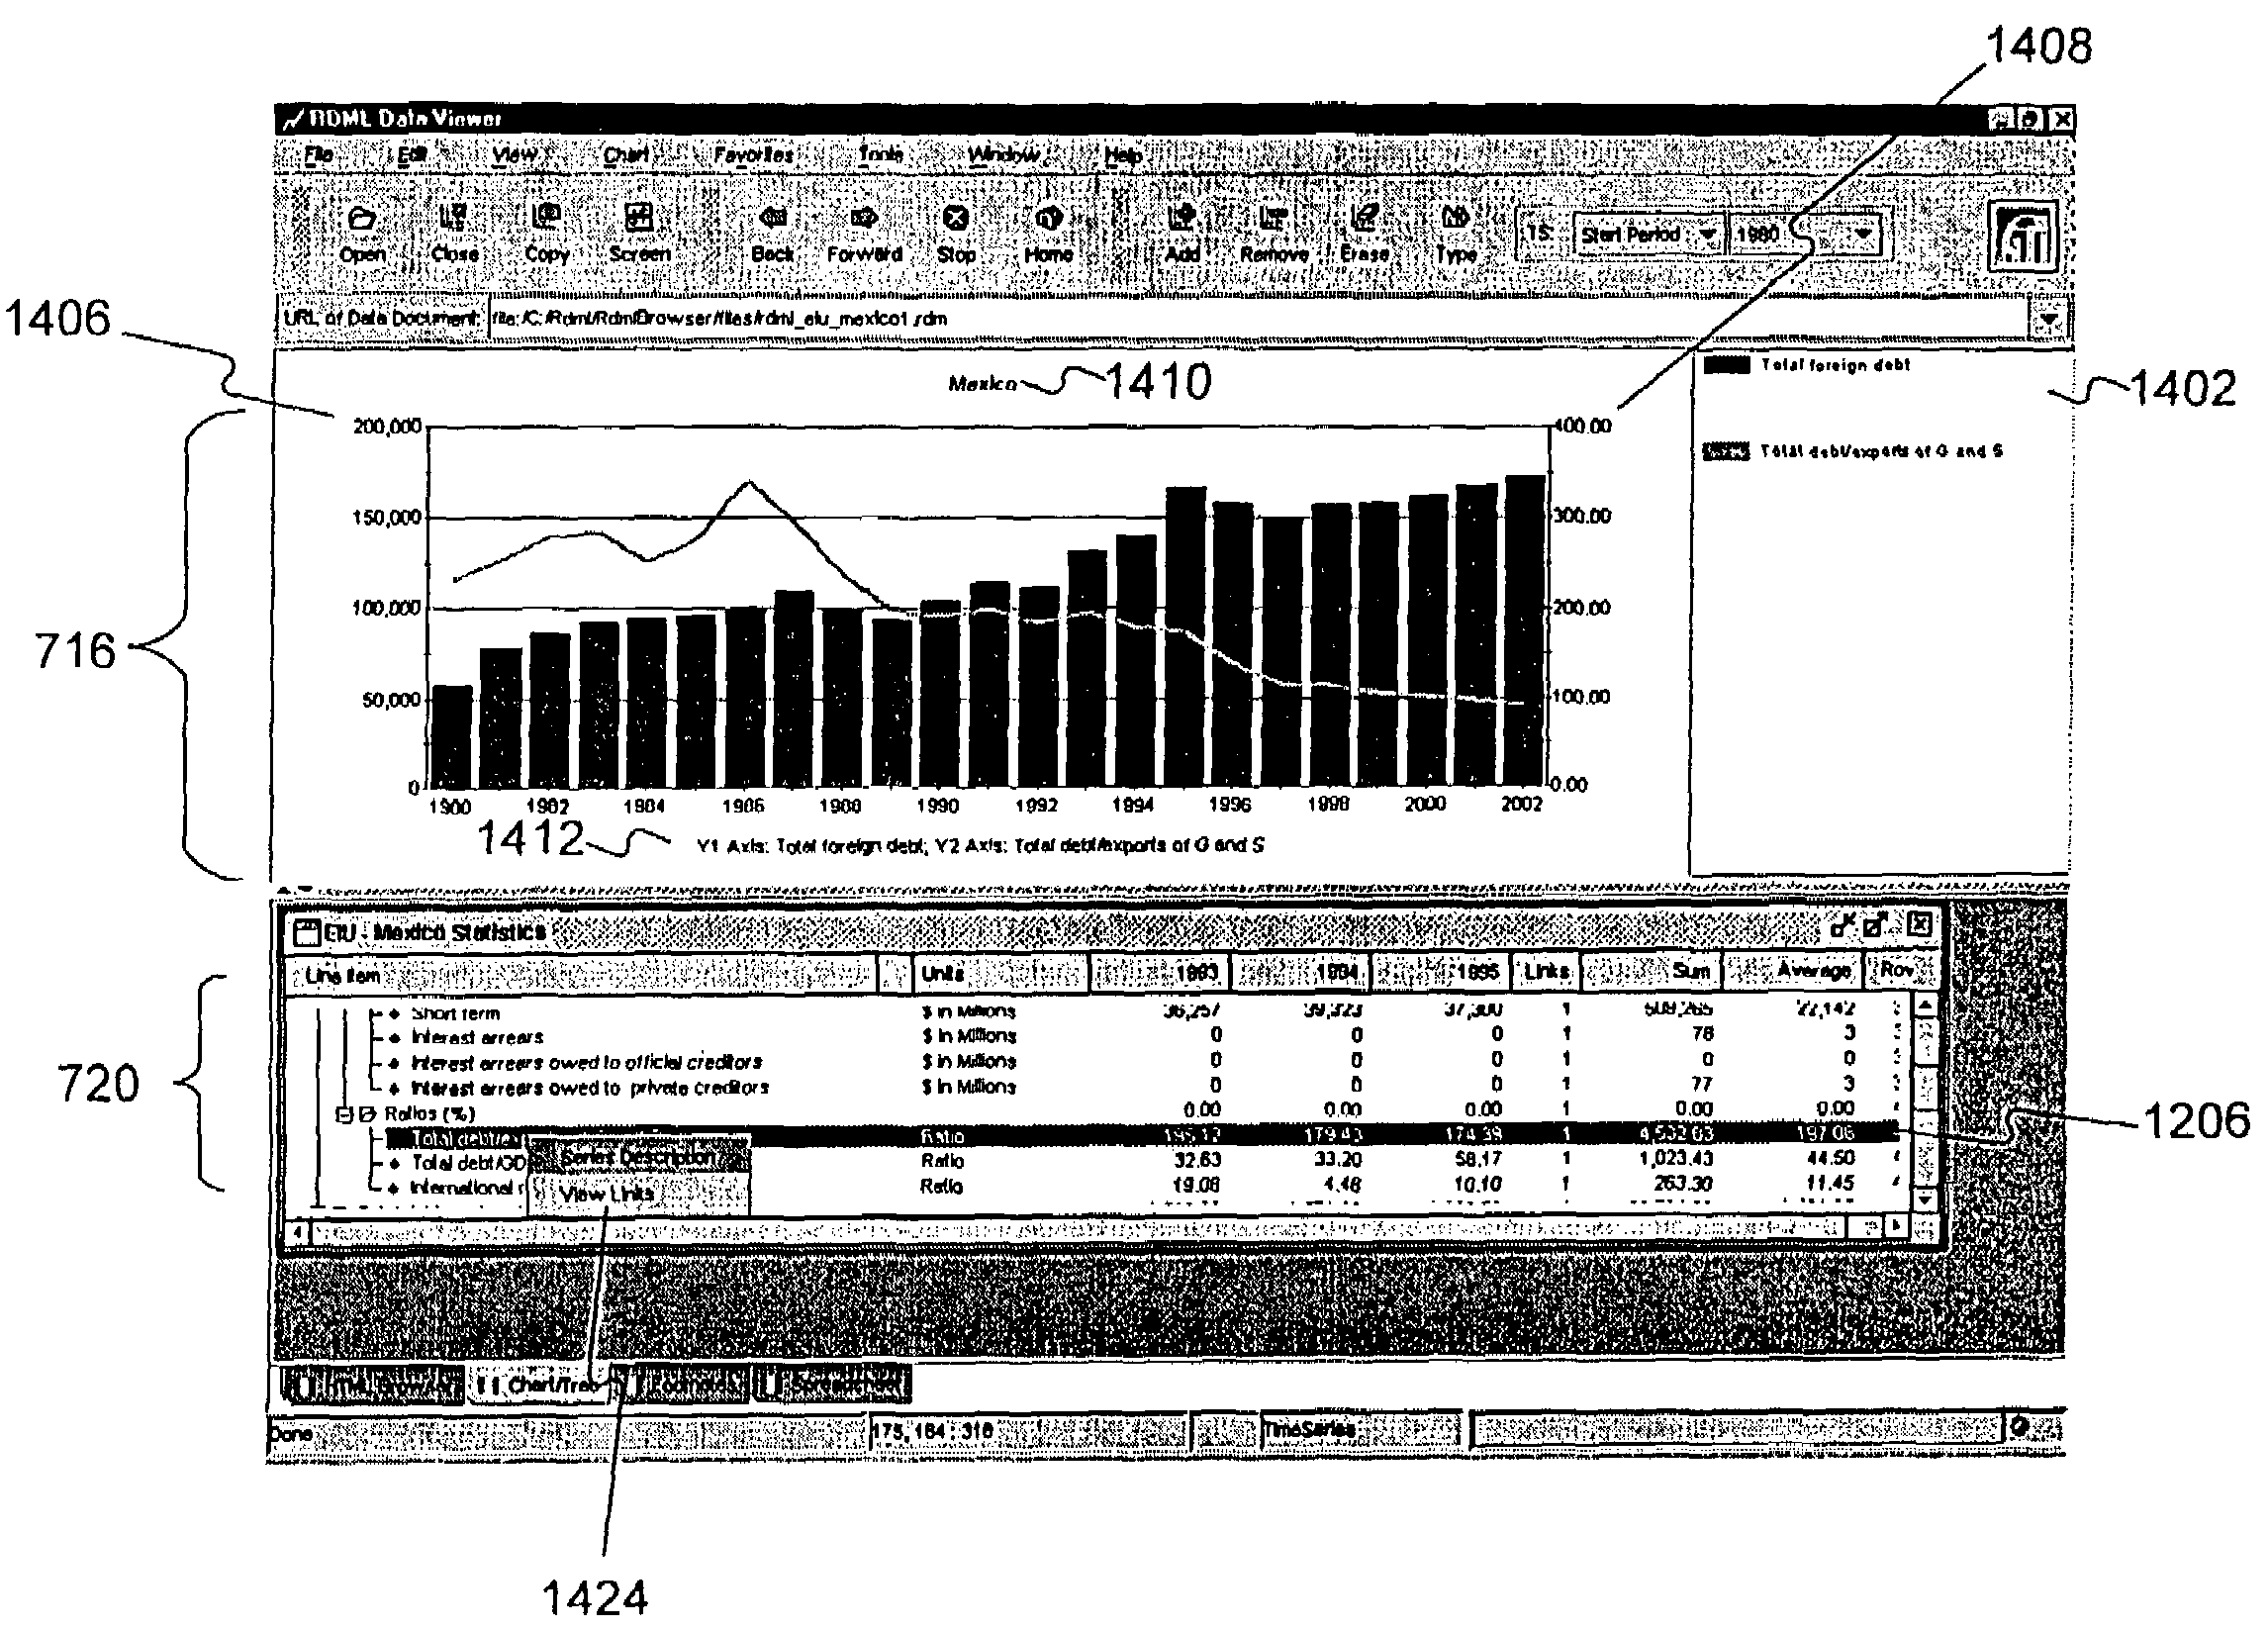
[0030]Methods and systems in accordance with the present invention provide a chart view that automatically manipulates and graphically displays numerical data. The manipulation and display is based on attributes associated with the numerical data describing characteristics of the numerical data. The chart view facilitates the simultaneous display of different series of numerical values of different types on a single chart and automatically displays appropriate descriptive textual components (e.g., axis labels, axis titles, chart titles, number precision, legends, footnotes, axis scales, etc.) The chart view allows single click transformations of series of numerical values and provides automatic formatting of descriptive textual components in response.
[0035]Methods and systems in accordance with the present invention provide a tree view that automatically manipulates and graphically displays numerical data. The tree view facilitates the simultaneous display of different series of numerical values of different types on a single display and automatically displays descriptive textual components. The tree view allows single click transformations of series of numerical values and provides automatic formatting of descriptive textual components in response. It further visually displays the relationship between series of numerical data for a user while supplying the user with hyperlinks associated with a given series of numerical data.
[0040]Methods and systems in accordance with the present invention provide a markup language, referred to as Reusable Macro Markup Language (“RMML”), for producing and utilizing macros which are reusable numerical analysis routines which can be written quickly, cheaply, and in a form usable by a broad range of data documents in RDML, the platform upon which the macros are run.
[0041]RMML allows reusable spreadsheet type macros to be posted as web documents, to be searched by search engines, to be combined into more complex programs, and to be reused with many data documents. RMML brings to spreadsheet manipulation routines the economic and productivity benefits of (1) standardization, (2) interchangeable parts, (3) specialization and assembly-line techniques in creation, and (4) economies of scale in creation and deployment. In addition, RMML brings to spreadsheet macros and numerical programming, some of the benefits of the World Wide Web: (1) widespread accessibility on demand, (2) ability to search for documents (in this case, search for capabilities and behavior of routines instead of text or data), and (3) the ability to hyperlink documents (including the ability of macros to call each other remotely).

Problems solved by technology

Further, HTML typically only works with text and images and typically only instructs a browser on how to display a document: the browser may read and display characters but does not “understand” the data content.
Consequently, conventional analytical programs allow for ad hoc review and manipulation of abstract numbers (e.g., a spreadsheet program or database program), but do not directly read their data from online sources.
Although XML's free-form structure permits the development of markup languages, such individualized markup languages are not compatible with each other because the use of the tags is not standardized in that different users use the tags for different purposes.
In today's business world, problems that typically accompany data manipulation often increase expense and difficulty.
One such problem is that often data and the documentation that describes the data are not both in electronic form.
This conventional approach to database and spreadsheet information often dictates that expensive database administrators are required to make transformations anytime data is being transferred from one system to another, expensive analysis of printed documentation is required in connection with any programming tasks, and the output rarely contains any indication of the original sources, structures, and manipulations that created that output.
Another obstacle impeding efficiency in conventional databases and spreadsheets is that calculations occur at too low of a conceptual level.
Analytic operations on single values at a time can be slow and prove costly when many different cells or record values are involved.
The lack of a standard markup language facilitating the browsing of numbers leaves no way to read, automatically manipulate and display differing types of numerical data read from multiple online sources on a single chart.
The computer industry is further hindered by the fact that data and analytic routines are not standardized.
While the computer industry has developed standards for file formats and function-level interfaces, it has not developed a general data format or content-analysis standards.
This results in expensive translation of data between systems, industries, companies and users using different protocols.
But the great investment in spreadsheet macros has generally been underutilized because such macros are “write once, use once” types of software; they are rarely reused by others.
One such problem is that spreadsheet data references usually are based on physical locations.
Another related problem is that numbers in spreadsheets have no measurement or semantic designators describing their meaning.
Absent a standard location and vocabulary, those indicators are useless.
An additional problem with conventional spreadsheet macros is the lack of documentation.
Because macros are typically only usable by their creators on the single spreadsheet they wrote them for, they tend to be totally undocumented: no common-language description, no help files, no data standards as to permissible values, source contact list, license information, etc.
Furthermore, there is no mass distribution mechanism for macros.
Spreadsheet macros are not web-friendly: they are generally limited to one spreadsheet brand and one platform, do not support hyperlinks, and cannot be searched by search engines.
Also, they are not supported by directory or classification system, and have no ready market.
Even further, users typically do not include unit testing, validity testing, error handling, and other end-user protections on the macros that they write.
The result is that users may be wary of the output of macros that they might try to add to their spreadsheets.
Conventional spreadsheet macros have difficulty making graphical interfaces to the data.
The lack of related graphical components further fuels this problem.
Finally, conventional spreadsheet macros are either too small to be worth a marketing effort, or too difficult to use to find a large audience.
This results in a lack of a business incentive to make them.

Method used


Image

  • Chart view for reusable data markup language
  • Chart view for reusable data markup language
  • Chart view for reusable data markup language

Examples


Embodiment Construction

[0068]Because of the length of the detailed description, the following table of contents is provided.

[0069]

TopicSectionReusable Data Markup Language OverviewIReusable Macro Markup Language OverviewI.ASystem Hardware ComponentsIISystem OverviewIIISystem DetailsIVInternal Data Viewer ArchitectureIV.ADocument Type DefinitionIV.A.1Reader, Parser and ProcessorIV.A.2X-value Transformer and Line Item Set TypesIV.A.3Primary Data StoreIV.A.4Chart ViewIV.A.5Tree ViewIV.A.6Spreadsheet ViewIV.A.7Footnote ViewIV.A.8Tagging WizardIV.A.9Aspects of RDML DocumentsIV.A.10Graphical User Interface and HTML browserIV.BReusable Macro Markup LanguageIV.CRMML Macro PackageIV.C1

I. RDML Overview

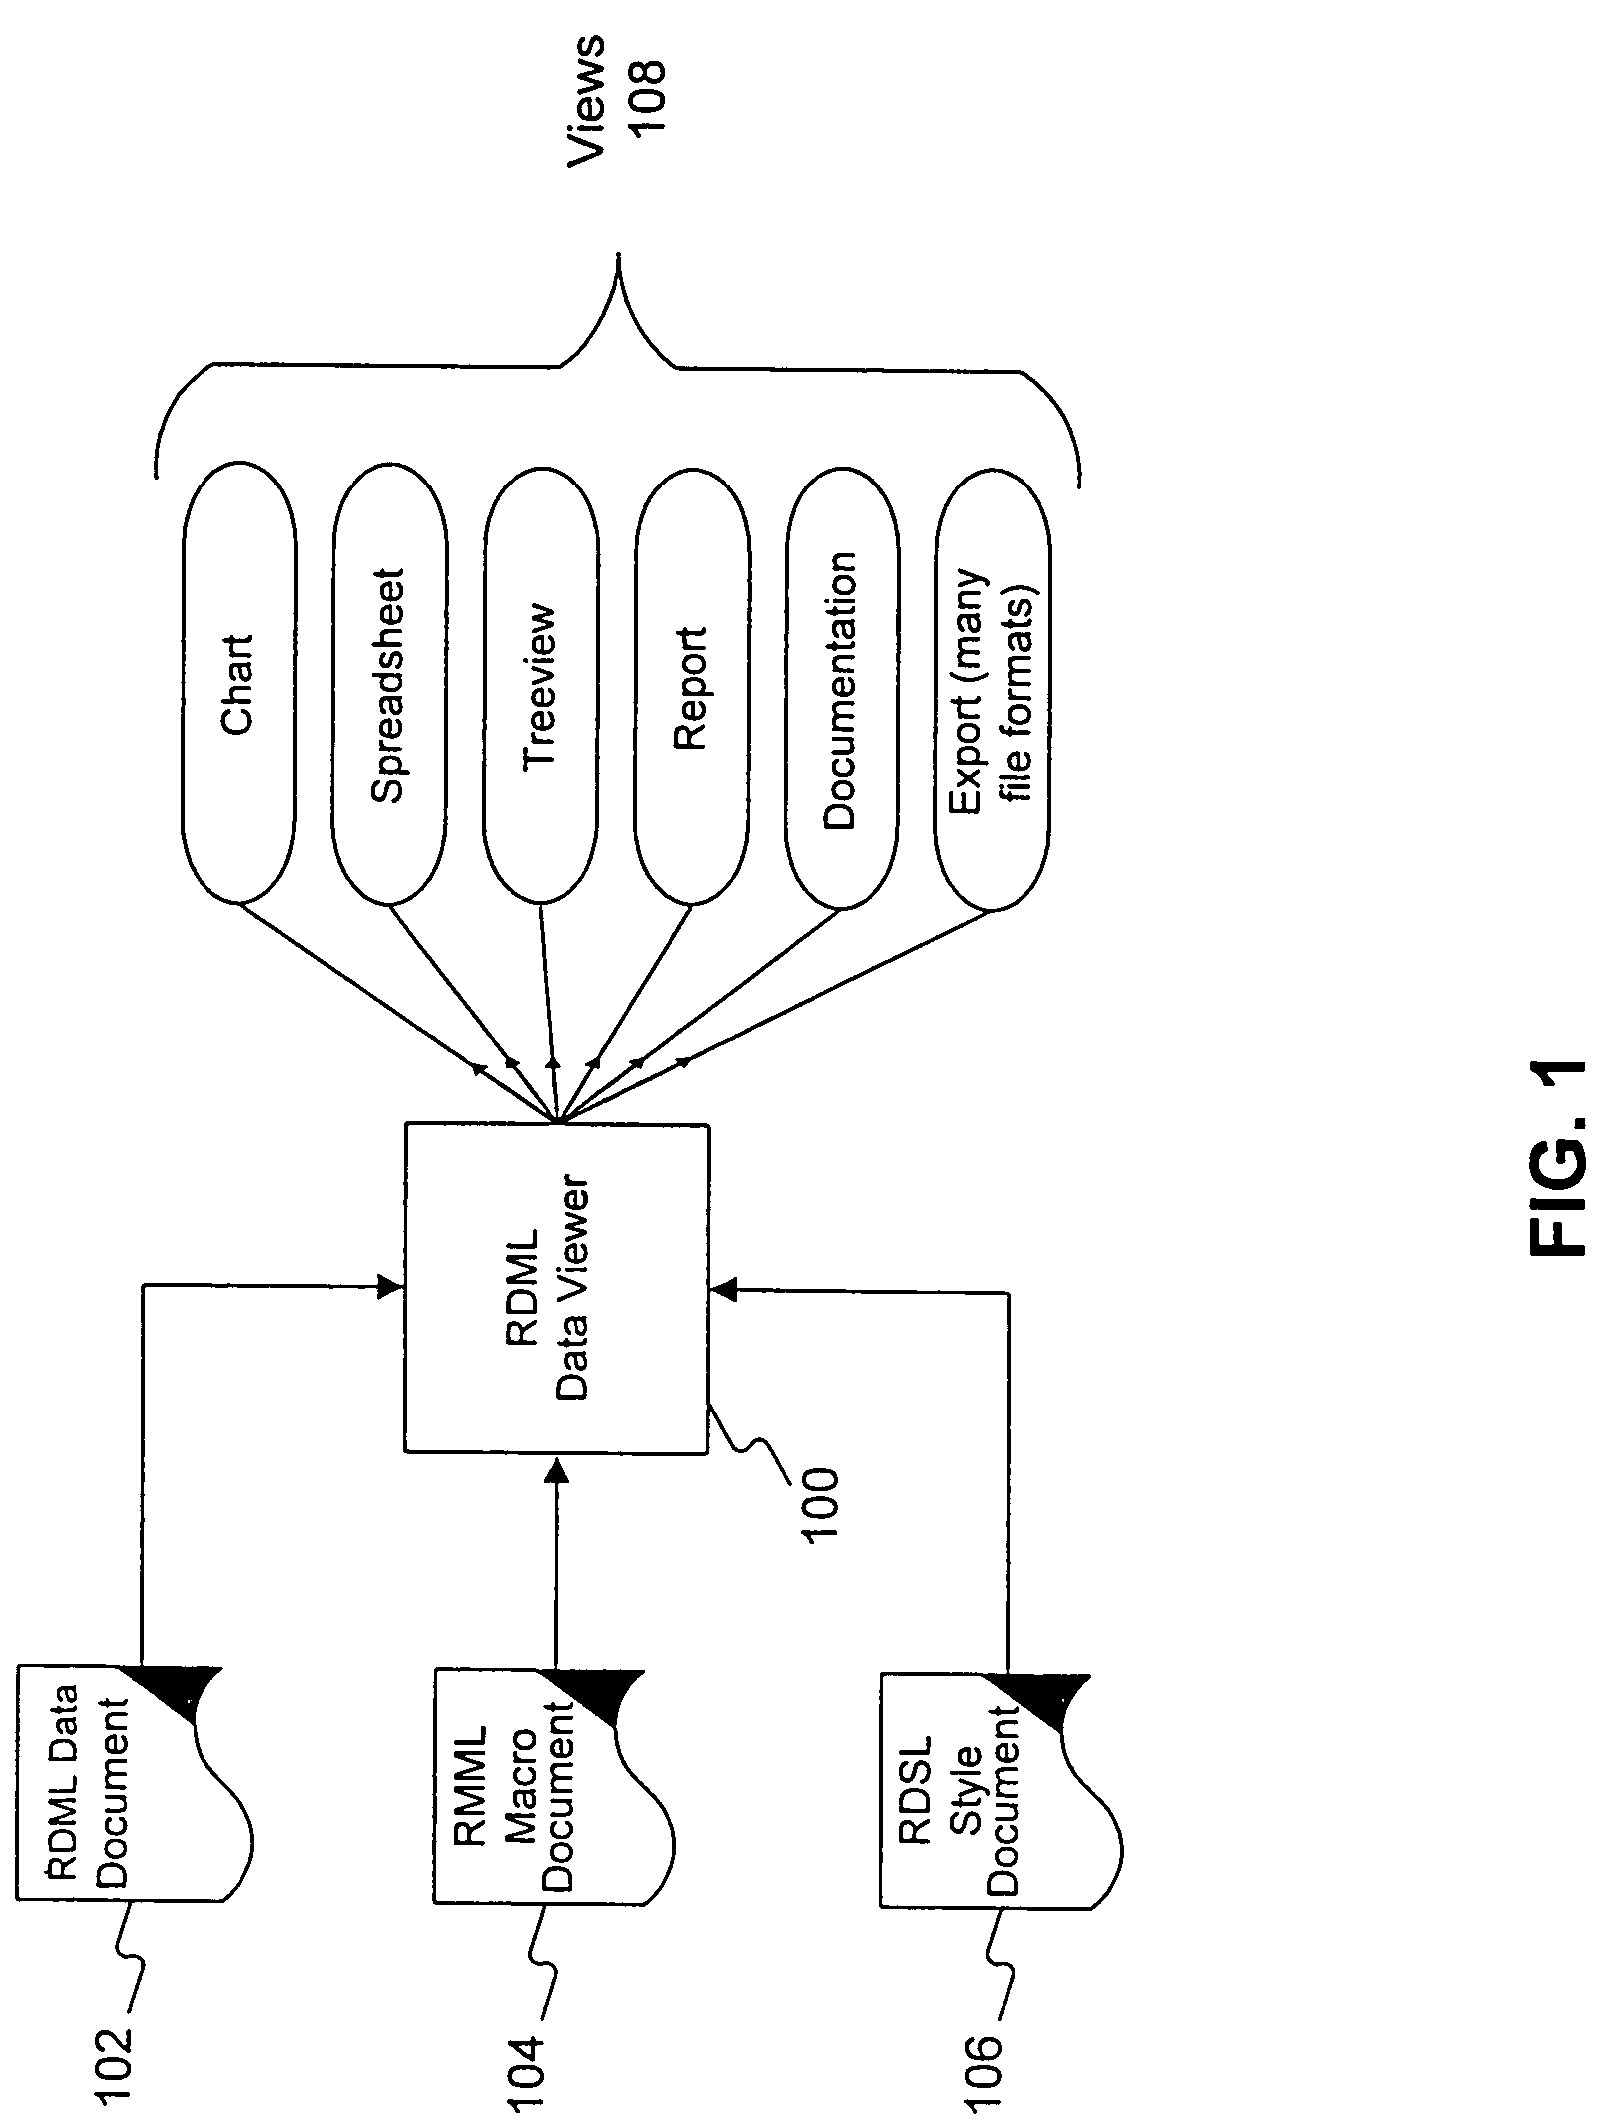
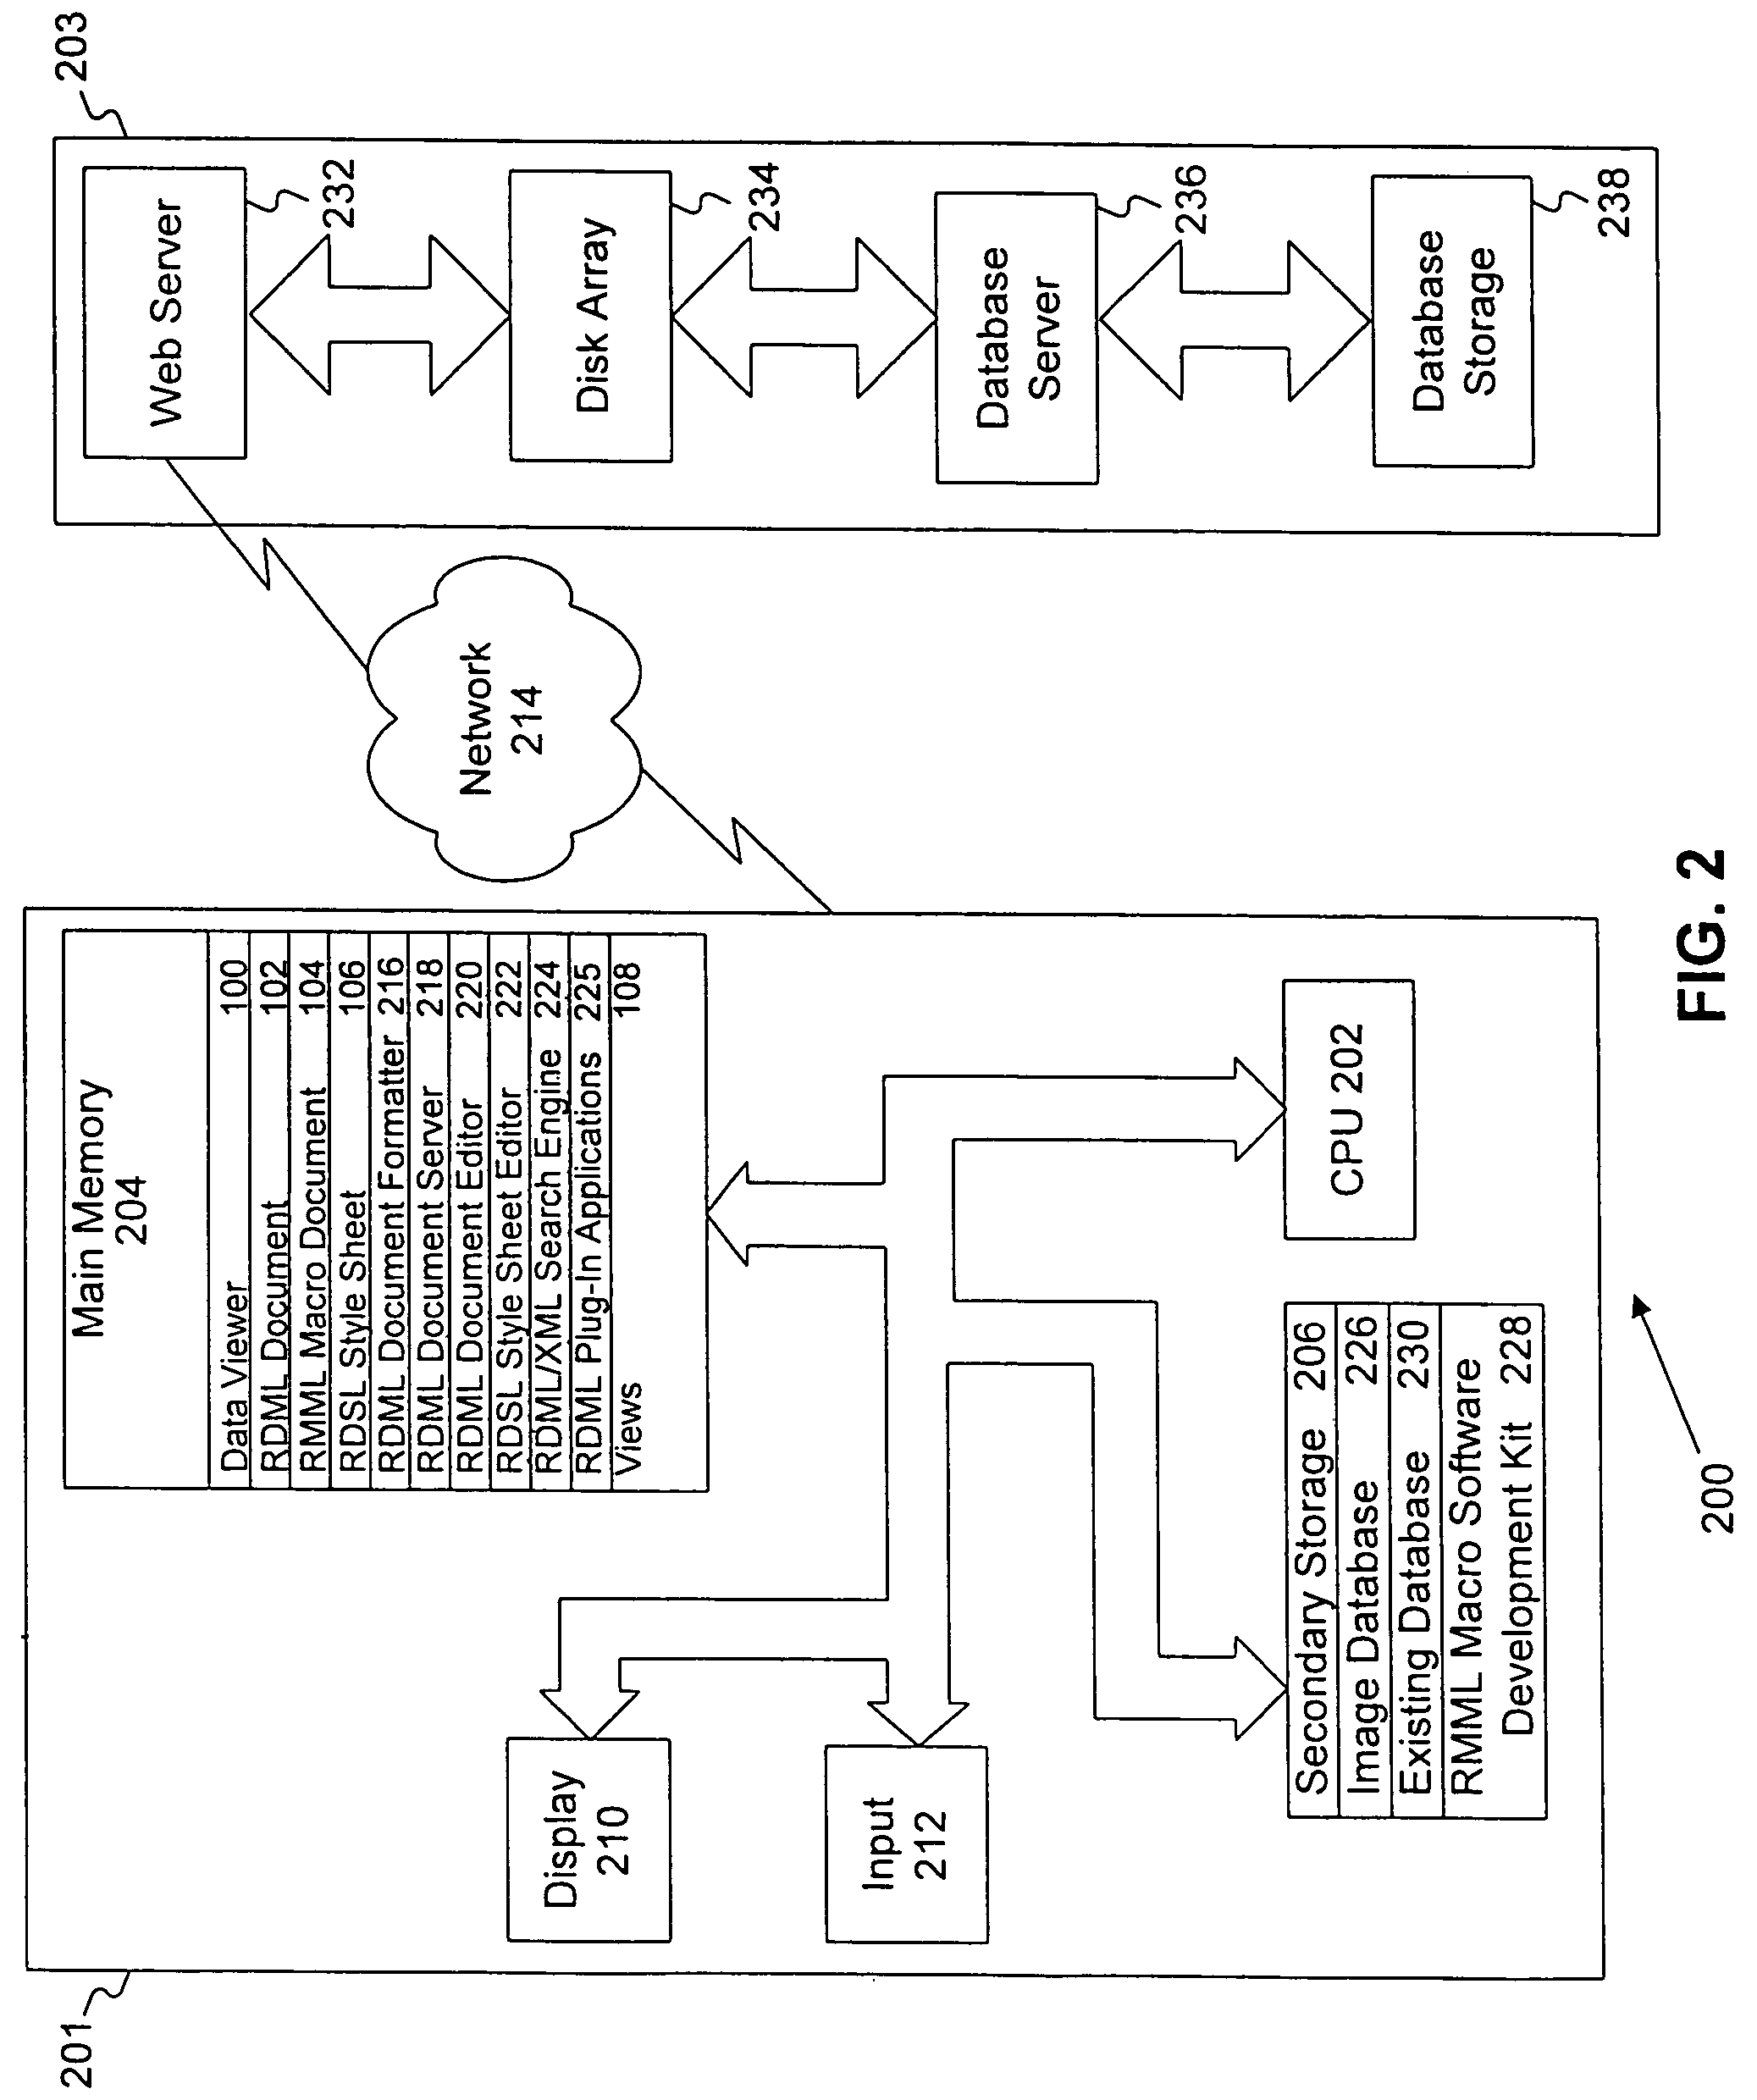
[0070]Methods and systems consistent with the present invention provide a markup language, referred to as Reusable Data Markup Language (“RDML”), and a data viewer referred to as the RDML data viewer that is used to retrieve, manipulate and view documents in the RDML format. Generally, RDML permits the browsing and ma...


PUM


Abstract

Methods and systems provide a “chart view” for a markup language referred to as Reusable Data Markup Language (“RDML”). Generally, a chart view comprises the components necessary for automatically manipulating and displaying a graphical display of numerical data contained in RDML markup documents. RDML is a markup language, such as the Hypertext Markup Language (“HTML”) or the Extensible Markup Language (“XML”). Generally, RDML facilitates the browsing and manipulation of numbers, as opposed to text as in HTML, and does so by requiring attributes describing the meaning of the numbers to be attached to the numbers. Upon receiving RDML markup documents, the chart view transforms, formats, manipulates and displays data stored in the markup documents using the attributes describing the meaning of the data. The chart view uses the attributes of the numbers to, for example, facilitate the simultaneous display of different series of numbers of different types on a single chart and automatically display appropriate axis labels, axis titles, chart titles, number precision, etc. A chart view may be a component of a data viewer used to retrieve, manipulate, and view documents in the RDML format.

Description

RELATED APPLICATIONS[0001]This is a divisional of application Ser. No. 09 / 573,413, filed May 18, 2000, now U.S. Pat. No. 6,920,608 which claims the benefit of U.S. Provisional Patent Application No. 60 / 135,525, filed May 21, 1999, and 60 / 183,152, filed Feb. 17, 2000, which are incorporated herein by reference.[0002]The following identified U.S. patent applications are also relied upon and are incorporated by reference in this application.[0003]U.S. patent application Ser. No. 09 / 573,778, entitled “Reusable Data Markup Language,” and filed on May 18, 2000.[0004]U.S. patent application Ser. No. 09 / 573,780, entitled “Reusable Macro Markup Language,” and filed on May 18, 2000.[0005]U.S. patent application Ser. No. 09 / 573,419, entitled “Tree View for Reusable Data Markup Language,” and filed on May 18, 2000.[0006]U.S. patent application Ser. No. 10 / 052,250, entitled “RDX Enhancement of System and Method for Implementing Reusable Data Markup Language (RDL),” and filed on Jan. 23, 2002.[00...

Claims


Application Information

Patent Timeline
Patent Type & Authority Patents(United States)
IPC IPC(8): G06F17/00G06F7/00G06F40/143
CPCG06F17/2247G06F40/143
Inventor DAVIS, RUSSELL T.
Owner E NUMERATE SOLUTIONS INC
Learn More