Data exploration system

a data exploration and data technology, applied in the field of systems and methods of analyzing and exploring data, can solve the problems of inability to handle complex data sets involving multiple data dimensions and/or multi-variable data presentations, limited in the complexity of data that can be manipulated, and inability to analyze, explore, and comprehend complex data sets. , to facilitate the visual comparison and comprehension of selected characteristics, enhance the user's ability to analyze, explore and comprehend

Inactive Publication Date: 2009-09-08
WALLACE JAMES H
View PDF6 Cites 22 Cited by
  • Summary
  • Abstract
  • Description
  • Claims
  • Application Information

AI Technical Summary

Benefits of technology

[0009]In accordance with the present invention, an improved data exploration system and method are provided that can be used to analyze and to explore complex data sets involving multiple data dimensions and multi-variable data presentations. The presently disclosed data exploration system and method enable a system user to generate multiple visual representations of the complex data sets, in which symbols are rendered and / or plotted based on the data underlying the various symbols, thereby facilitating the user's analysis and comprehension of information relationships within the data sets.
[0010]In one embodiment, the data exploration system is operative to generate visual representations of complex data sets in map, table, and tree view formats. In each of these view formats, both the appearance and the arrangement of the symbols representing the data sets are based on the data itself, thereby facilitating the comprehension of patterns and information relationships within the data sets. Further, the data can be viewed at different levels of density for performing detailed analysis of the data, and for detecting the presence of overall trends within the data. Moreover, the data exploration system is operative to perform a suite of calculation operations to cast the data in different forms, and to facilitate the acquisition, integration, and analysis of the data.
[0014]The symbols employed in the map visual data representation can also be plotted based on the data underlying the various symbols. For example, the positions of point symbols relative to a first axis within the map representation can be plotted based on at least a portion of the underlying data associated with each point symbol, and index numbers corresponding to the connection line symbols may be plotted along a second axis orthogonal to the first axis, thereby facilitating the visual comparison and comprehension of selected characteristics of the underlying data.
[0015]By enabling a user to generate multiple visual data representations in which symbols are rendered and / or plotted based on the data underlying the various symbols, the presently disclosed data exploration system significantly enhances the user's ability to analyze, explore, and comprehend information relationships within large quantities of data.

Problems solved by technology

Traditional spreadsheets and spreadsheet computer programs have drawbacks, however, in that they are limited in the complexity of the data that can be manipulated.
For example, spreadsheet computer programs typically operate on data stored in flat files, and are generally unable to handle complex data sets involving multiple data dimensions and / or multi-variable data presentations.
The graphical data representations that can be generated by traditional spreadsheet computer programs also suffer significant limitations.
Geographic information systems also have drawbacks, however, in that they are typically unsuited for use as a general data analysis tool.
Even if representative location references were derived for a set of data before providing the data to a GIS for analysis, the mapping of the data by the GIS would likely be constrained by the fixed nature of the data locations, thereby limiting the number of possible visual data representations that can be presented to a user, and in turn, limiting the user's ability to comprehend new information from the data relationships.

Method used


Image

  • Data exploration system
  • Data exploration system
  • Data exploration system

Examples


Embodiment Construction

[0021]U.S. Provisional Patent Application No. 60 / 545,150 filed Feb. 17, 2004 entitled DATA EXPLORATION SYSTEM is incorporated herein by reference.

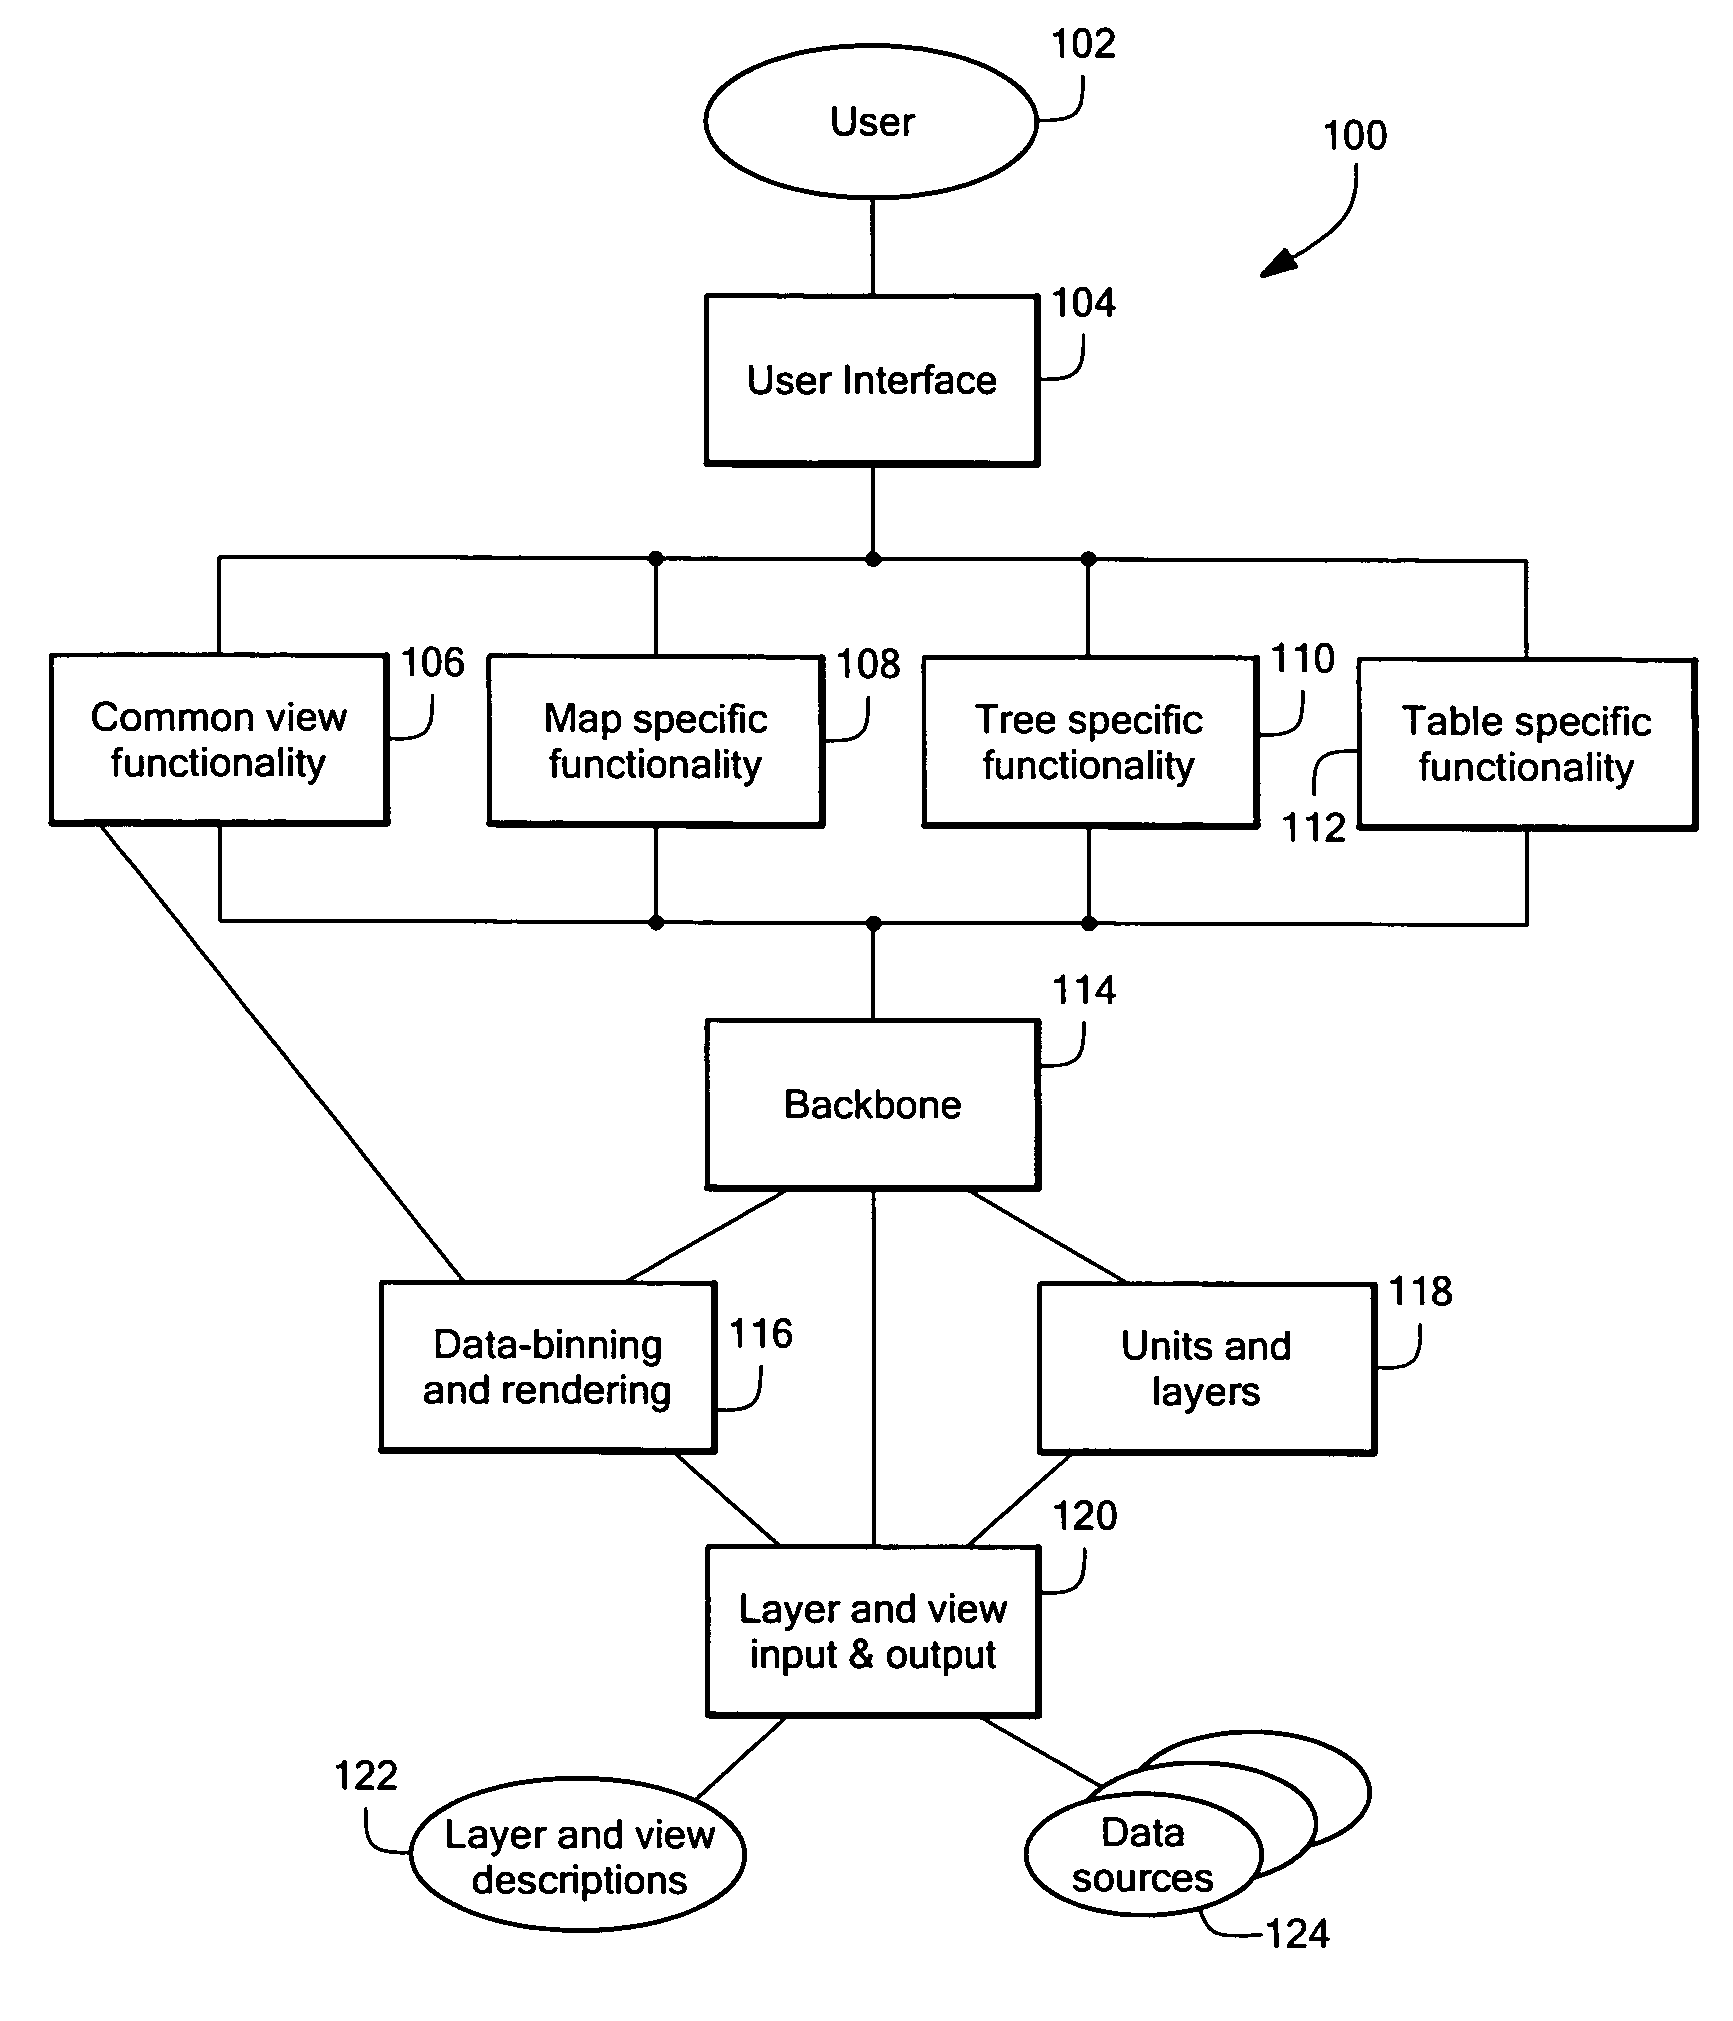
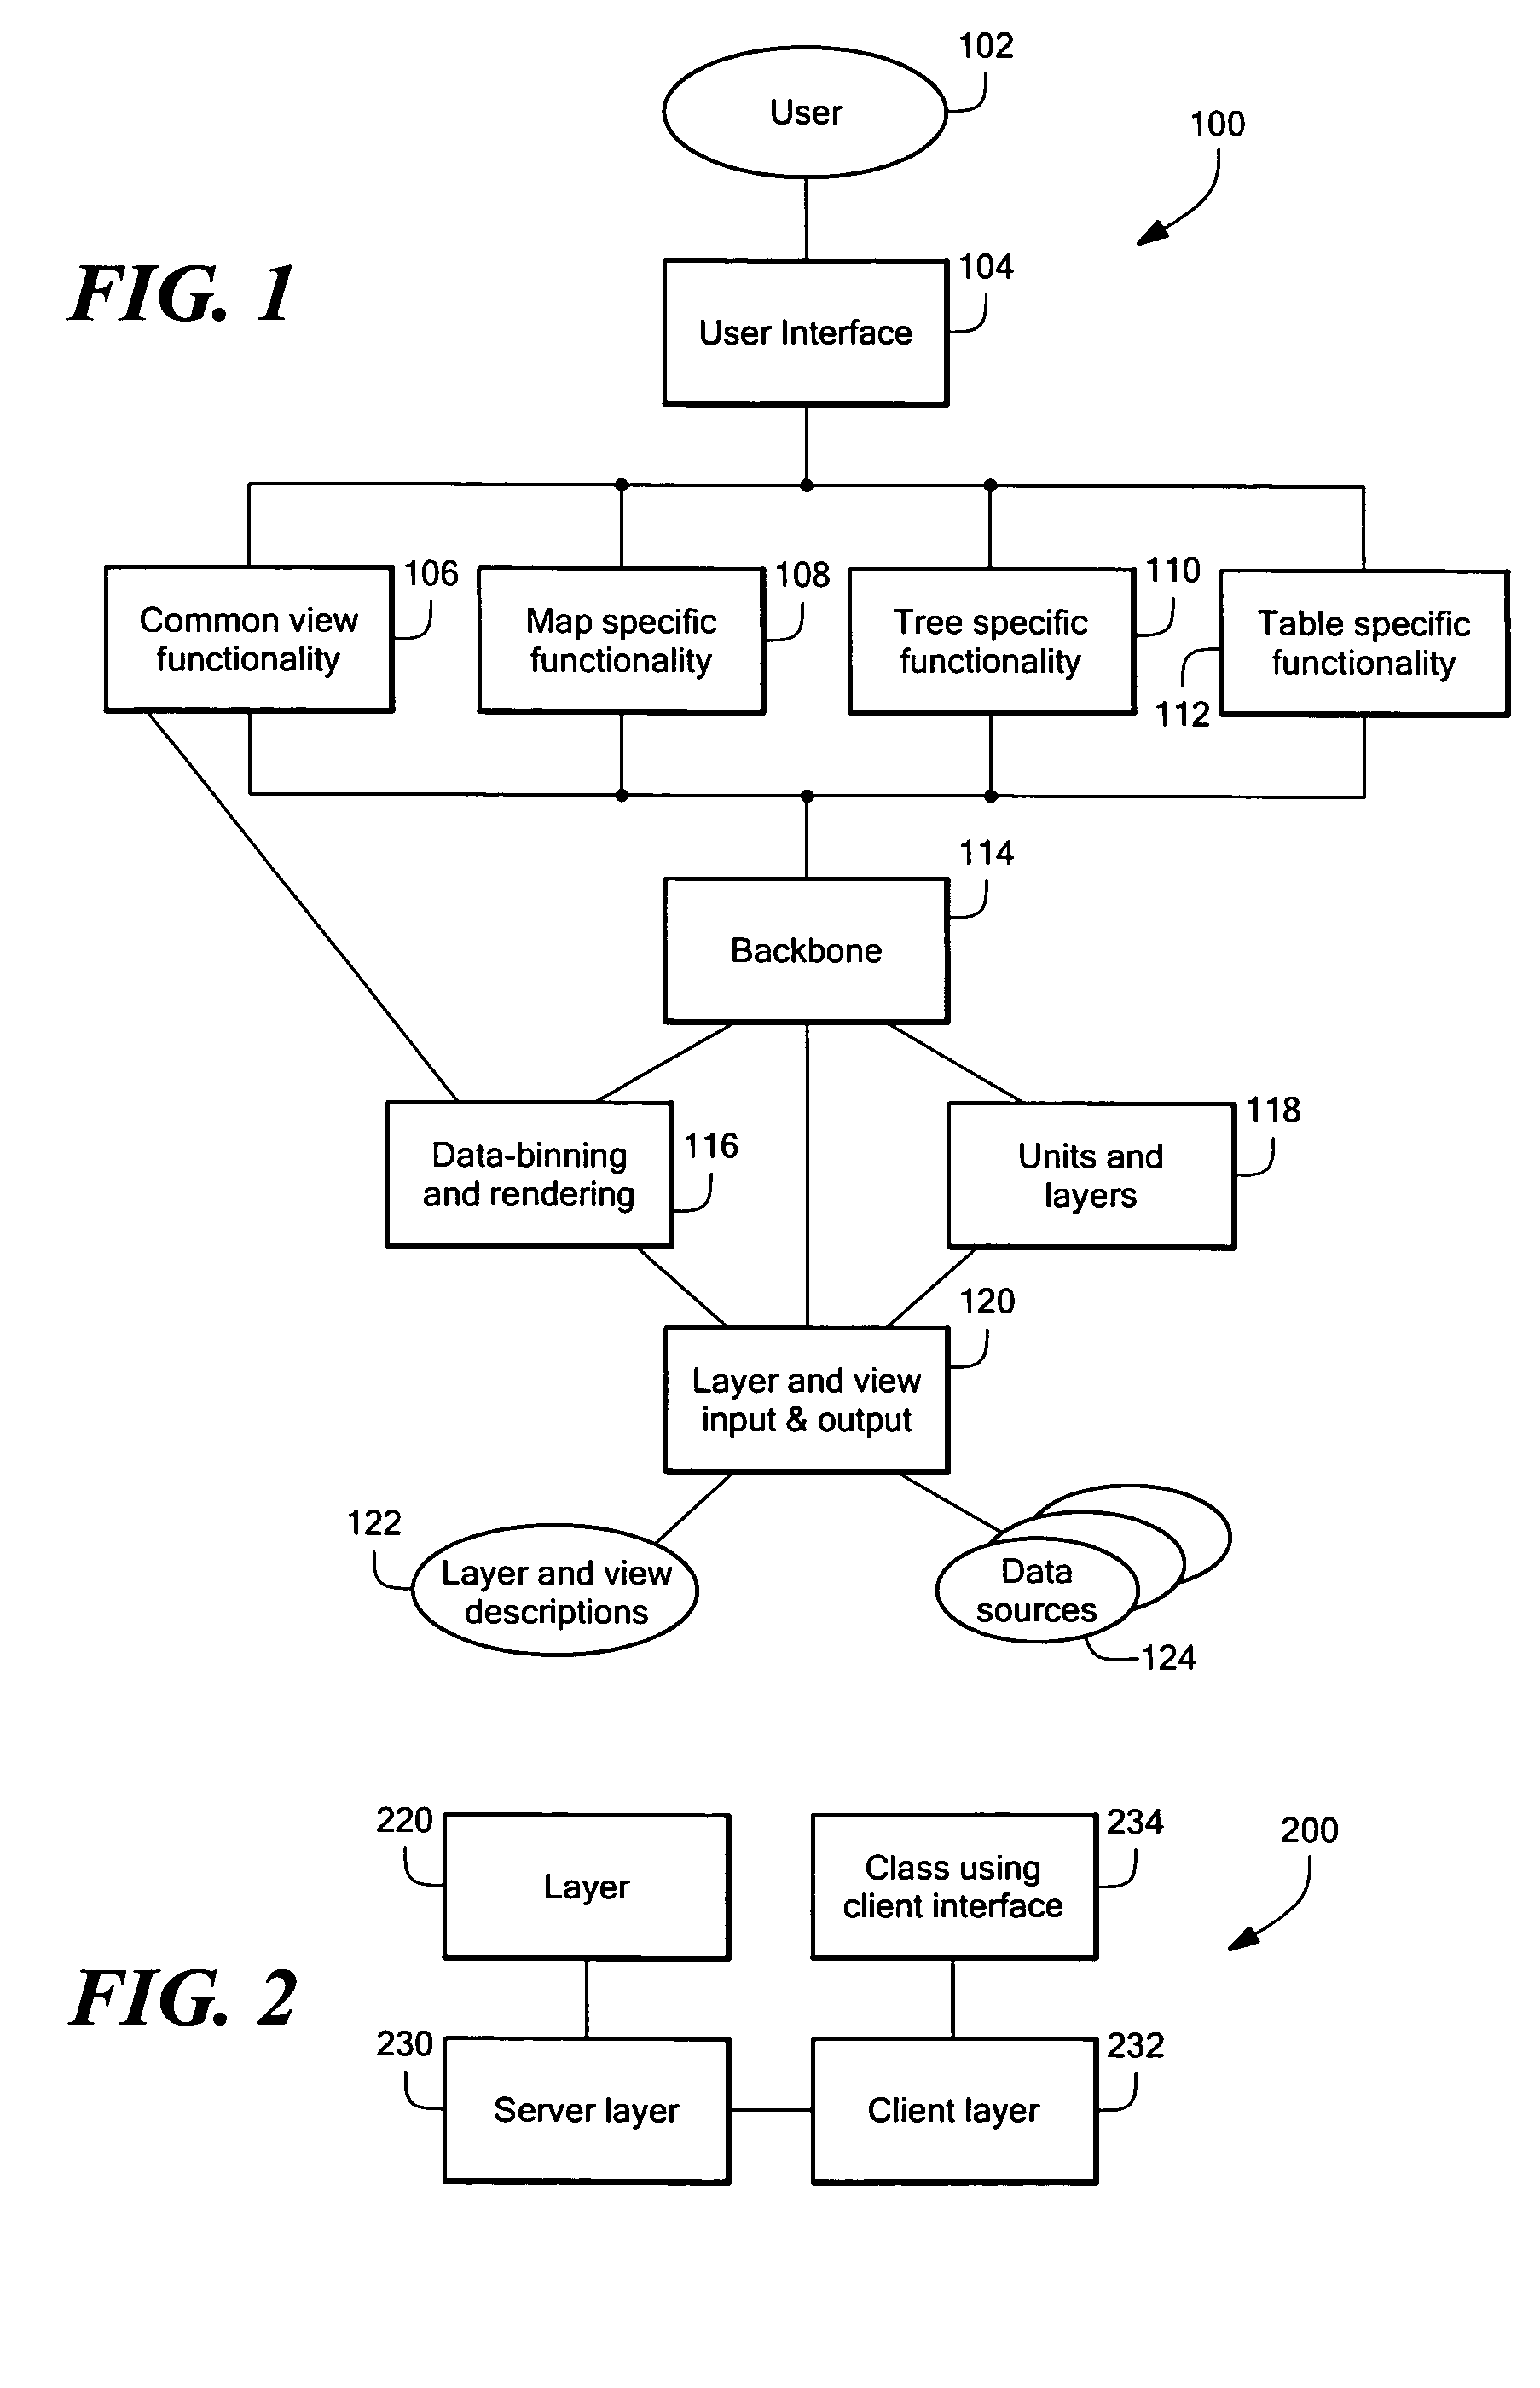
[0022]An improved data exploration system and method are disclosed that can be used to analyze and to explore complex data sets. In a preferred embodiment, the data exploration system and method are implemented on a computer system configurable to capture, to store, to analyze, to explore, and to display multiple visual representations of the complex data sets, in which symbols are rendered and / or plotted based on the data underlying the various symbols. In the preferred embodiment, the data exploration system includes a data storage system, at least one processor, and at least one output device such as a printer or a video monitor or display. The data storage system includes at least one memory configured with a data structure to maintain and to store complex data sets in multiple dimensions and involving multi-variable data presentations...


PUM


Abstract

An improved data exploration system and method that can be used to analyze and to explore complex data sets involving multiple data dimensions and multi-variable data presentations. The data exploration system generates visual representations of complex data sets in map, table, and tree view formats. In each of these view formats, both the appearance and the arrangement of the symbols representing the data sets are based on the data itself to facilitate the comprehension of patterns and information relationships within the data sets. Further, the data can be viewed at different levels of density to perform detailed analysis of the data, and to detect the presence of overall trends within the data. Moreover, the data exploration system performs a suite of calculation operations to cast the data in different forms, and to facilitate the acquisition, integration, and analysis of the data.

Description

CROSS REFERENCE TO RELATED APPLICATIONS[0001]This application claims priority of U.S. Provisional Patent Application No. 60 / 545,150 filed Feb. 17, 2004 entitled DATA EXPLORATION SYSTEM.STATEMENT REGARDING FEDERALLY SPONSORED RESEARCH OR DEVELOPMENT[0002]N / ABACKGROUND OF THE INVENTION[0003]The present application relates generally to systems and methods of analyzing and exploring data, and more specifically to an improved system and method of analyzing, exploring, and comprehending information relationships in data.[0004]In recent years, computer systems have enabled individuals and organizations to capture and store vast quantities of data. The existence of such large quantities of data has lead to an ever increasing need for improved systems and methods of analyzing and exploring data. For example, spreadsheets have traditionally been employed as a tool for interacting with and analyzing data. Spreadsheets typically organize data in rows and columns. When implemented as a computer ...

Claims


Application Information

Patent Timeline
Patent Type & Authority Patents(United States)
IPC IPC(8): G06F3/00G06F17/00G06F9/00G06T11/20G06T15/00G06T17/00
CPCG06T11/206
Inventor WALLACE, JAMES H.
Owner WALLACE JAMES H
Why Eureka
Try Eureka