Method and system for modeling and benchmarking private equity and applications of same

a technology of private equity and benchmarking, applied in the field of portfolio analysis, can solve the problems of not being able to directly compare the performance, the twr not yielding useful results for situations, and the difficulty of direct comparison between a private equity and other types of asset classes, and achieve the effect of accurate simulation of the behavior

Inactive Publication Date: 2010-04-13
CAPITAL DYNAMICS
View PDF0 Cites 20 Cited by
  • Summary
  • Abstract
  • Description
  • Claims
  • Application Information

AI Technical Summary

Benefits of technology

[0036]Advantageously, the ability to accurately simulate the behavior of a private equity under market conditions for which real private equity data is unavailable allows various risk profiles to be developed by statistically analyzing large numbers of simulation runs from, e.g., a Monte-Carlo simulator. In a particular application, the projected behavior of a private equity is analyzed to determine the likelihood that

Problems solved by technology

However, a direct comparison between a private equity and other types of asset classes is difficult.
TWR does not yield useful results for situations with multiple and varying cash in- and outflows.
While IRR of private equity normally yields useful absolute performance results, the results cannot be directly compared to the performance of public equities for the same time period, since the level of investments varies for private equities, but not for public equities.
For example, the period between 1999 and 2001 was characterized by large run-ups of most equity indexes, followed by a precipitous decline.
If there is a negative balance, the public market shows a lower performance.
However, while PME has received a good deal of academic publicity and has been used to a limited extent, PME has several drawbacks.
As a result, it has not been widely embraced by the financial industry as a day-to-day measure, particularly in the context of rating and modeling prospective private equity offerings.
One drawback is that when the private equity fund is not liquidated and the net asset value (“NAV”) is different from zero at the end of the time interval, PME still has some dependency on the NAV.
This assumption is questionable given the basic lack of liquidity of private equity.
A more significant issue is that PME does not always accurately reflect real-world results.
For example, when a private equity investment outperforms the public index on which the benchmark is based, the resulting hypothetical investment in the index tracking fund is likely to be negative.
At a minimum, this can skew a benchmarking process based on the PME and result in errors in a correlation analysis.
In a worst case, depending on the cash flow pattern, the negative balance can make it impossible to determine a discount rate that would bring the net present value of the benchmark investment to zero such that the IRR for the public fund would be undefined.
This shift from a long to a short position spoils the benchmarking process, resulting in non-sensible situations.
A further direct consequence of the short position is that a correlation analysis based on PME can give misleading results.
As a result, PME calculations, while useful for certain limited cases, can be unreliable in many situations, giving either incorrect results or be

Method used


Image

  • Method and system for modeling and benchmarking private equity and applications of same
  • Method and system for modeling and benchmarking private equity and applications of same
  • Method and system for modeling and benchmarking private equity and applications of same

Examples


example 1

Evaluation of a Private Equity Performance Relative to a Benchmark

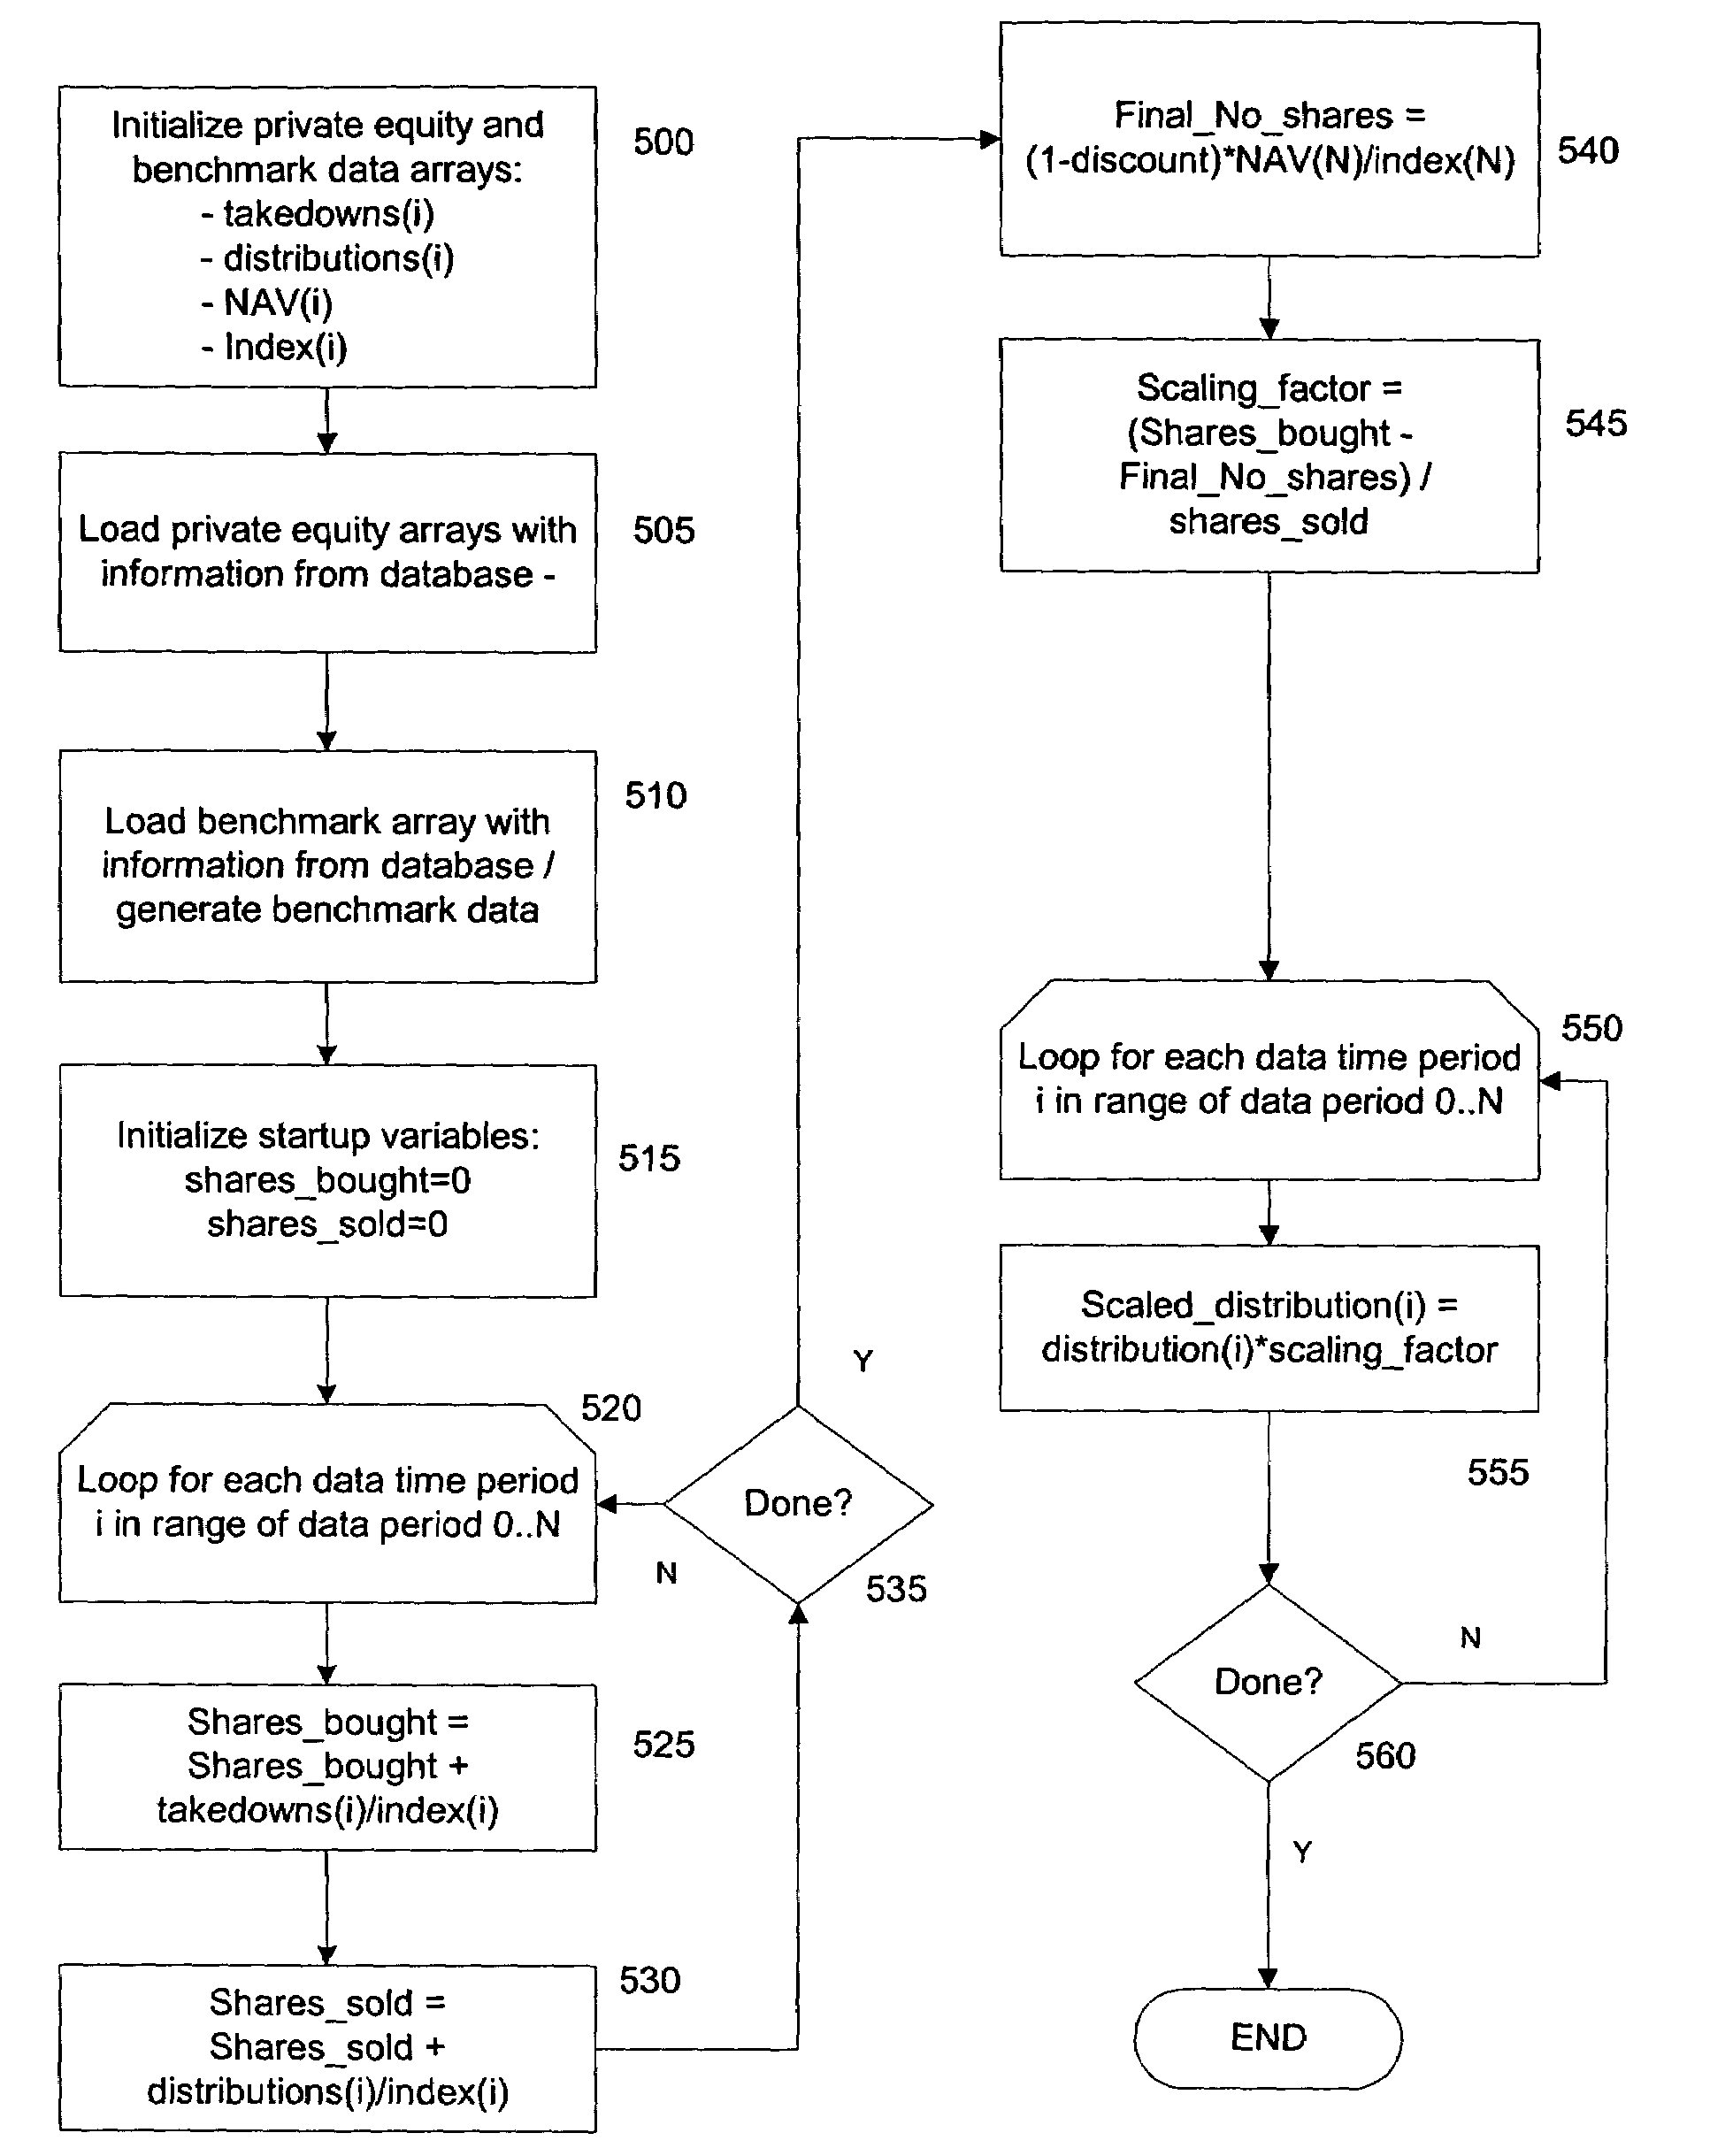
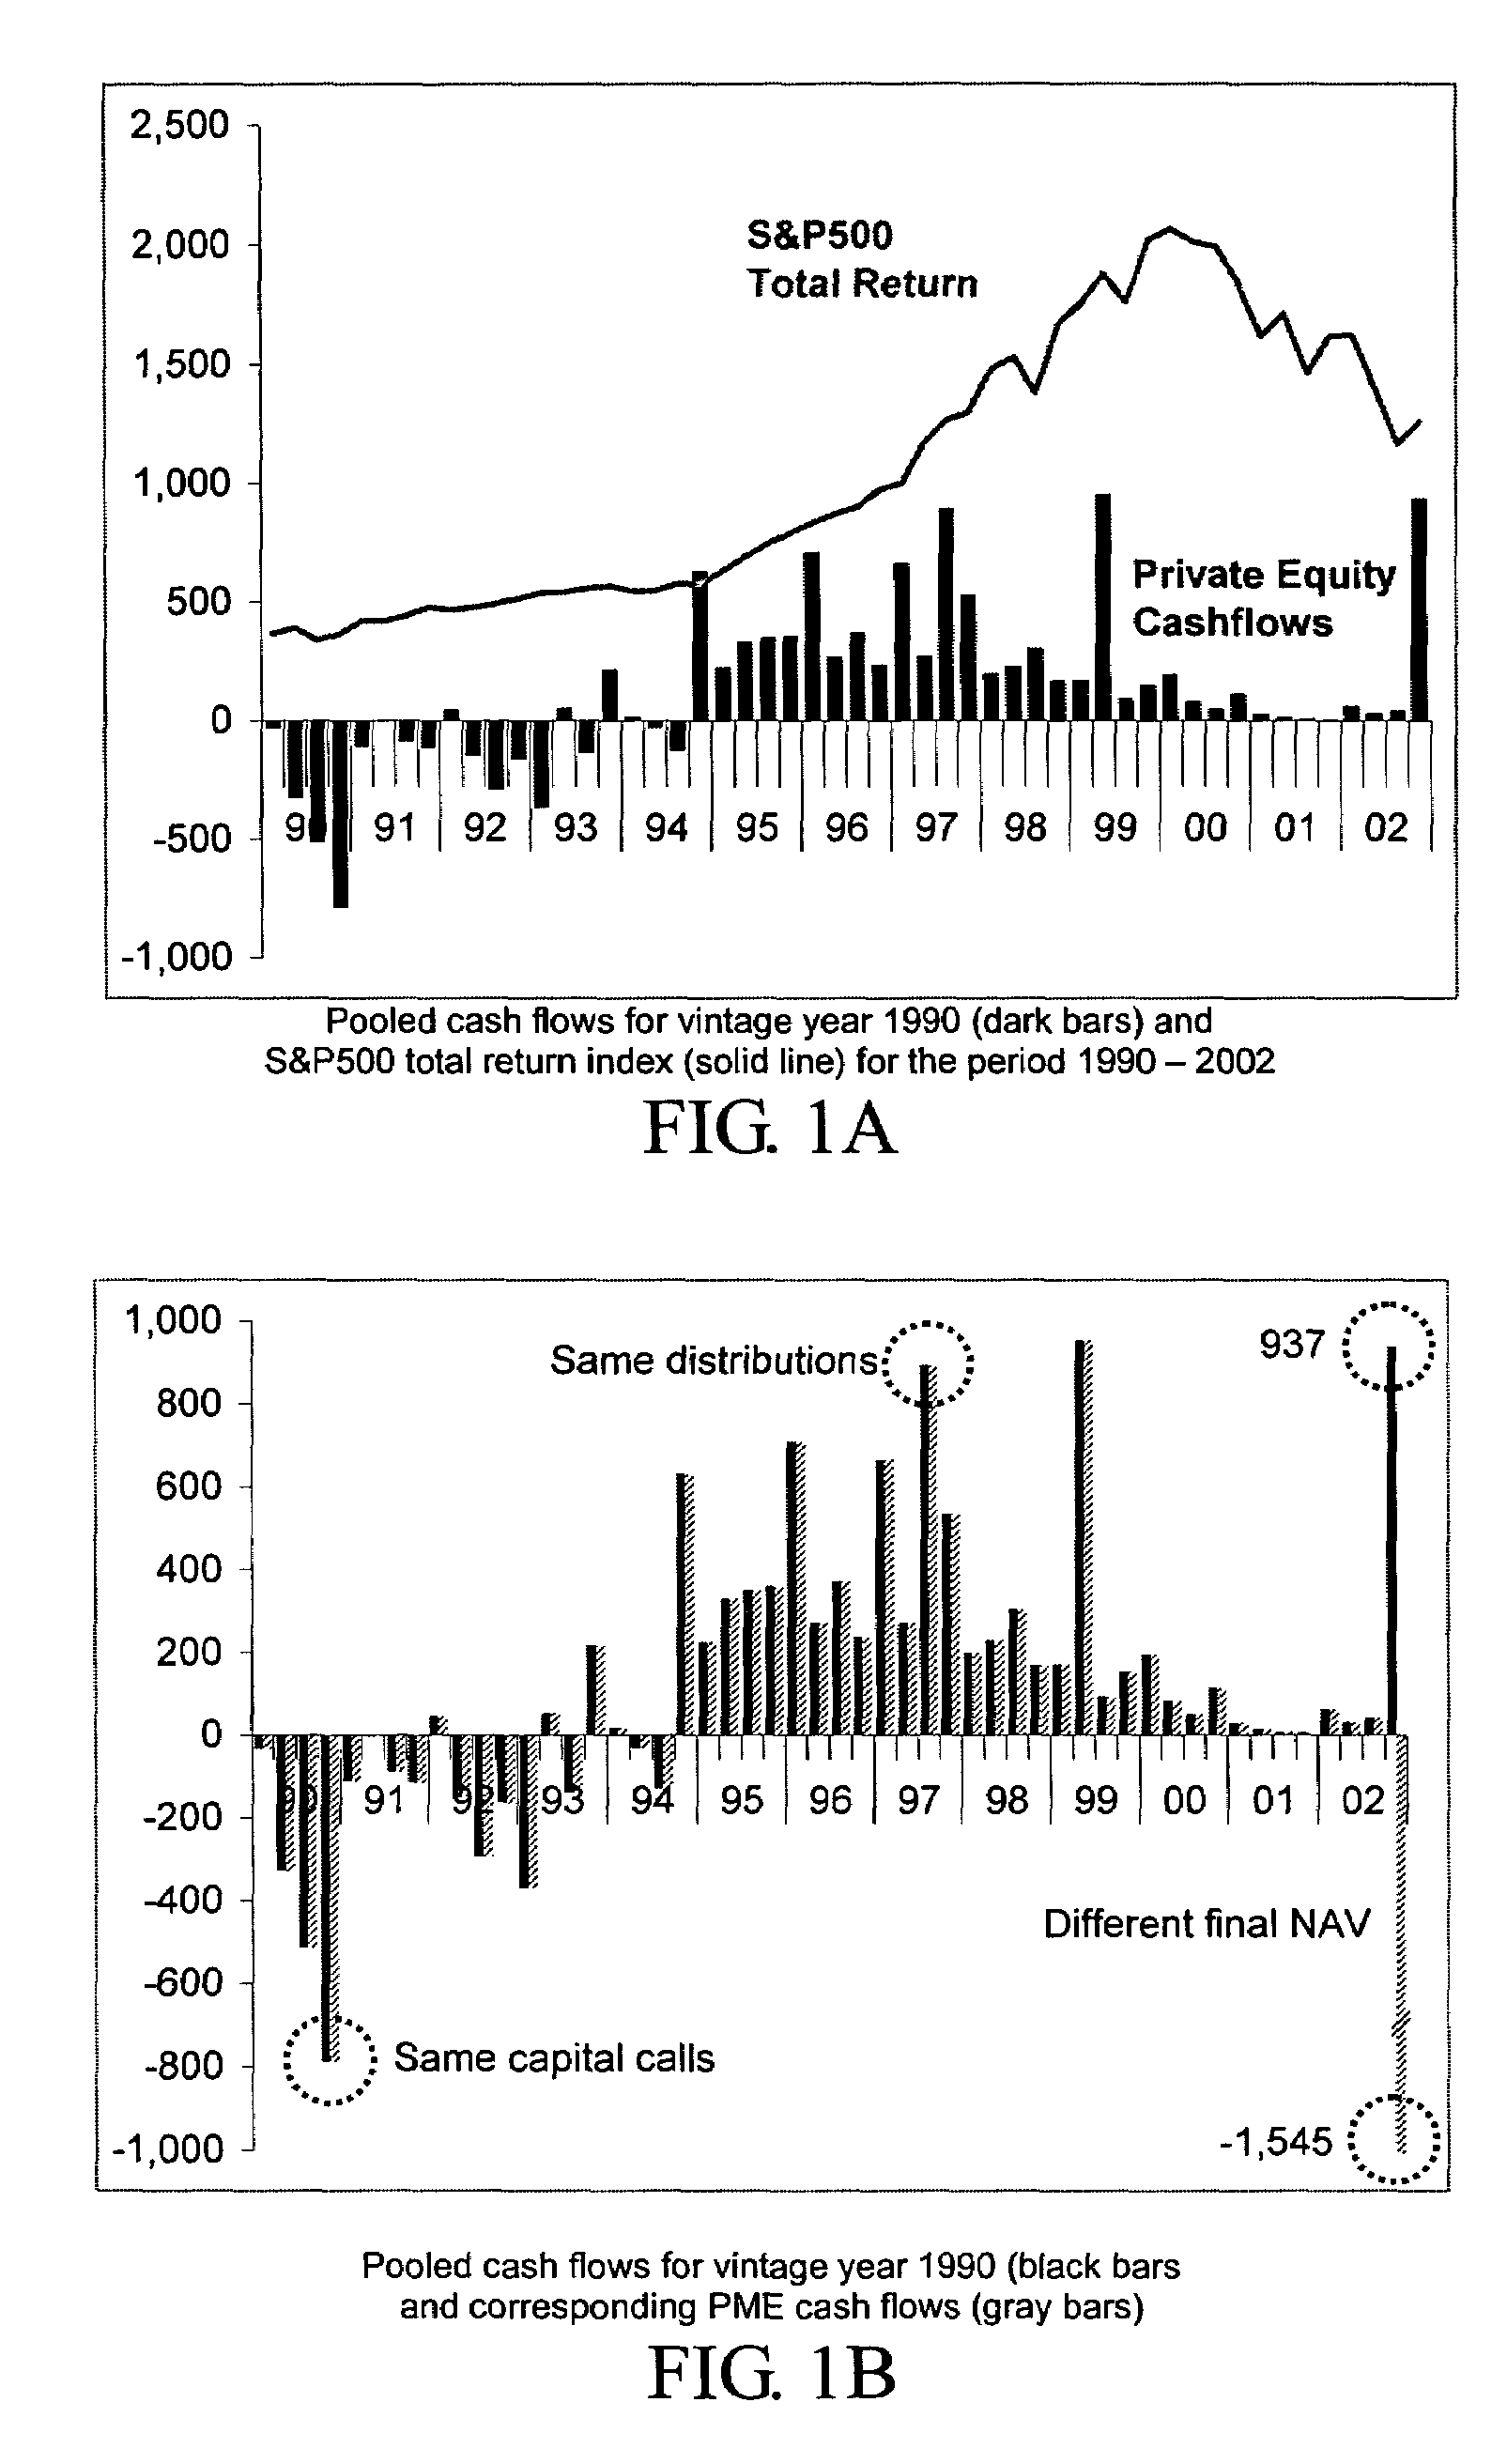
[0094]The cash flow for a private equity asset can be used to determine a scaling factor that can be used to compare performance of the asset with that of a benchmark. The cash flow can be from a single private equity asset or for multiple assets as appropriate, such as the cash flow for the entire asset class of a particular vintage year. For example, the cash flows from Jan. 1, 1990 to Dec. 31, 1999 can be applied to a benchmark fund valued on the S&P 500 Total Returns index. A scaling factor is selected so that the ending values of the private equity investment and the S&P500 total returns benchmark fund are the same. The magnitude of the scaling indicates how well the private equity asset performed relative to a fully diversified portfolio of public securities as represented by the S&P500.

[0095]With reference to FIG. 11A, there is shown a simplified set of index data and a corresponding set of private equity cash ...

example 2

Performance Comparison of Multiple Private Equities

[0098]The evaluation of a single private equity (or aggregate of private equities), as discussed above, can be performed separately for different private equities relative to the same index. The scaling factors determined for each private equity set can then be compared to each other. The difference between the scaling factors provides an indication of how well each of the equities performed relative to the pubic index and thereby how well they performed relative to each other. Advantageously, this allows the relative performance of the different private equities to be compared even if the timing of the cash flow events are different. This technique provides an alternative for the conventional technique of directly comparing IRRs of the private equities.

example 3

Generation of Scaled Private Equity Data for Use, e.g., During Analysis Under Market Conditions for which Private Equity Performance Data is not Available

[0099]Private equity performance data representing individual or pooled cash flows can be scaled to allow mapping of the data to a stream of public equity performance data, as represented by an index, for which actual private equity performance data is not available. The known private equity cash flow is applied to the public equity performance data and the cash flow scaled so that the performance or other attribute of the private equity has the desired relationship to the benchmark. The relationship can be predefined, such as where private equity performance is assumed to equal public market performance, or the relationship can be determined by initial analysis, such as by performing a benchmark comparison of the performance of private equity relative to a benchmark for a period where data for both private equity cash flow and the...


PUM


Abstract

Methods and systems are presented which permit more accurate analysis of the performance of private equity assets relative to the performance of a public index and also permit the simulation of private equity asset behavior during time periods for which reliable data for actual private equity performance is not available. The methods systems permit more accurate evaluation of a private equity asset relative to a benchmark, performance comparison of multiple private equity assets, the generation of scaled private equity data for use during simulation or other analysis under market conditions for which reliable private equity performance data is not available, risk analysis, rating and risk monitoring of private equity assets or structured products that invest in private equity assets, and as part of a private equity asset management and portfolio allocation tool.

Description

CROSS REFERENCE TO RELATED APPLICATIONS[0001]This application claims priority under 35 U.S.C. Sec. 119 from U.S. Provisional Application No. 60 / 484,267 entitled “Method and System for Modeling and Benchmarking Private Equity and Applications of Same,” filed Jun. 30, 2003.FIELD OF THE INVENTION[0002]The present invention is related to portfolio analysis and, more specifically, to a method and system for modeling and benchmarking the performance of an asset that has an irregular cash flow, such as a private equity asset or liability.BACKGROUND[0003]There is a need to benchmark the performance of private equities and other assets and liabilities that have irregular cash flows and also to determine how such an asset or liability would perform under various market scenarios for which actual performance data for the private equity is not available.[0004]A private equity investment has an irregular cash flow. This cash flow comprises draw downs, in which funds are invested into the asset, ...

Claims


Application Information

Patent Timeline
IPC IPC(8): G06Q40/00
CPCG06Q30/02G06Q40/02G06Q40/08G06Q40/06G06Q40/04
Inventor ROUVINEZ, CHRISTOPHEKUBR, THOMAS
Owner CAPITAL DYNAMICS
Why Eureka
Try Eureka