Baseline comparative leading indicator analysis

a leading indicator and comparative technology, applied in the field of prediction of events, can solve the problems of difficult to make much sense for decision-makers, data does not lend itself to display via standard plotting techniques, etc., and achieve the effect of better leading indicator display methods

Inactive Publication Date: 2010-09-14
NAVY UNITED STATES OF AMERICA SEC OF THE
View PDF29 Cites 5 Cited by
  • Summary
  • Abstract
  • Description
  • Claims
  • Application Information

AI Technical Summary

Benefits of technology

[0014]In view of the foregoing, an object of the present invention is to provide a better leading indicator analysis methodology. A further object of the present invention is to provide a better leadi

Problems solved by technology

Often the resultant data do not lend themselves to display via standard techniques of plotting or data visualization.
The kind of information genera

Method used


Image

  • Baseline comparative leading indicator analysis
  • Baseline comparative leading indicator analysis
  • Baseline comparative leading indicator analysis

Examples


example 1

Engine Vibration

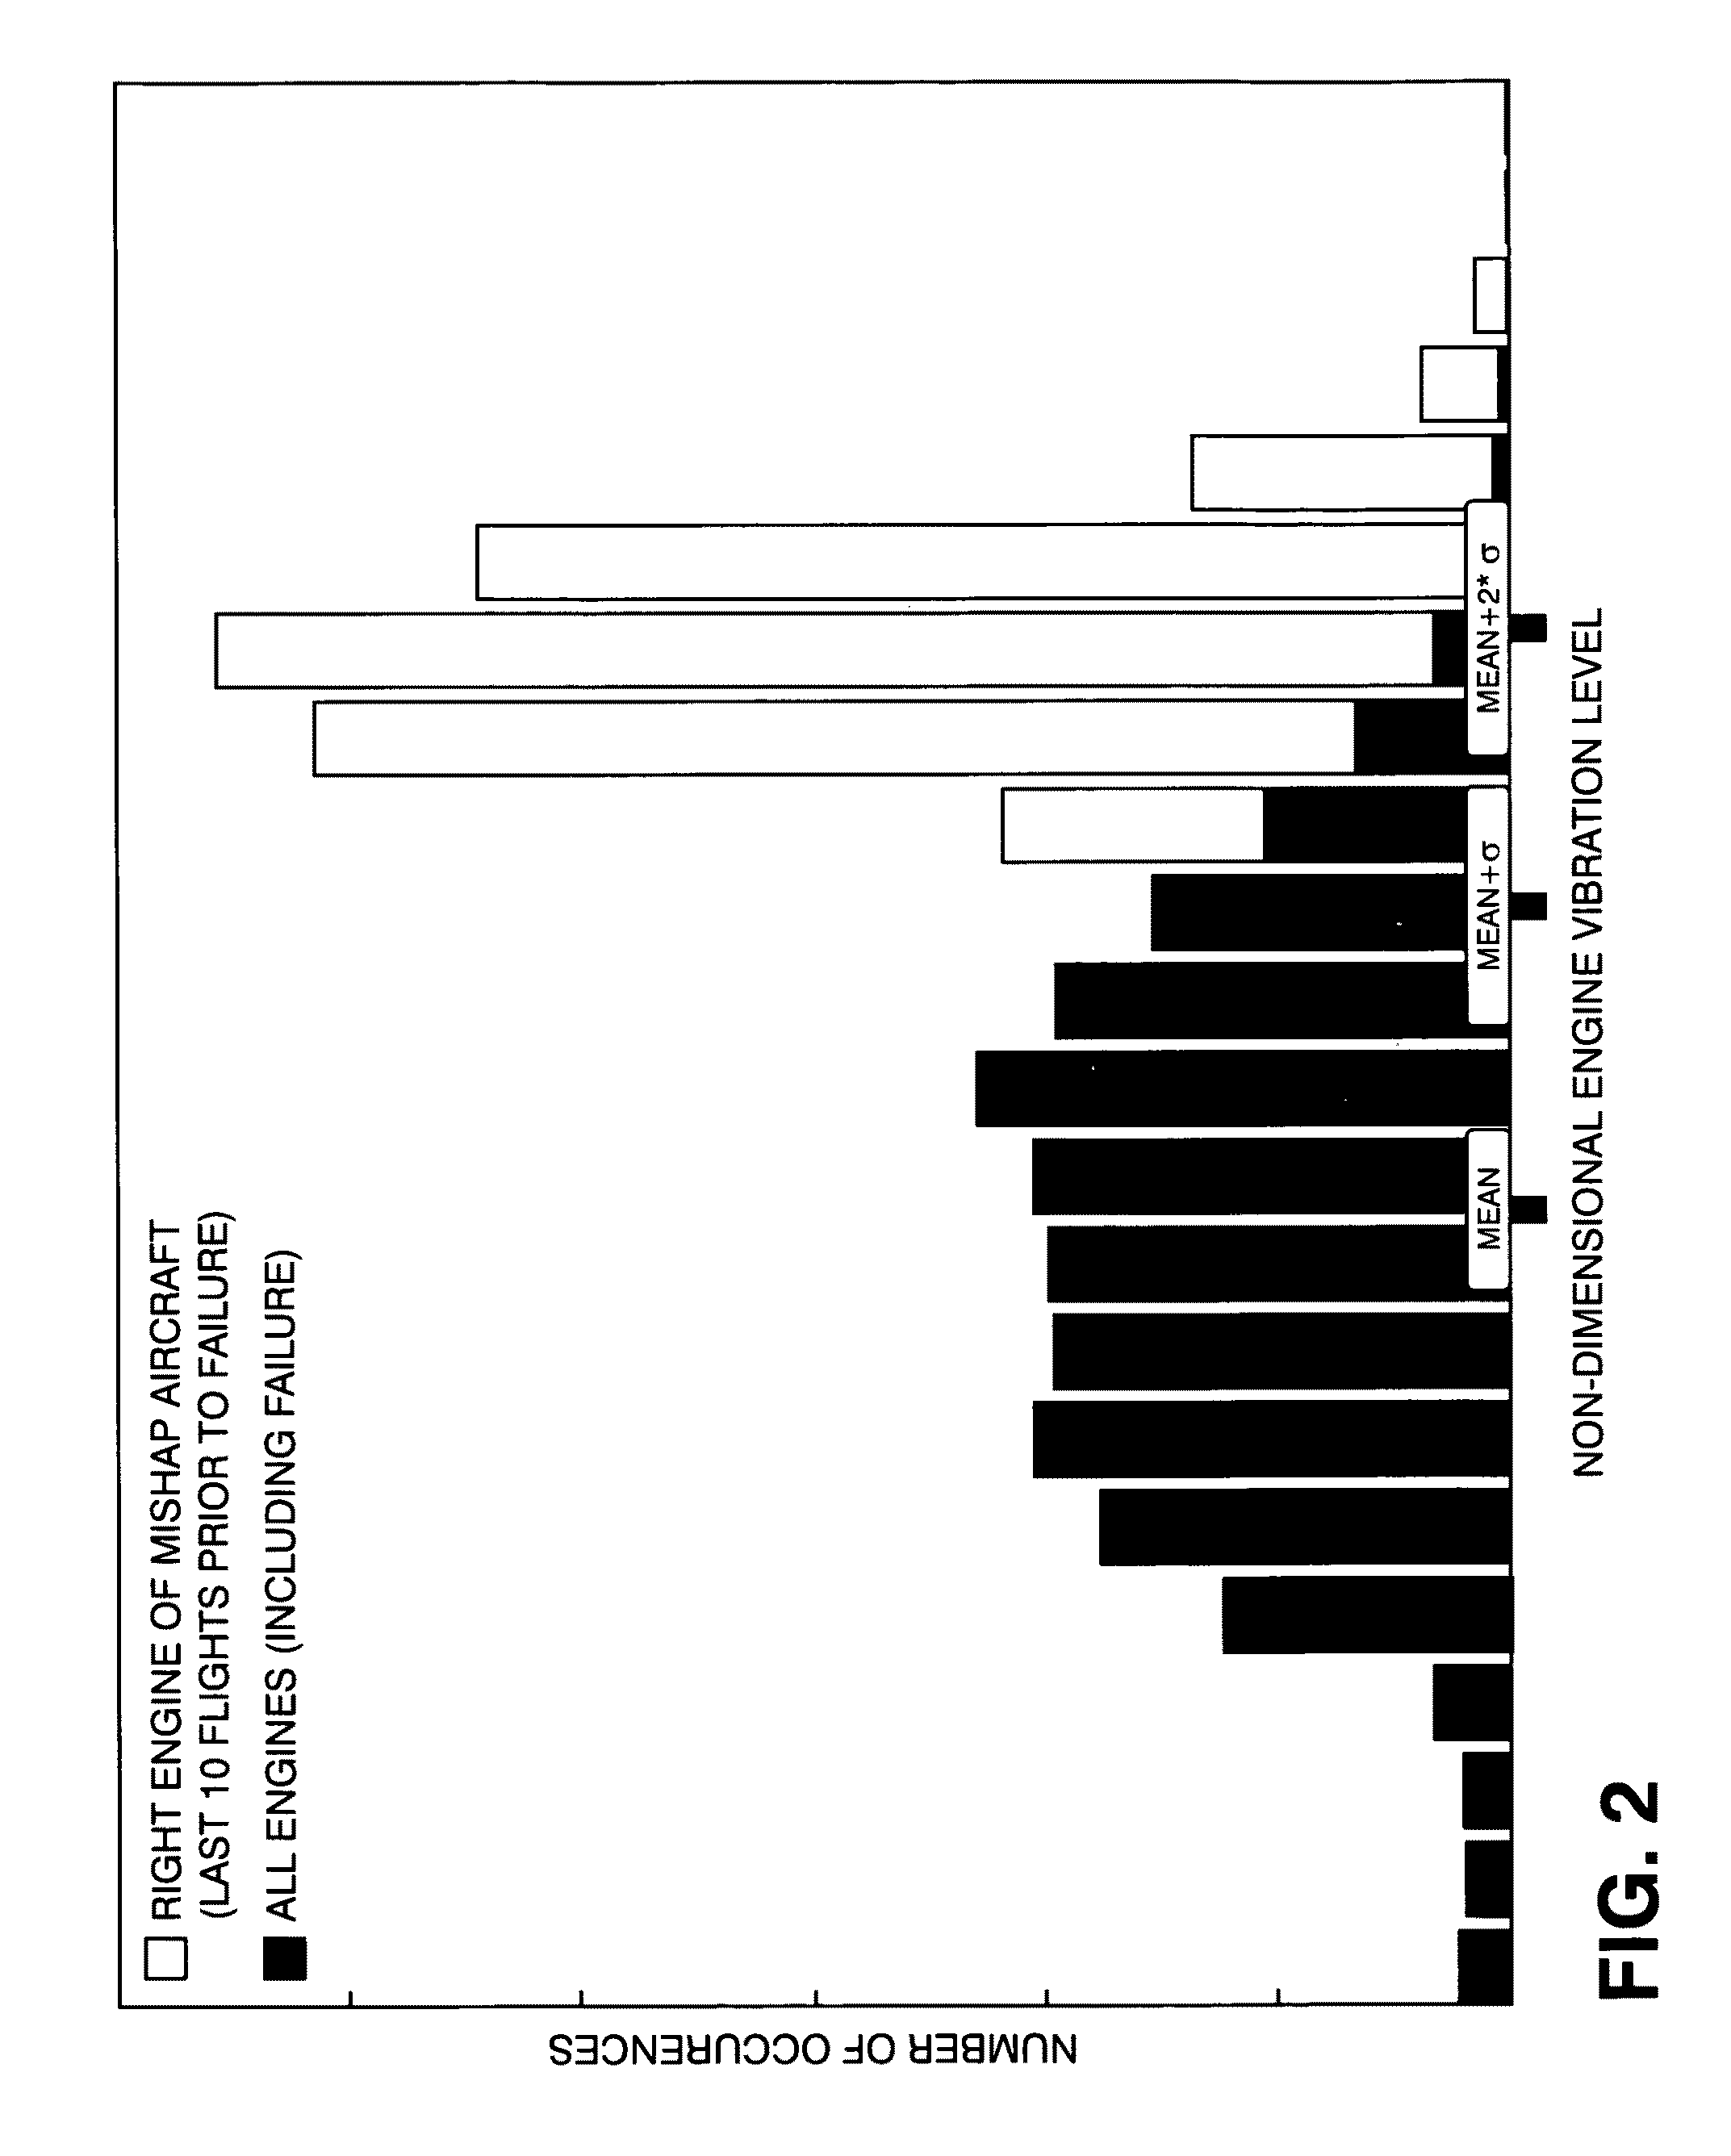
[0049]A manufacturing defect in a specific lot of aircraft engines caused a number of catastrophic failures. This in turn caused significant damage to multiple aircraft. The question was raised as to whether or not existed, prior to failure, any leading indicators of failure or abnormal operation. The type of aircraft involved has a robust onboard data collection system with ample data for conducting comparative analyses in accordance with the present invention's BCLI analystical methodology. With a view toward identifying anomalous behavior, vibration data from the engine that failed was compared to engine vibration data from roughly 4,000 flights of other aircraft with similar engines. The 4,000 flights constituted the baseline for this inventive BCLI analysis.

[0050]With reference to FIG. 2, the distribution of the vibration data (referred to herein as the “vibration signature”) from the known failed engine is compared with the vibration signature of the baseline. ...

example 2

Approach and Landing

[0053]Pilot performance and proficiency are currently evaluated by instructor pilots (“IP”s), skilled aviators who greatly influence pilots in training. During a training phase, an IP will sometimes not be present in the cockpit with the student, thereby relying on the student's sensibilities for the student's self-evaluation. In addition, some subjectivity in grading criteria among different IPs is unavoidable.

[0054]The present invention's BCLI analytical methodology can represent an automated approach to evaluating pilot performance. The inventive BCLI analysis of flight data should not replace IP expert evaluation, but rather should supplement it by providing more objective measurement of pilot performance for various criteria in a training and evaluation environment.

[0055]“Approach-to-landing” (approach and landing) is a critical and rather well-defined phase of flight, and was selected as a test maneuver for inventive evaluation. With reference to FIG. 3 thr...

example 3

Approach and Landing (Alternative Display)

[0071]Reference is still made to FIG. 4 and FIG. 10 and is also made to FIG. 16. FIG. 16 is similar to FIG. 4 and FIG. 10 insofar as illustrating presentation of information by inventive ILID methodology using color-coded horizontal bars and contrasting sliders. In FIG. 4, FIG. 10 and FIG. 16, each color-coded bar represents a baseline, each bar is sectioned into differently colored bands, and each contrasting slider (indicated as slider S) represents a single event of interest. FIG. 4, FIG. 10 and FIG. 16 alike demonstrate how inventive BCLI analysis can involve multiple analyses. More generally, this multi-analytical genre of inventive BCLI practice is distinguishable from the uni-analytical genre of inventive BCLI practice, such as illustrated by FIG. 2. The latter is less complex, for instance based on a single parameter or criterion such as engine vibration; the former is more complex, for instance based on multiple parameters or criter...


PUM


Abstract

According to typical inventive practice, a baseline describing a statistical distribution is established for a set of historical occurrences of an event. Comparison is made between the baseline and at least one current occurrence of the same event. Any current occurrence that is anomalous vis-à-vis the baseline is considered a possible leading indicator. According to some inventive embodiments of graphical presentation of such comparison, at least one graphical baseline comparative display component is rendered that includes a “bar” (describing a historical statistical distribution with respect to a criterion pertaining to occurrence of an event) and a “slider” (describing one or more current occurrences of the event). The bar includes at least one band representing a statistical mean range, and at least one band representing a statistical outlier range. Situation of the slider along the bar indicates whether and to what extent the current occurrence(s) is/are anomalous vis-à-vis the baseline.

Description

STATEMENT OF GOVERNMENT INTEREST[0001]The invention described herein may be manufactured and used by or for the Government of the United States of America for governmental purposes without payment of any royalties thereon or therefor.CROSS-REFERENCE TO RELATED APPLICATIONS[0002]This application is related to U.S. nonprovisional patent application Ser. No. 12 / 006,753, filing date 20 Dec. 2007, incorporated herein by reference, invention title “Intelligent Leading Indicator Display,” joint inventors Eric J. Silberg, Phong Hua Nguyen, Daniel P. Everson, and Naipei P. Bi.BACKGROUND OF THE INVENTION[0003]The present invention relates to prediction of events, more particularly to predictive and informative methods that involve leading indicator analysis.[0004]Leading Indicator (LI) analysis is a methodology of predicting future events based on past performance. It involves a measurement or combination of measurements that, when properly analyzed, can provide a prediction of a potential fu...

Claims


Application Information

Patent Timeline
IPC IPC(8): G06F17/18
CPCG06F17/18G06Q10/04
Inventor SILBERG, ERIC J.NGUYEN, PHONG HUAEVERSON, DANIEL P.BI, NAIPEI P.
Owner NAVY UNITED STATES OF AMERICA SEC OF THE
Why Eureka
Try Eureka