
System, method, and computer program product for forecasting weather-based demand using proxy data

Inactive Publication Date: 2010-11-30
PANALEC
View PDF155 Cites 14 Cited by
  • Summary
  • Abstract
  • Description
  • Claims
  • Application Information

AI Technical Summary

Benefits of technology

[0041]The above-identified nine limitations of conventional solutions to weather planning problems in retail were met by such systems, methods and computer program products disclosed in commonly-assigned U.S. Pat. Nos. 5,521,813; 5,491,629; 5,796,932; and 5,832,456; and commonly-assigned U.S. application Ser. Nos. 09

Problems solved by technology

Another result was a shifting of supply sources.
The period from 1975 to 1980 was marked by disillusionment and complexity in the retail industry.
With their increased size, retailers became increasingly unable to manage and analyze the information flowing into their organizations.
External factors impacting the retail industry include, for example, adverse or favorable weather, rising labor costs, increasing property costs, increased competition, economics, increasing cost of capital, increasing consumer awareness, increasing distribution costs, changing demographics and zero population growth, decreasing labor pool, and flat to diminishing per capita income.
The above external and industry factors have added to a retailer's burdens of maintaining the productivity of these assets.
However, the use of mainframes typically requires the expense of a large MIS department to process data requests.
There is also an inherent delay from the time of a data request to the time of the actual execution.
This structure prevented MIS systems from becoming cost effective for use by executives in making daily decisions, who are typically not computer specialists and thus rely on data requests to MIS specialists.
However, these events are less frequent than regional or local aberrations.
Because actual daily occurrences fluctuate around the long term “normal” or “average” trend line (in meteorology, normal is typically based on a 30 year average), past historical averages can be a very poor predictor of future weather on a given day and time at any specific location.
Since the impact of local weather anomalies can be diluted when aggregated to the national levels (sharp local sales fluctuations due to weather tend to average out when aggregated into national numbers), the impact of weather has not received much scrutiny relative to national planning and forecasting.
Weather also influences store traffic which, in turn, often impacts sales of all goods.
Weather can influence the timing and intensity of markdowns, and can create stockout situations which replenishment cycles can not address due to the inherent time lag of many replenishment approaches.
The combination of lost sales due to stockouts and markdowns required to move slow inventory are enormous hidden costs, both in terms of lost income and opportunity costs.
The cash and opportunity costs in the aggregate are enormous.
Though the majority of retailers acknowledge the effects of weather, many do not consider weather as a problem per se, considering it as a completely uncontrollable part of the external environment.
However, the underlying problem is essentially one of prediction of the future; i.e., developing a predictive model.
Hence, many conventional predictive modeling processes have been developed, none of which adequately address the impact of weather.
This approach creates large working capital needs to support such a large inventory.
This procedure, if used by decision makers, is very subjective and does not evaluate weather in a predictive sense.
Nor does it quantify the effect of past and future weather on consumer demands.
This approach does not utilize forecasted weather as a parameter, which can vary considerably from any given time period from year to year for a given area.
This information cannot be quantified or easily integrated into an MIS-based planning system which is geared toward a daily or weekly time increment for specific location and time.
In summary, the above conventional solutions to weather planning problems in retail all suffer from one or several deficiencies which severely limit their commercial value, by not providing: (1) regional and / or local specificity in measuring past weather impact and projecting future weather impact, (2) the daily, weekly, and monthly increment of planning and forecasting required in the retail industry, (3) ample forecast leadtime required by such planning applications as buying, advertising, promotion, distribution, financial budgeting, labor scheduling, and store traffic analysis, (4) the quantification of weather impact required for precise planning applications such as unit buying and unit distribution, financial budget forecasting, and labor scheduling, (5) reliability beyond a three to five day leadtime, (6) a predictive weather impact model, which links quantitative weather impact measurement through historical correlation, with quantitative forecasts, (7) the ability to remove historical weather effects from past retail sales for use as a baseline in sales forecasting, (8) an entirely electronic, computerized, EIS implementation for ease of data retrieval / analysis with specific functions that solve specific managerial planning applications, and (9) a graphical user interface representing a predictive model in graphs, formats, and charts immediately useful to the specific managerial applications.
Weather impacts many aspects of human endeavor.

Method used


Image

  • System, method, and computer program product for forecasting weather-based demand using proxy data
  • System, method, and computer program product for forecasting weather-based demand using proxy data
  • System, method, and computer program product for forecasting weather-based demand using proxy data

Examples


first embodiment

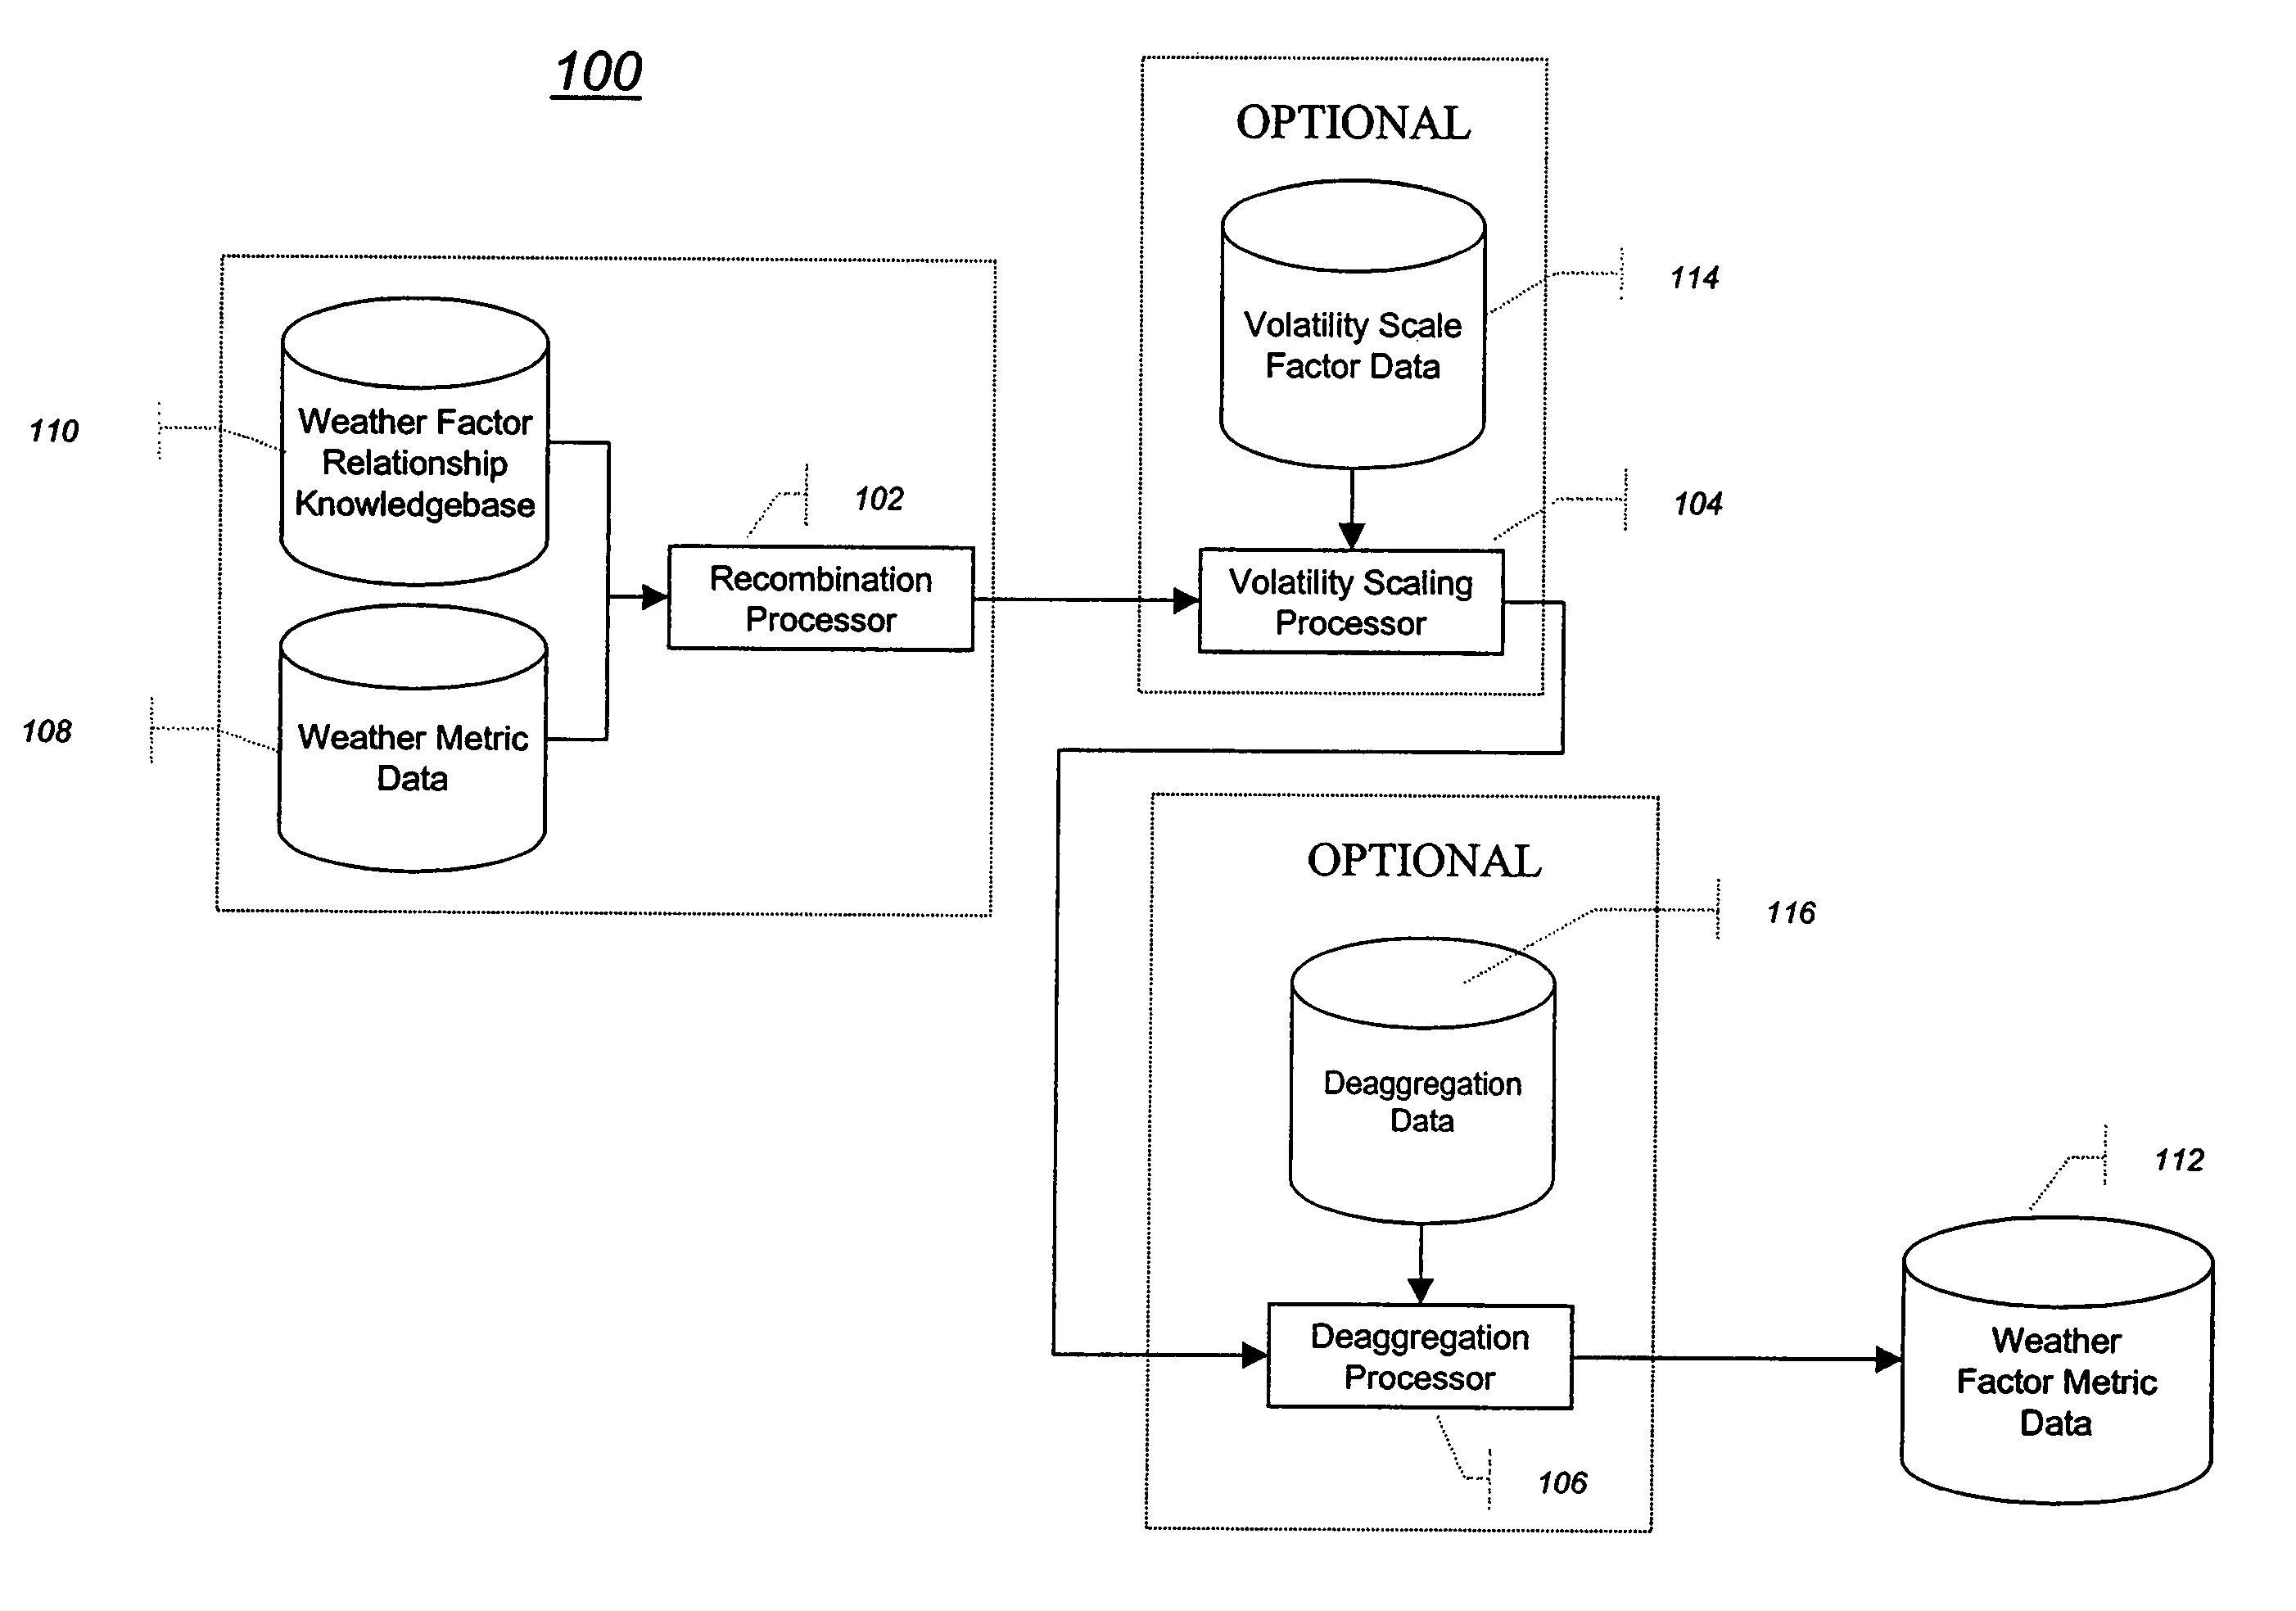
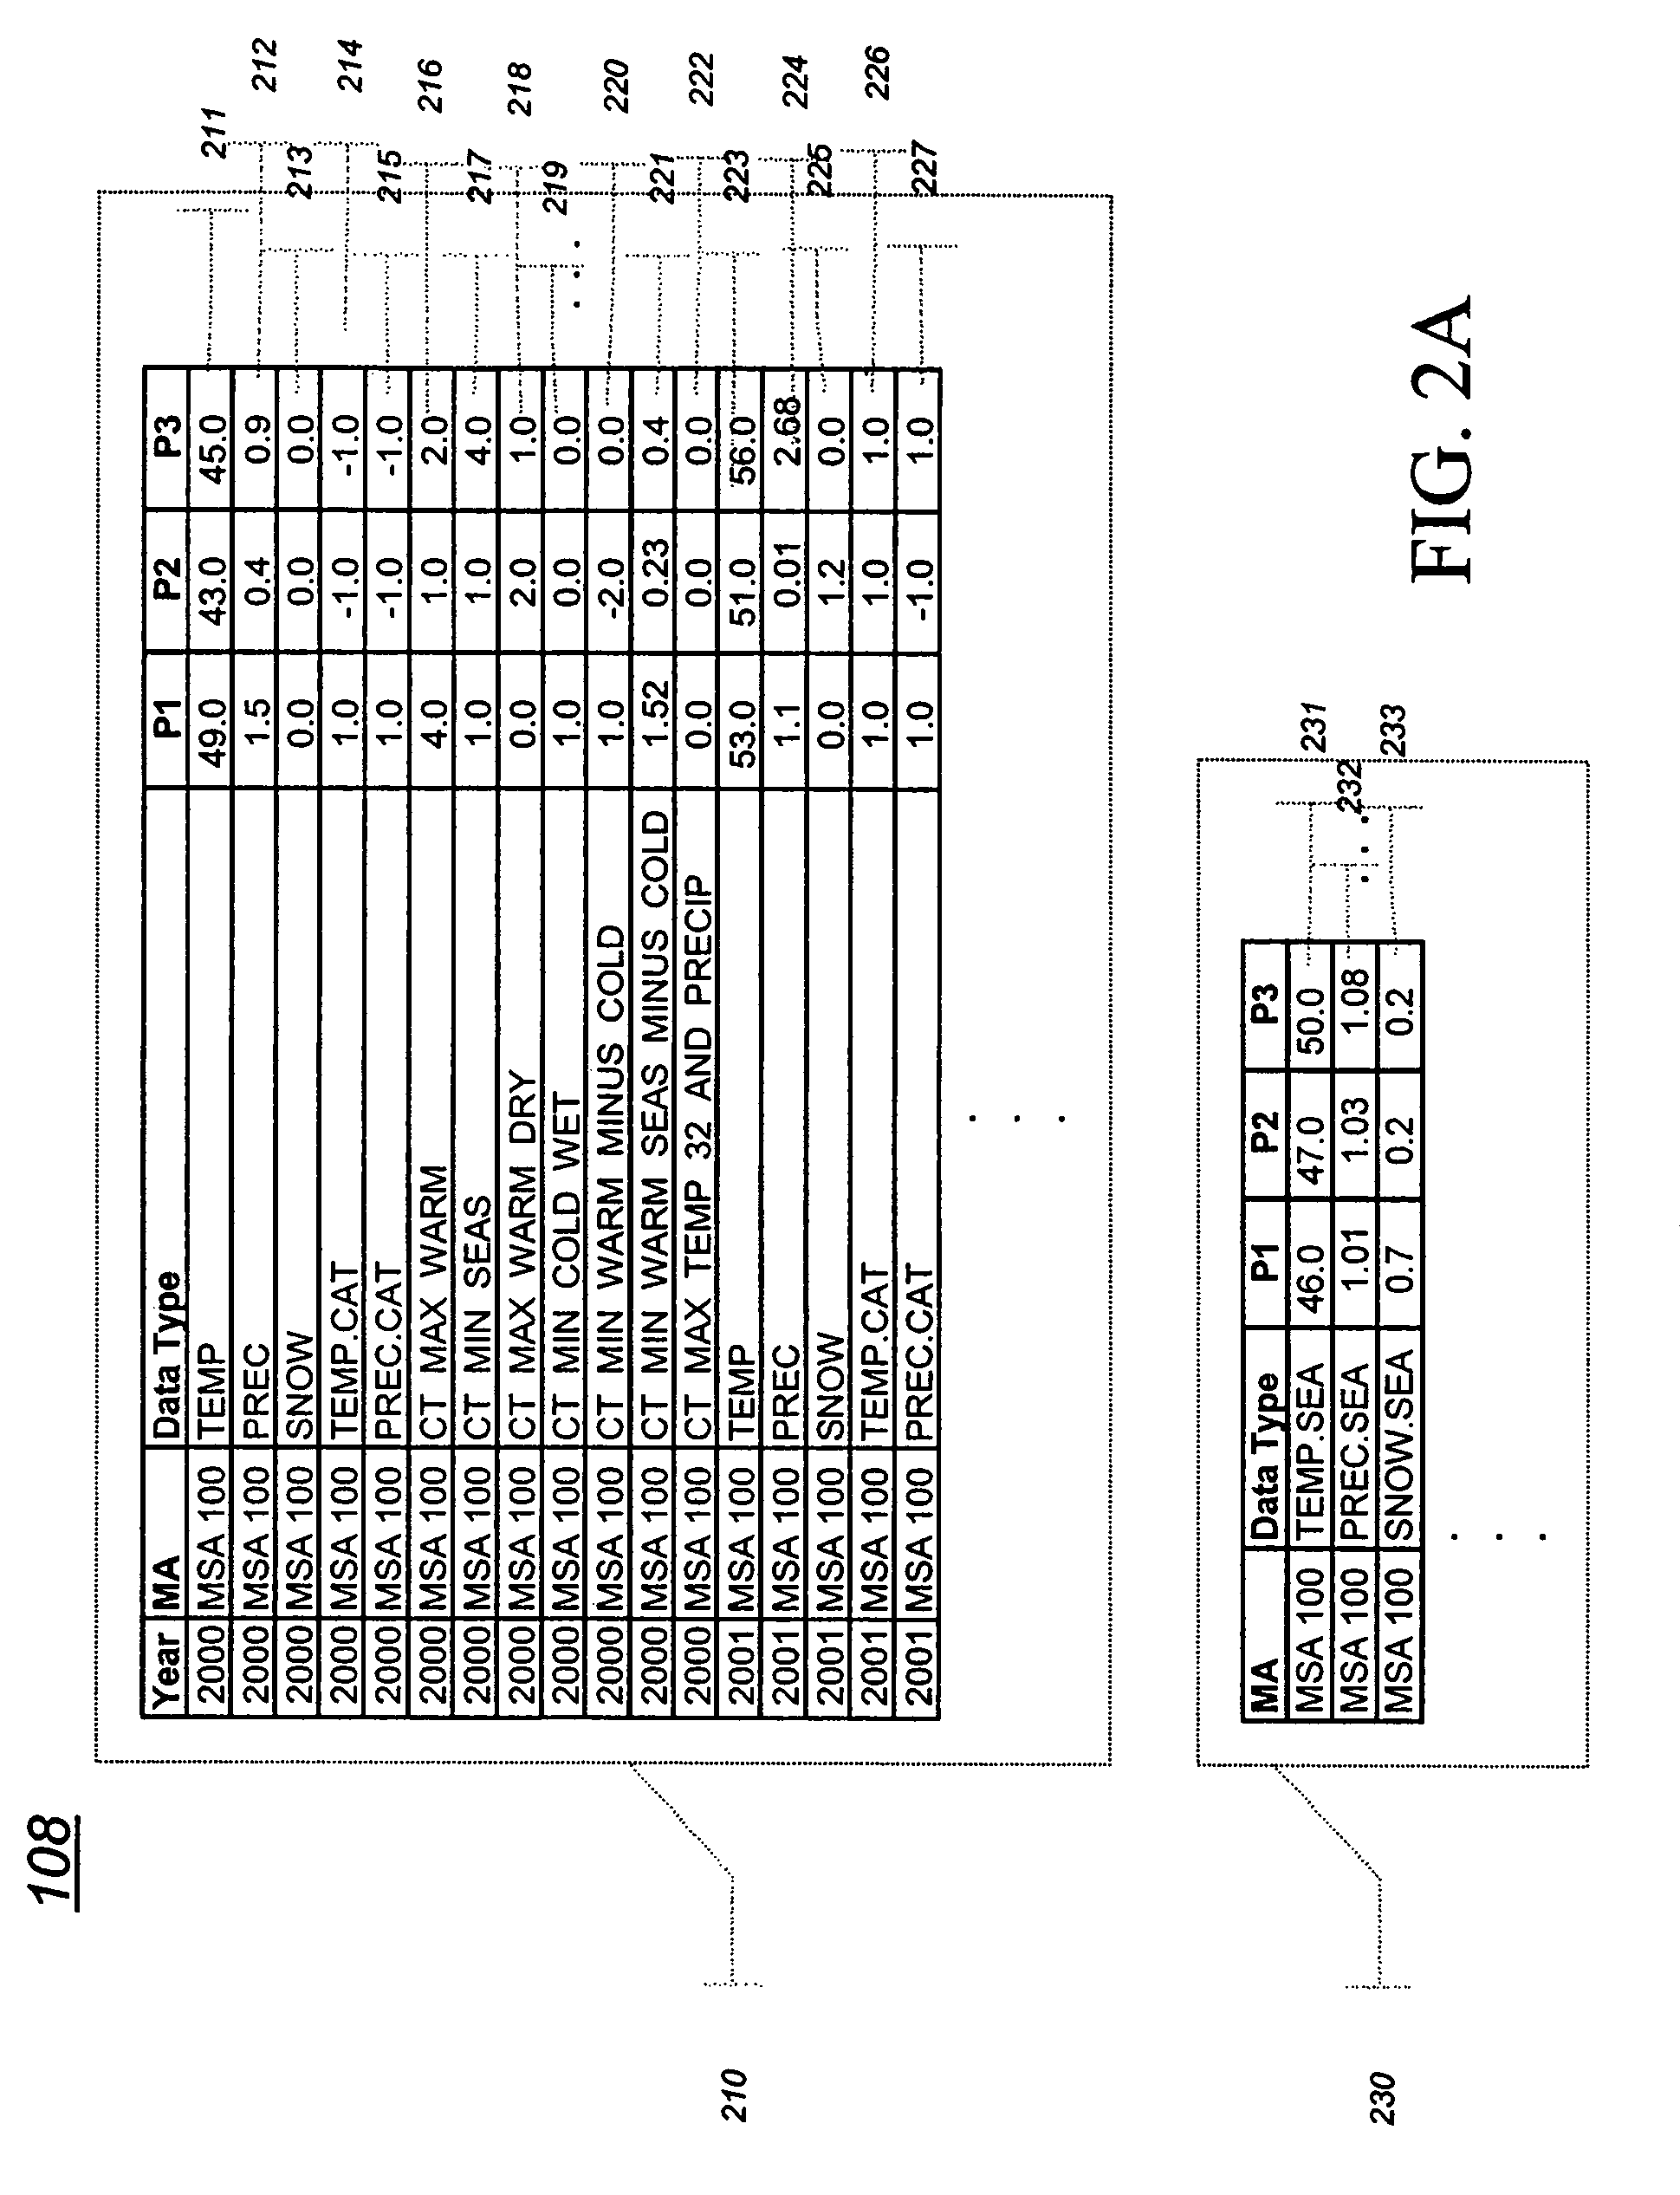
[0094]In a first embodiment, weather factor relationship knowledgebase 110 comprises at least one empirical scoring matrix. FIG. 3 shows weather factor relationship knowledgebase 110 with an exemplary empirical scoring matrix 310. Scoring matrix 310 is described in U.S. application Ser. No. 09 / 656,397, which is incorporated in its entirety herein by reference. Scoring matrix 310 provides values (e.g., “scores”) indicative of weather-based demand as a function of categories for two category weather data types. In scoring matrix 310, for example, weather-based demand for various combinations of temperature and precipitation category weather data is scored as integers in which −2 corresponds to “most unfavorable”, −1 corresponds to “unfavorable”, 0 corresponds to “typical”, 1 corresponds to “favorable”, and 2 corresponds to “most favorable”. Values in scoring matrix 310 can be determined from an analysis of normalized proxy sales history data for the specific product vis-à-vis the cate...

second embodiment

[0100]In a second embodiment, weather factor relationship knowledgebase 110 comprises at least one weather indices template. FIG. 4 shows weather factor relationship knowledgebase 110 with an exemplary weather indices template 400. Weather indices template 400 can identify an applicable weather index for a specific product / location / time period combination. The applicable weather index for the specific product / location / time period combination can be determined from an analysis of normalized proxy sales history data for the specific product / location / time period combination. The analysis can use statistical techniques, expert assessment, expert definition, or any combination of the foregoing. For example, correlation coefficients between the weather indices and the normalized proxy sales history data can be developed and used to identify a most applicable weather index for the specific product / location / time period combination.

[0101]Furthermore, if the same weather index is determined f...

third embodiment

[0106]In a third embodiment, weather factor relationship knowledgebase 110 comprises at least one proxy model conditions template 500. FIG. 5 shows weather factor relationship knowledgebase 110 with an exemplary proxy model conditions template 500. Proxy model conditions template 500 provides, for a specific product / location / time period combination, a weather-based demand coefficient for at least one actual weather data type, and historically modeled minimal and maximal values. In proxy model conditions template 500, for example, temperature-based demand coefficients and precipitation-based demand coefficients are shown for demand for BOOTS in MSA 100 for various periods of time. In forecasting weather-based demand, minimal and maximal values provide, respectively, lower and upper limits. The lower and the upper limits determine the forecasted weather-based demand in the event that actual weather data is at such an extreme value that the relationship between demand and the weather c...


PUM


Abstract

Weather metrics data and a weather factor relationship knowledgebase are received and used to forecast the weather-based demand. The weather factor relationship knowledgebase can be a weather-impact model. The weather-impact model can comprise at least one of an empirical scoring matrix, a weather indices template, and a proxy model conditions template. The weather-impact model can be derived from an analysis of normalized proxy sales history data. Optionally, the weather-based demand can be scaled, deaggregated, or both.

Description

CROSS-REFERENCE TO RELATED APPLICATIONS[0001]This application is a continuation-in-part of U.S. application Ser. No. 09 / 656,397, filed Sep. 6, 2000 now U.S. Pat. No. 7,069,232, which is a continuation-in-part of U.S. application Ser. No. 09 / 097,714, filed Jun. 16, 1998 now U.S. Pat. No. 7,103,560, which is a continuation of U.S. application Ser. No. 08 / 588,248, filed Jan. 18, 1996, now U.S. Pat. No. 5,832,456, each of which is incorporated herein in its entirety by reference.[0002]The following applications of common assignee are related to the present application and each is incorporated herein in its entirety by reference:[0003]“System and Method for the Advanced Prediction of Weather Impact on Managerial Planning Applications,” U.S. application Ser. No. 08 / 002,847, filed Jan. 15, 1993, now U.S. Pat. No. 5,521,813.[0004]“System and Method for Determining the Impact of Weather and Other Factors on Managerial Planning Applications,” U.S. application Ser. No. 08 / 205,494, filed Mar. 4...

Claims


Application Information

Patent Timeline
IPC IPC(8): G06Q40/00G06Q10/00G06Q30/00
CPCG06Q10/06G06Q30/02G06Q30/0202G06Q40/00G06Q40/04
Inventor WILLEN, MICHAEL A.ESTORNELL, DAVID G.KIRK, WILLIAM E.MILLER, ELI H.WALSH, PAUL E.
Owner PANALEC
Learn More