Method and system for displaying predictions on a spatial map

a technology of spatial map and system, applied in the field of systems and methods for making and displaying predictions on spatial maps, can solve the problems of inability of a decision-maker to quickly parse though, complex predictions made in relation to spatial maps, and inability to quickly parse disparate data

Inactive Publication Date: 2010-12-21
SAAMA TECH LLC
View PDF6 Cites 49 Cited by
  • Summary
  • Abstract
  • Description
  • Claims
  • Application Information

AI Technical Summary

Benefits of technology

[0005]The present invention seeks to aid decision-makers in reviewing data related to geographical locations by presenting the data in a user-friendly output format.

Problems solved by technology

Predictions made in relation to a spatial map may be complex and include several variables.
Some decision makers have, at times, been overwhelmed by the presentation of disparate data in a non-user friendly form.
The inability of a decision-maker to quickly parse though numerous predictions could render such predictions virtually valueless.

Method used


Image

  • Method and system for displaying predictions on a spatial map
  • Method and system for displaying predictions on a spatial map
  • Method and system for displaying predictions on a spatial map

Examples


Embodiment Construction

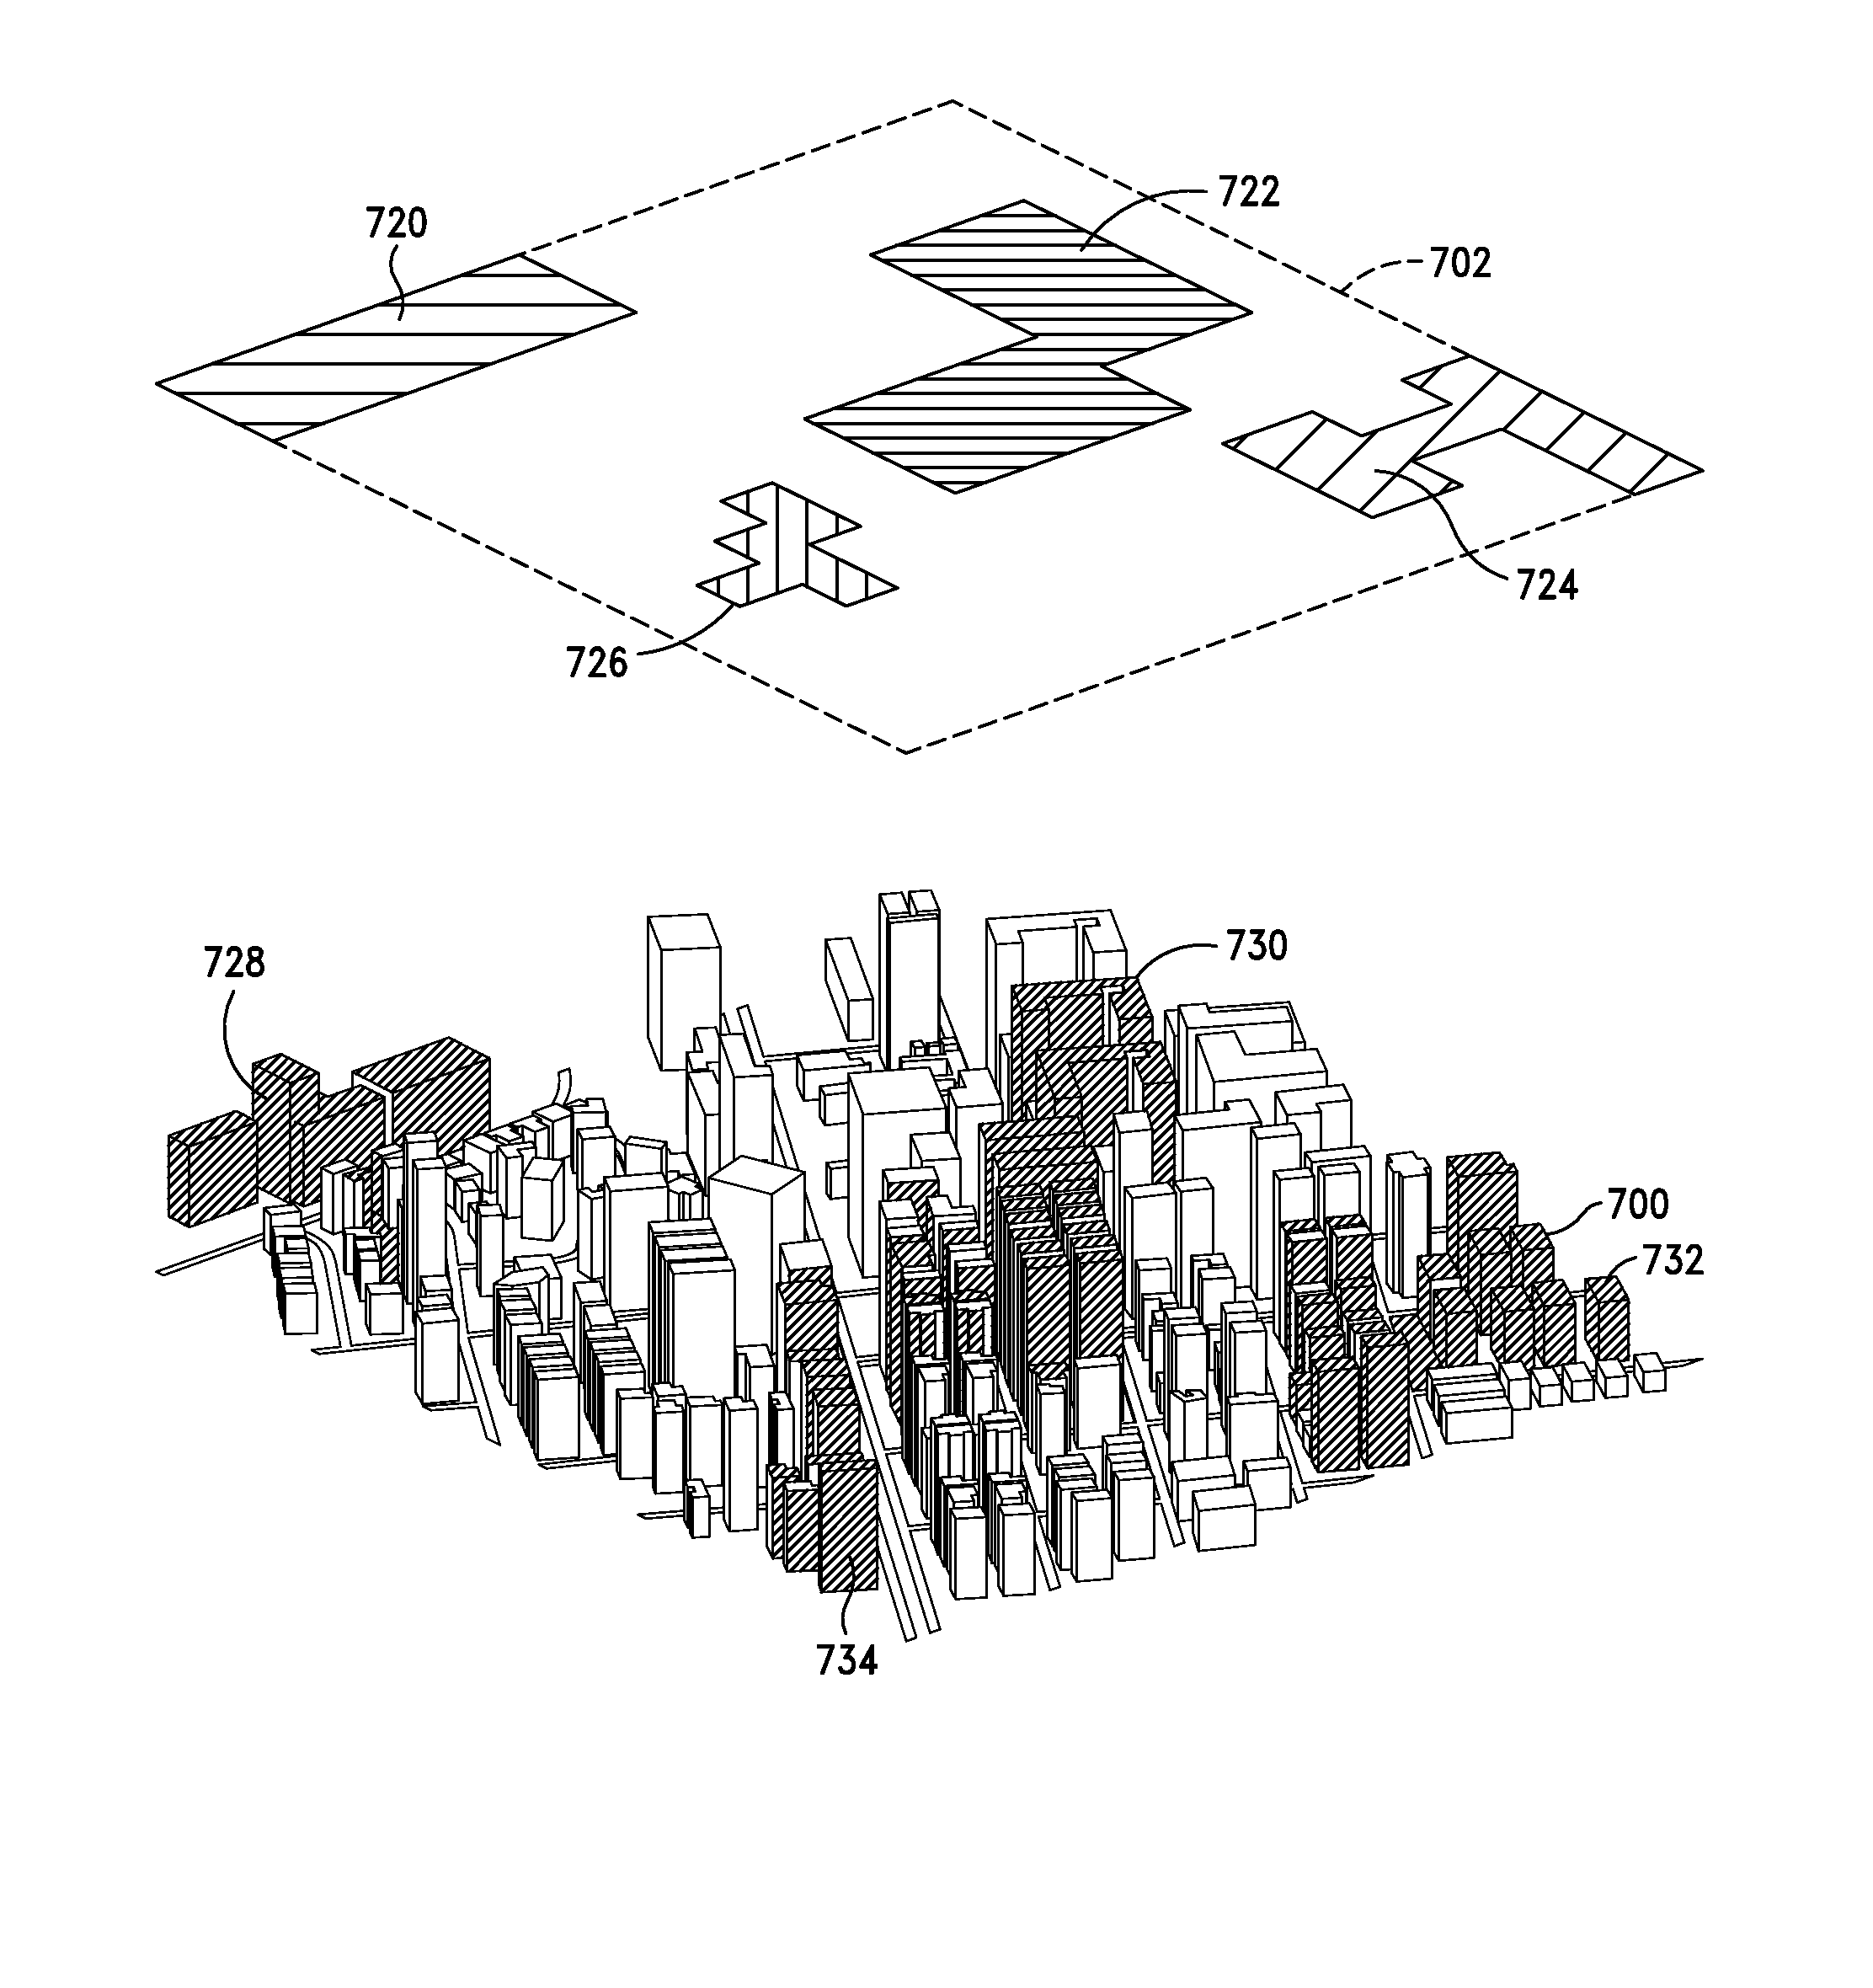
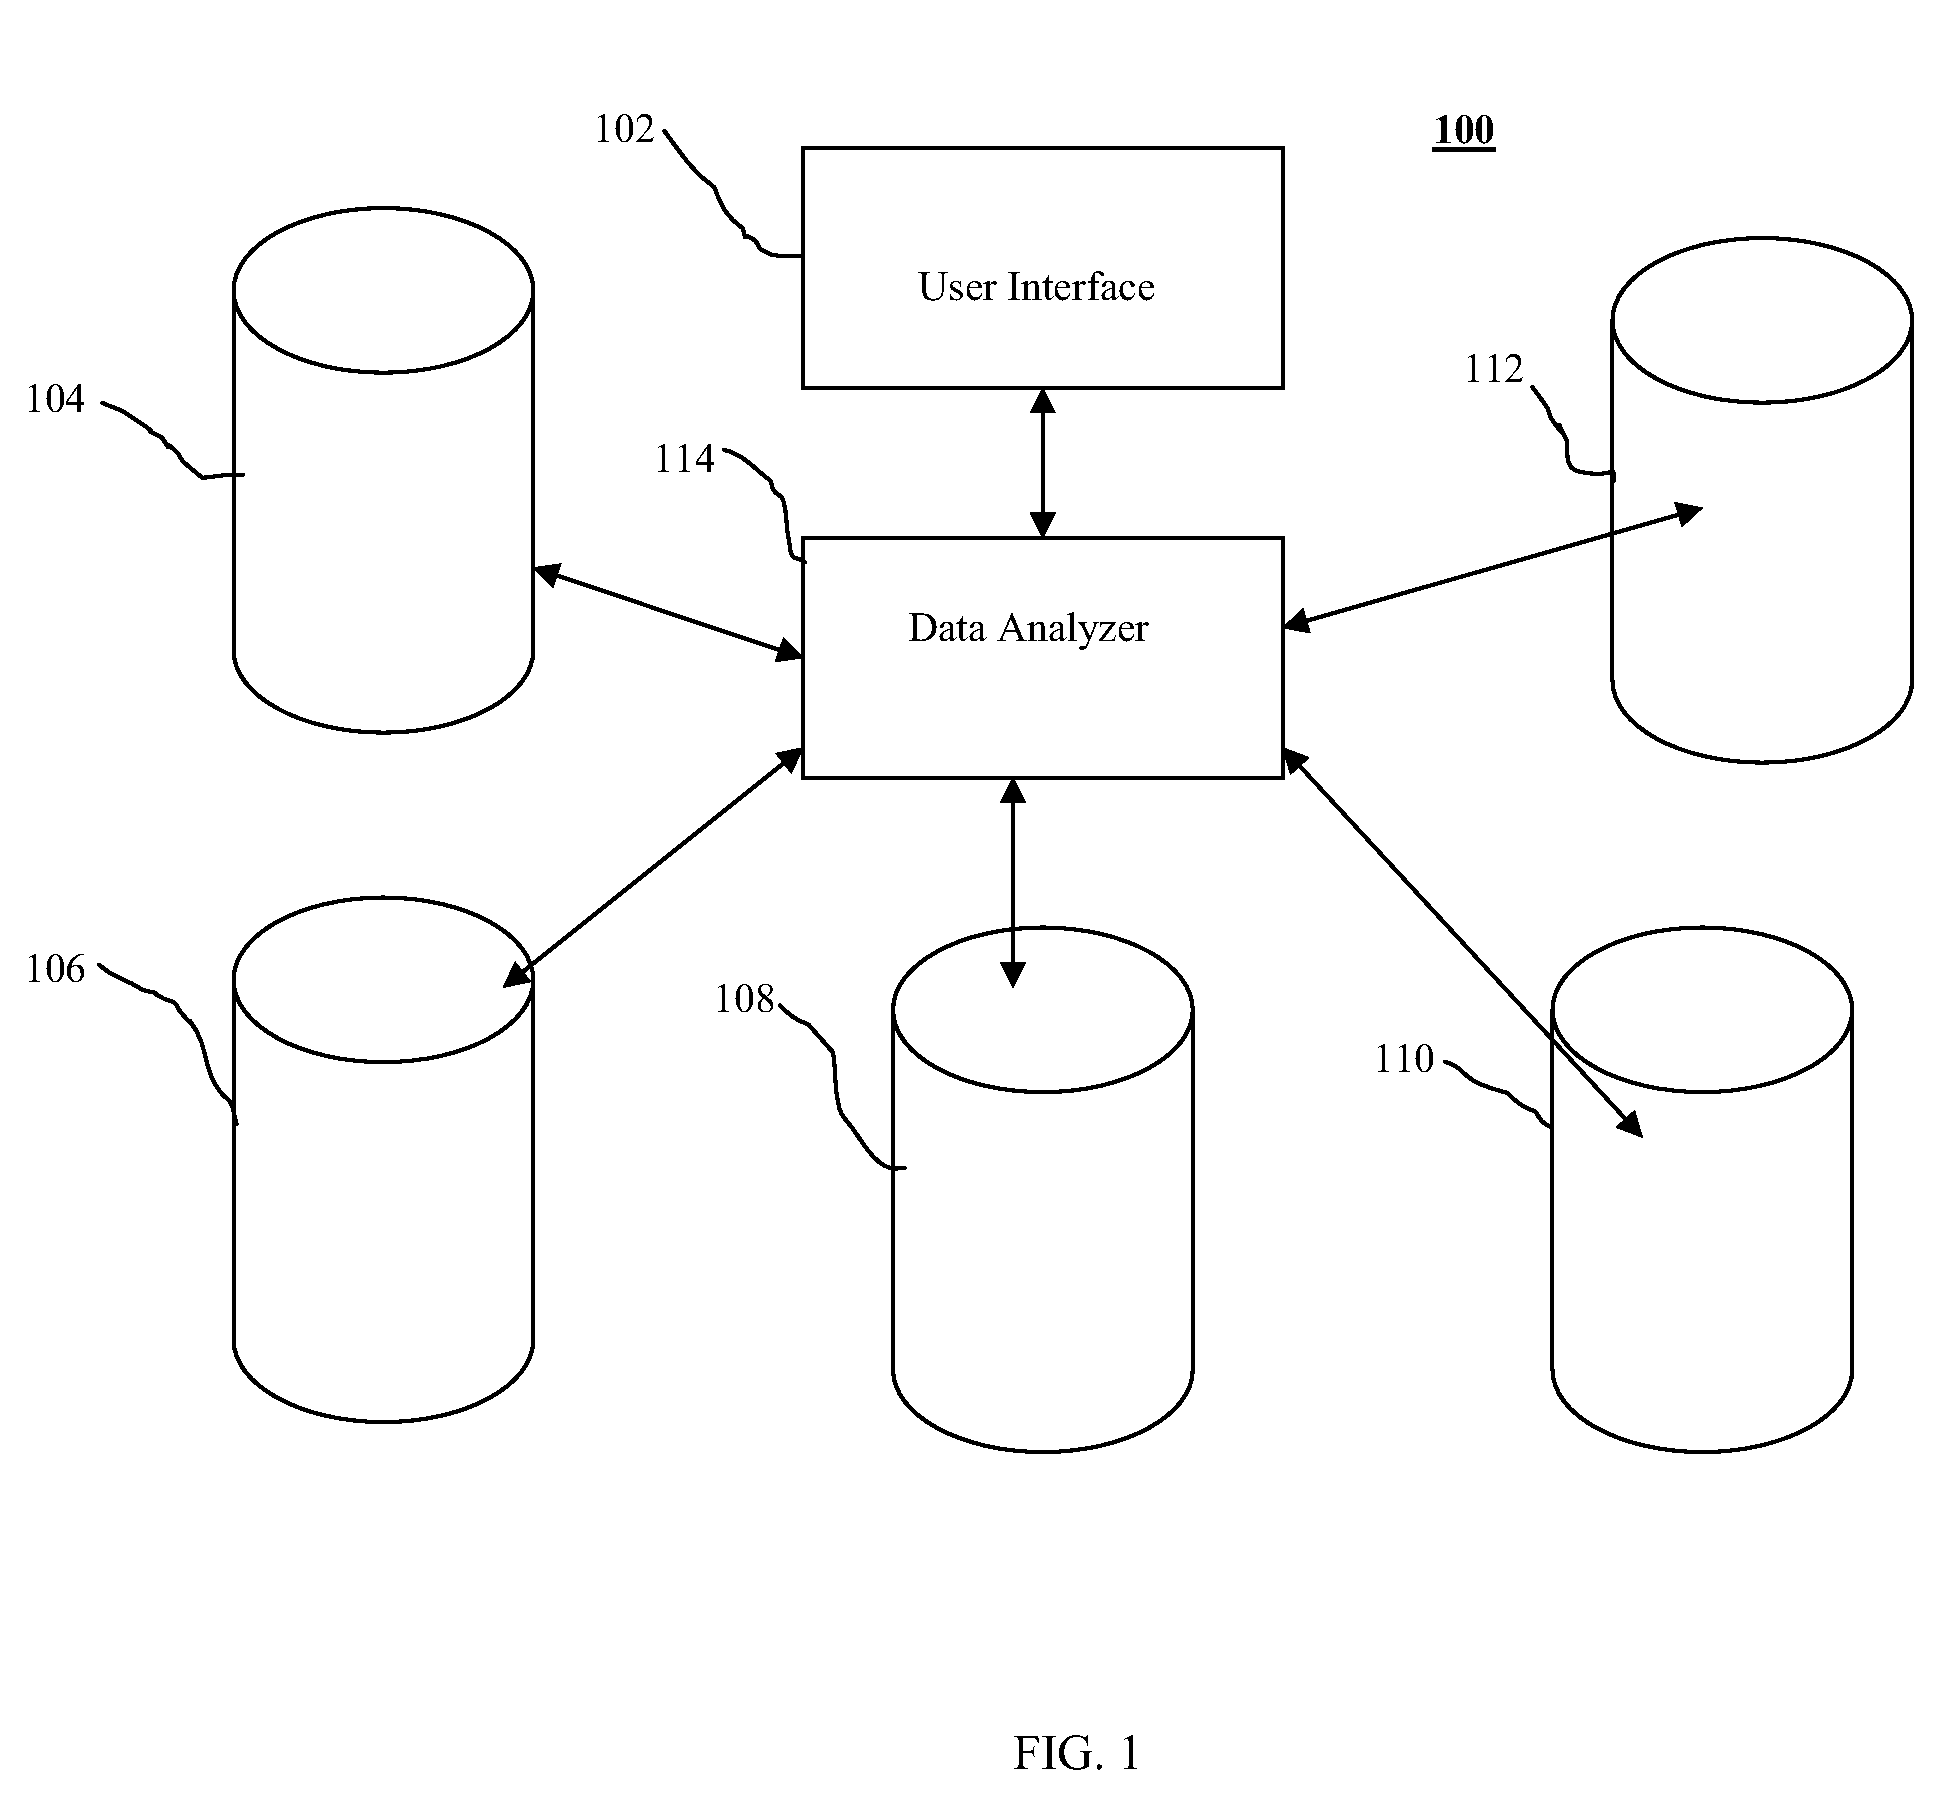
[0021]FIG. 1 is a system 100 for optimizing business location selection. The system includes a user interface 102, heterogeneous databases 104, 106, 108, 110, and 112 and a data analyzer 114. The databases hold structured data, unstructured data, semi-structured data and spatial data. The interface is connected in communication with the data analyzer for displaying a three dimensional spatial map.

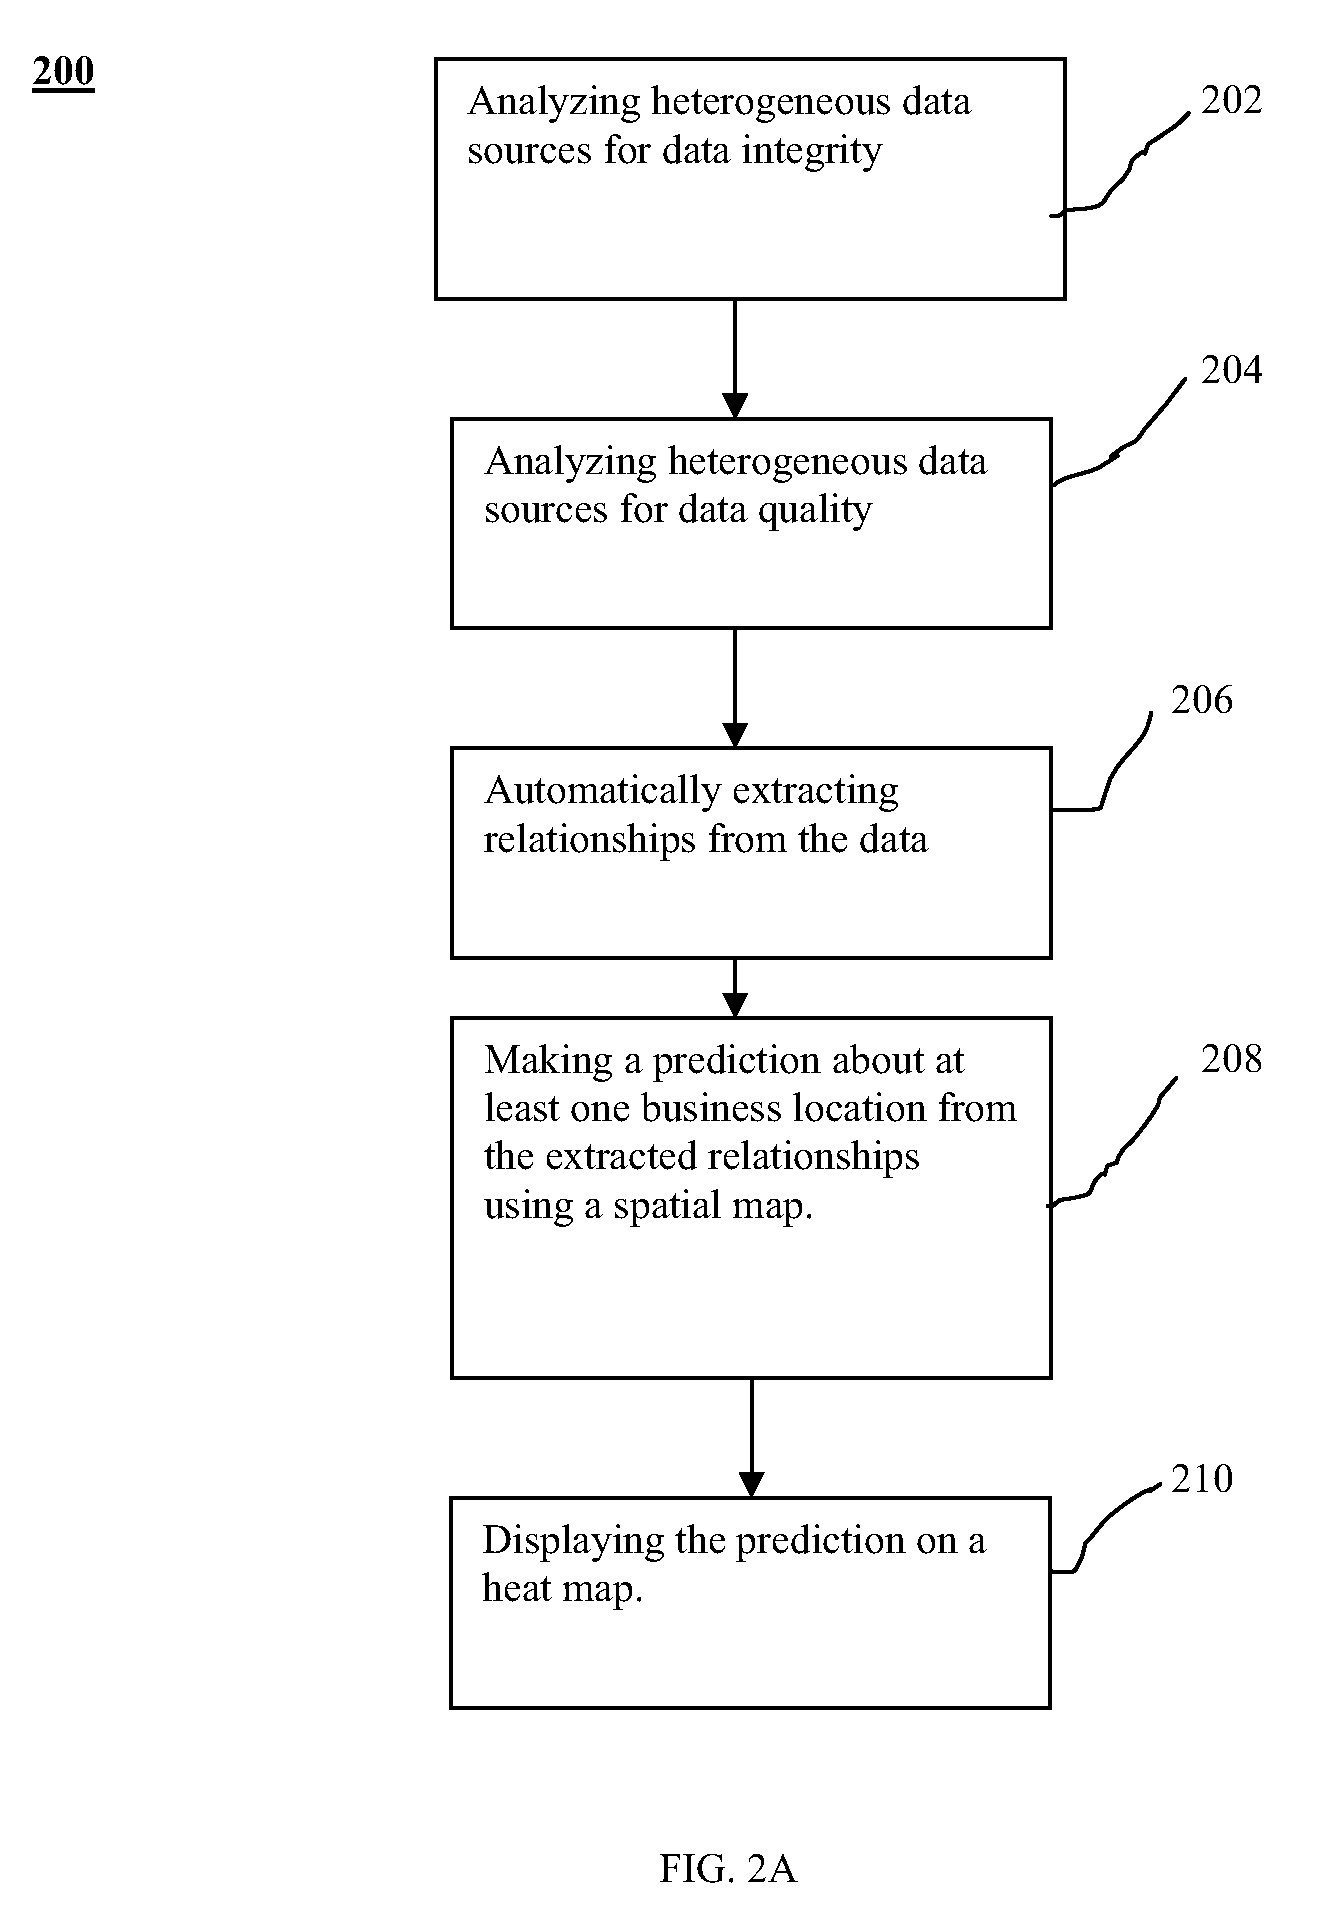
[0022]The data analyzer 114 includes a computer with programmed with software, which enables communication with the databases 104, 106, 108, 110, and 112 to analyze data integrity and data quality. The databases 104, 106, 108, 110, and 112, and the data contained therein are analyzed to find utilizable data. The analyzer 114, which includes a computer programmed with software, automatically extracts relationships from the utilizable data.

[0023]According to one aspect of the invention the system 100 includes a networked computing environment, which communicates with the various database 104,...


PUM


Abstract

A method and system for displaying predictions on a spatial map includes using a data analyzer for analyzing heterogeneous data having a spatial component to find utilizable data and using machine learning to automatically extract relationships from the utilizable data. The extracted relationships are used to make a prediction about at least one location on the spatial map and present that prediction in an oblique or perspective view. An interface presents the prediction on the spatial map in the form of a heat map overlying a 3-D topographical map. Although the 3-D map can be shown as any form of graphical projection including an oblique projection or orthographic projection, preferably a perspective view is used. It is also preferred that the graphical projection be interactive. The heat map may be 2-D or 3-D and be selectively displayed depending on the preference of a user.

Description

CROSS-REFERENCE TO RELATED APPLICATIONS[0001]This application relates in subject mater to commonly owned U.S. patent application Ser. No. 11 / 710,093, filed Feb. 23, 2007.FIELD OF THE INVENTION[0002]The present invention pertains to systems and methods for making and displaying predictions on a spatial map.BACKGROUND OF THE INVENTION[0003]Predictions made in relation to a spatial map may be complex and include several variables. However, there are many business, municipal and investment decision-makers that would like to grasp valuable information from glancing at the output of predictive computing methods. For example, there is value in gaining insight into a particular geographical location for predicting optimal store, hospital, fire house, and other locations. There is also value in predicting localized real-estate value trends, predicting voter turnout in a political campaign, and gauging the expected efficacy of an advertising campaign.[0004]In the past a data analyst had to in...

Claims


Application Information

Patent Timeline
Patent Type & Authority Patents(United States)
IPC IPC(8): G06F17/00
CPCG06Q10/04G06Q10/06G06Q30/0205G09B29/006
Inventor KATTA, SURESHGNANA, HARANATH
Owner SAAMA TECH LLC
Why Eureka
Try Eureka