
Method and system for real-time prediction of power usage for a change to another performance state

a technology of power usage and performance state, applied in the field of power/performance measurement and management in processing systems, can solve the problems of large-scale systems that cannot be installed or fabricated with sufficient power availability or thermal handling capability, and particular server racks may exceed the available power, etc., to achieve accurate prediction

Inactive Publication Date: 2011-03-08
IBM CORP
View PDF37 Cites 33 Cited by
  • Summary
  • Abstract
  • Description
  • Claims
  • Application Information

AI Technical Summary

Benefits of technology

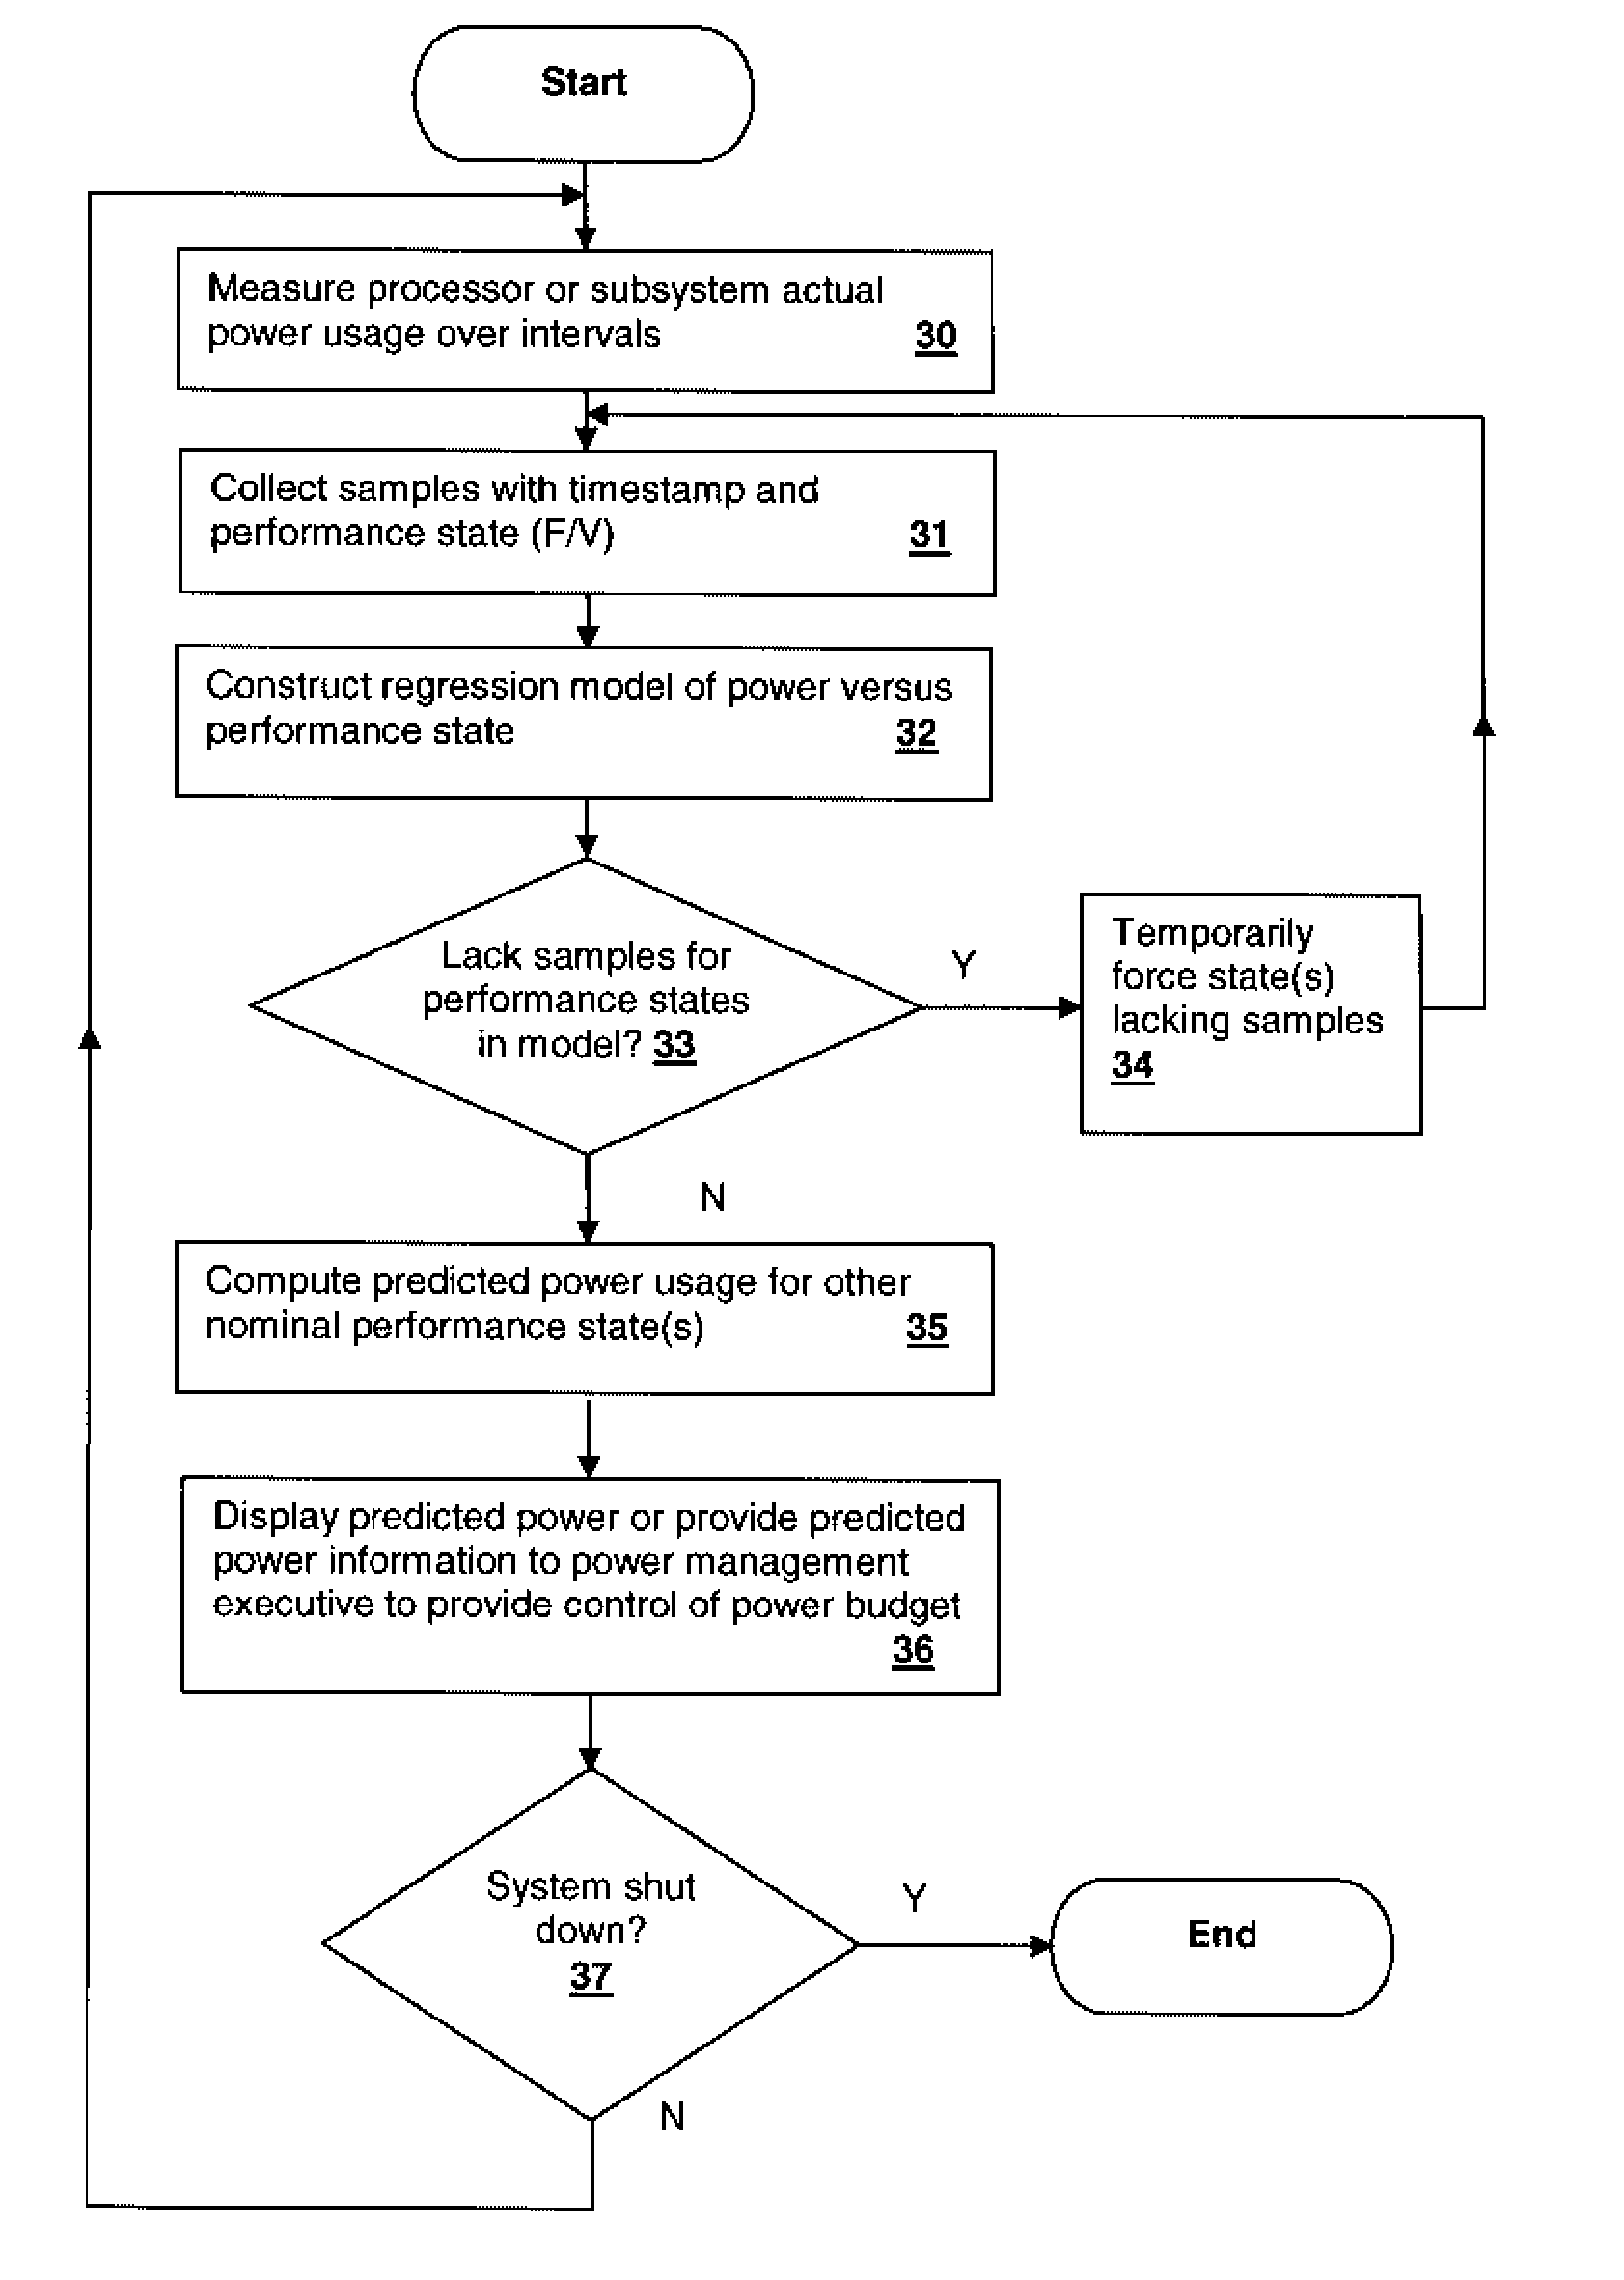
The patent describes a method and system for predicting the power usage of a sub-system based on its performance state. This allows system operators to be informed of potential power usage changes for changes in performance states of individual subsystems. The method and system use a model based on real-time power consumption data to predict the power usage required for a particular performance state. The system measures and stores power usage data along with a time stamp and an indicator of the performance state of the sub-system. The model is generated from the distribution of the samples and may be a regression extended to the particular performance state(s) for which the power usage prediction is / are desired. The technical effect of the invention is to accurately predict power usage for a change in performance state and inform system operators of potential power usage changes for changes in nominal performance states of individual subsystems.

Problems solved by technology

In particular, very large scale systems may not be installed or fabricated with enough power availability or thermal handling capability to run all processors in the system at their maximum performance levels continuously.
Nor is such use typically desirable.
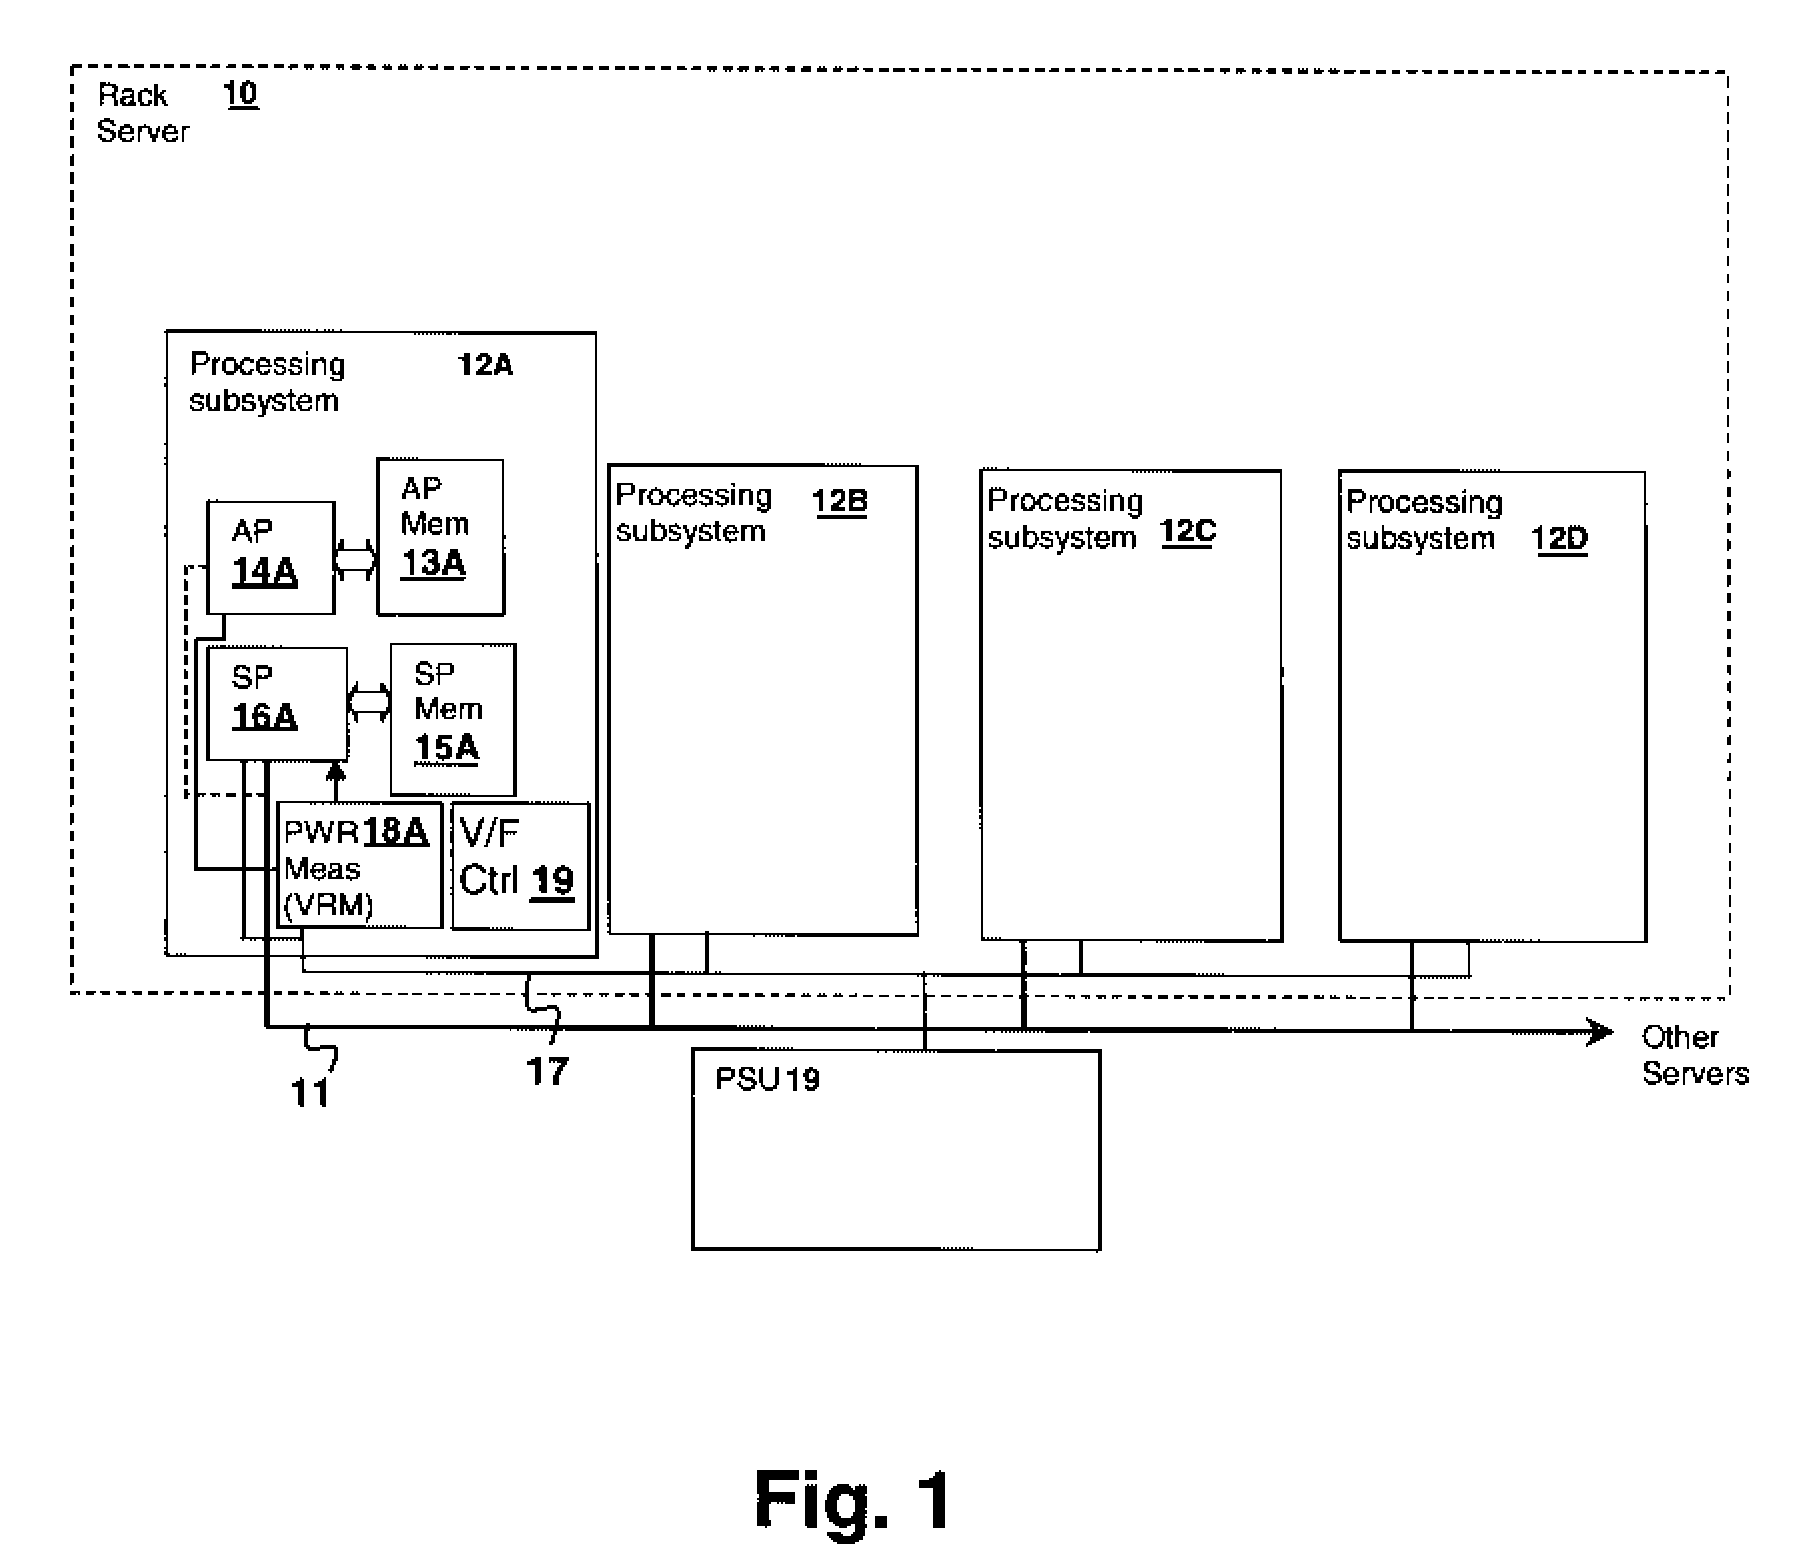
Server complexes, or even a particular server rack may exceed the available power if each processor is operated at full capacity, assuming sufficient cooling is available to maintain the system heat at an equilibrium level.
The circuit from which the server system draws power may be limited, and further, the power delivered to an overall facility may be limited.
However, the information available to such systems typically includes only present-time power usage for the various processing sub-systems and estimated maps of performance levels versus power usage for specified workloads.
With real-time power / performance control operating at high update rates in a processing system, the impact of a power budget that does not take into account the real-time workload and environmental changes is a loss in efficiency due to decisions that are not informed at a sufficient rate.
For example, a particular sub-system might provide higher performance for the given workload if its power budget were increased slightly, but the power level cap for that sub-system does not permit a change in the nominal performance state and it is not apparent that the change would be slight.
In converse, a sub-system may have a workload that is inefficiently using power and could dramatically change its power usage with only a small change in nominal performance state.
While techniques such as dynamic voltage-frequency scaling (DVFS) and clock modulation can rapidly respond to power budget changes, e.g., changes in “capped” peak power, without information as to how the performance of each sub-system relates to the power usage for the sub-system, power management algorithms lack information on how changes in the power caps will affect system efficiency.
However, historical workload data is not typically sufficient to perform such real-time fine-tuning of power budgets, and while the input control to the individual subsystem is the performance state operating point, the limiting factor is generally the power cap.

Method used


Image

  • Method and system for real-time prediction of power usage for a change to another performance state
  • Method and system for real-time prediction of power usage for a change to another performance state
  • Method and system for real-time prediction of power usage for a change to another performance state

Examples


Embodiment Construction

[0019]The present invention concerns a technique for determining the power that would be used by processor or subsystem, such as a server or server facility, if the nominal performance level of the processor or subsystem were adjusted to another level. In one application, the present invention determines the “demand power”, i.e., that power that would be used by the processor or subsystem under current workload and environmental conditions if the performance of the processor or subsystem were set to the maximum level. In other embodiments, the present invention determines one or more power usage predictions for specified nominal performance levels other than the nominal performance level to which the processor or subsystem is set. “Nominal performance level” indicates that while the performance level of the processor or subsystem is generally dynamically changing, and therefore there is generally no specific performance level other than the maximum performance level that is “set” by...


PUM


Abstract

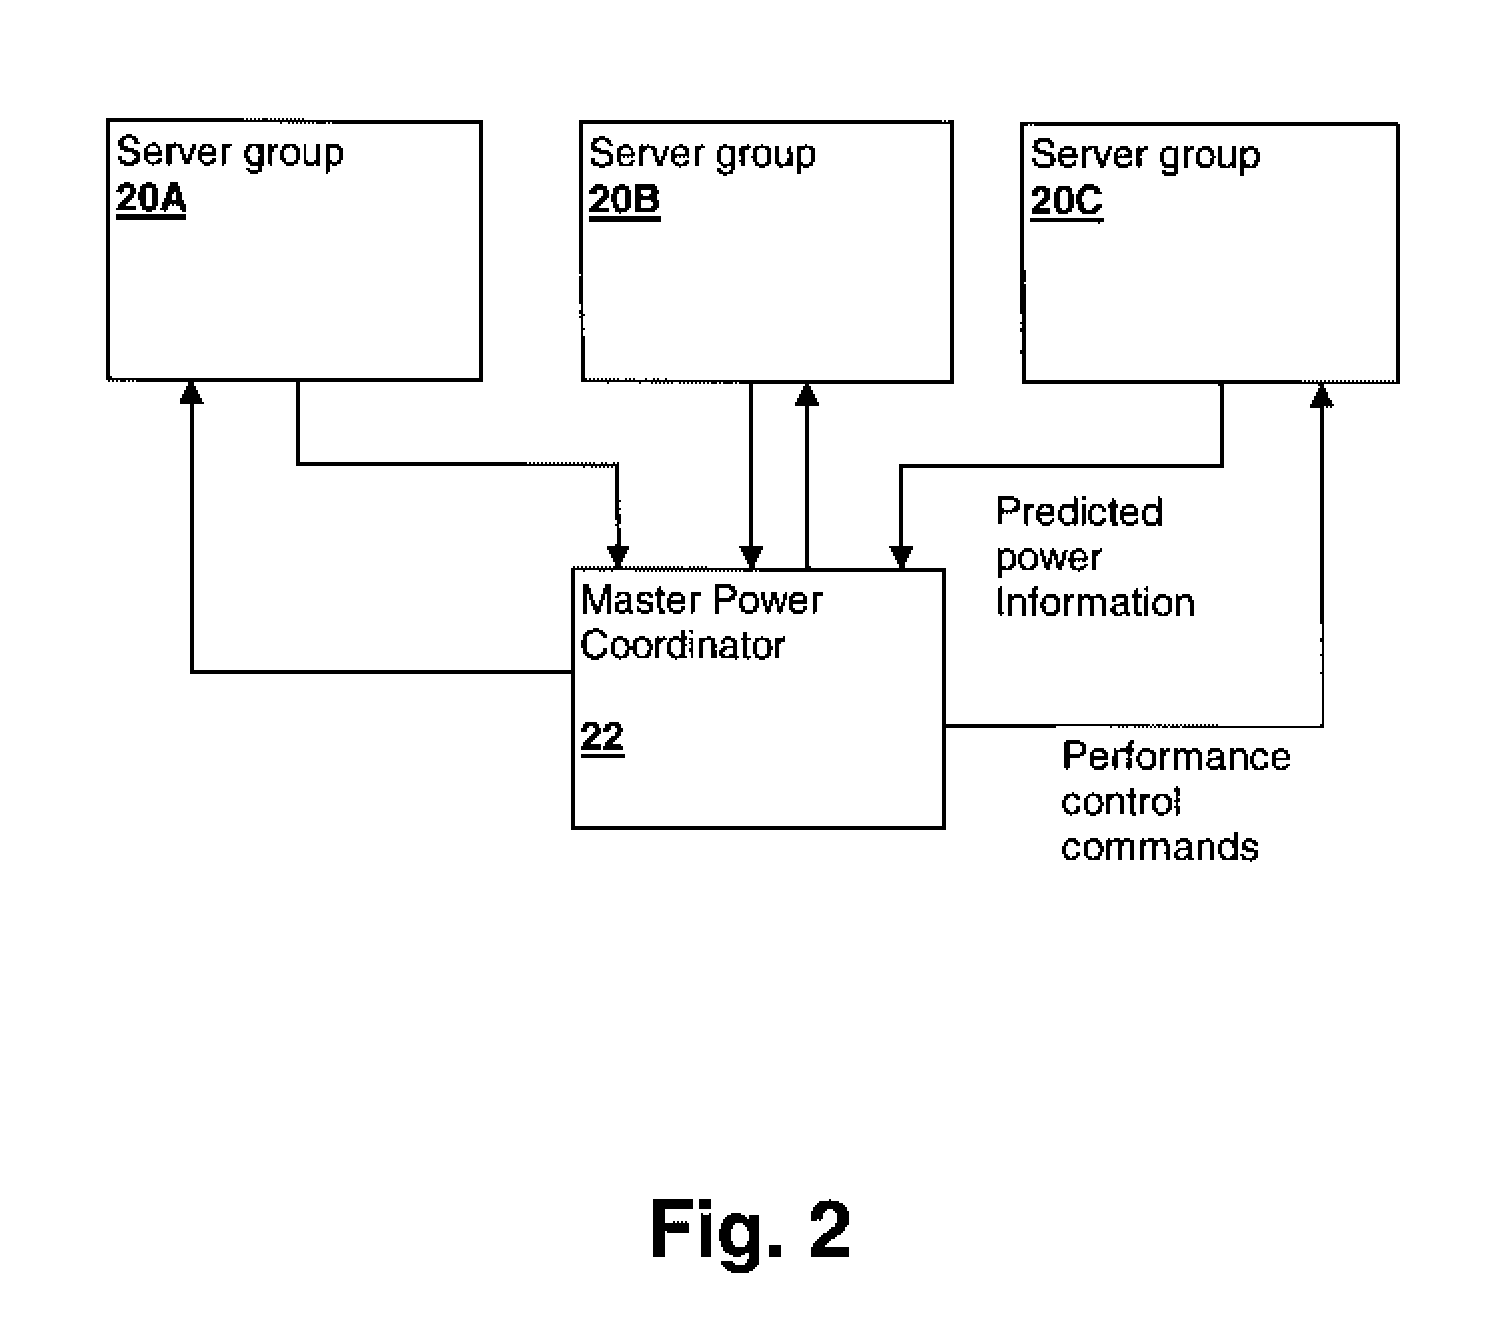
A method and system for real-time prediction of power usage for a change to another performance state provides input data for power management decision-making processes or for display to system operators. The unit(s) for which power usage is predicted may be a single processor in a uni-processor system or may extend up to the level of facilities within a complex of processing facilities. The method and system gather real-time data on the power consumption of the unit(s) and create a model, such as a regression model, of power versus performance. A resulting power usage change required by a prospective nominal performance state change is shown as display data, or is transmitted to a power budgeting controller to inform the controller as to potential changes that can enhance system operation, such as managing tradeoffs of power allocated to various sub-units of a processing system.

Description

BACKGROUND OF THE INVENTION[0001]1. Technical Field[0002]The present invention relates generally to power / performance measurement and management in processing systems, and more particularly, to a prediction scheme for predicting subsystem or processor power needs for a change to another nominal performance state.[0003]2. Description of the Related Art[0004]Power management in both large and small scale systems has become a necessity, for reason of both thermal management and power cost and power availability. In particular, very large scale systems may not be installed or fabricated with enough power availability or thermal handling capability to run all processors in the system at their maximum performance levels continuously. Nor is such use typically desirable. Server complexes, or even a particular server rack may exceed the available power if each processor is operated at full capacity, assuming sufficient cooling is available to maintain the system heat at an equilibrium level...

Claims


Application Information

Patent Timeline
Patent Type & Authority Patents(United States)
IPC IPC(8): G06F9/44G06F13/10G06F13/12
CPCG06F11/3447G06F11/3476Y02B60/165Y02D10/00
Inventor LEFURGY, CHARLES R.GOVINDAN, MADHU SARAVANA SIBI
Owner IBM CORP
Learn More